XAUUSD: Bearish Drop to 4375?FX:XAUUSD is eyeing a bearish reversal on the 4-hour chart , with price approaching the 0.618 Fibonacci extension near an upward channel, converging with a potential entry zone that could trigger downside momentum if sellers defend against further upside. This setup suggests a pullback opportunity amid the recent rally, targeting lower support levels with strong risk-reward exceeding 1:5 .🔥
Entry between 4540–4560 for a short position. Target at 4375 . Set a stop loss at a daily close above 4570 , yielding a risk-reward ratio of more than 1:5 . Monitor for confirmation via a bearish candle close below entry with rising volume, leveraging gold's volatility near the extension.🌟
Fundamentally , gold is trading around $4,470 in late December 2025, with key US Dollar events next week potentially influencing strength through growth and sentiment indicators. On December 23 at 8:30 AM ET, the GDP Q3 Third Estimate (forecast 3.2%) could bolster USD if revised higher, signaling robust economy. Followed by Consumer Confidence at 10:00 AM ET (forecast 89), where stronger readings might support USD amid labor resilience. On December 29 at 10:00 AM ET, Pending Home Sales (Nov) could pressure USD if weaker, reflecting housing market slowdowns. Overall, positive US data surprises could strengthen the Dollar, weighing on gold prices. 💡
📝 Trade Setup
🎯 Entry (Short):
4540 – 4560
(Entry at these levels is valid with proper risk & capital management.)
🎯 Target:
• 4375
❌ Stop Loss:
• Daily close above 4570
⚖️ Risk-to-Reward:
• > 1:5
💡 Your view?
Does XAUUSD reject the 0.618 extension and slide toward 4375 — or do buyers force a breakout above the channel? 👇
Commodities

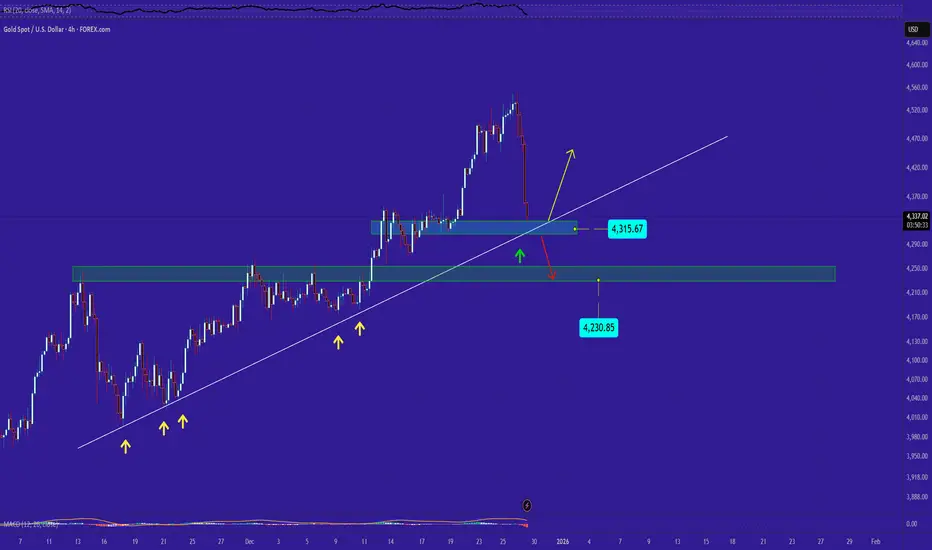
GOLD's SituationFor this drop, we can consider two support levels: one dynamic and one static. I’m hoping the dynamic support line can stop the decline. If not, and the dynamic support is broken, the price may fall down to around 4230.
Silver’s 2025 Explosion — How High Can It Go?In 2025, Silver ( OANDA:XAGUSD ) has experienced a remarkable surge, making it one of the most notable assets of the year. As we approach the end of 2025, I’ve decided to analyze silver to see how far its bullish trend might continue. So, stay with me as we delve into the reasons behind silver’s rise and explore how far this upward momentum could go.
Let’s begin by looking at the fundamental factors driving silver’s increase in 2025. After that, we’ll move on to the technical analysis.
Fundamental Drivers Behind Silver’s Massive 2025 Rally:
Structural Supply Deficit — Multi‑year deficits draining inventories, tight physical market.
Strong Industrial Demand — Solar, EVs, semiconductors & data centers consuming silver at record levels.
Rate Cut Expectations — Anticipated Fed easing lifts non‑yielding assets like silver.
Safe‑Haven Flows — Geopolitical risk, inflation, and a softer dollar boosting precious metals demand.
Liquidity & Momentum — Smaller market vs gold( OANDA:XAUUSD ) amplifies swings, attracting speculators.
Silver has surged ~ 150–165% YTD , setting fresh all‑time highs as both an industrial metal and investment hedge.
-----------------------
Technical Analysis:
Now, considering the technical side, with less than five days remaining before the six-month and one-year candles close, I’ll focus on a higher time frame for silver’s analysis. Recently, silver achieved a new all-time high, capturing widespread attention, and many prominent figures are now discussing silver’s potential.
From a classic technical analysis perspective on the six-month time frame, it appears that silver has formed a bullish continuation pattern, specifically a cup and handle pattern, and the recent six-month candle has broken the neckline/resistance zone($50-$34) with strong volume. This suggests that the bullish trend for silver is likely to continue.
From an Elliott Wave perspective, it seems that silver is completing wave 3, potentially within an ascending channel and a Potential Reversal Zone(PRZ) .
I expect that silver, upon entering this Potential Reversal Zone(PRZ) , will undergo a correction. If you’re considering adding silver to your portfolio, it’s wise to wait for that correction, as buying at all-time highs can be riskier due to the strong upward momentum.
What do you think? How far can silver’s bullish trend extend, and what levels might we see in 2026?
💡 Please respect each other's opinions and express agreement or disagreement politely.
📌 Silver/ U.S. Dollar Analyze (XAGUSD), 6-month time frame.
🛑 Always set a Stop Loss(SL) for every position you open.
✅ This is just my idea; I’d love to see your thoughts too!
🔥 If you find it helpful, please BOOST this post and share it with your friends.

GOLD (XAU) Outlook - Prediction (12 NOV)GOLD (XAU) Outlook - Prediction
📊 Market Sentiment
Market sentiment for GOLD remains strongly bullish, primarily driven by central bank accumulation. Since 2023, global central banks led by China have been purchasing gold aggressively, creating a durable demand base. With the FED preparing to initiate QE while inflation remains elevated, I think risk assets like GOLD could outperform as the USD (DXY) weakens. This macro setup continues to support a long term bullish narrative.
📈 Technical Analysis
Price has been retracing since October 20, which I think was a healthy correction following a strong expansion. As mentioned in my previous GOLD outlook, price appeared to be retesting the Weekly Value Gap and accumulating within that zone. In my opinion, this accumulation phase seems to have ended, and the market looks ready to continue higher.
📌 Game Plan - Prediction
Price has broken out of the accumulation zone and started expanding upward. I plan to enter after a retest near the key zone around $4060. It may dip toward $4027, which I consider a discount zone. I intend to scale in between $4060 and $3950, with invalidation if the daily candle closes below $3900.
💬 Follow my Substack profile for detailed insights and extended analysis.
⚠️ Disclaimer: For educational purposes only. This is not financial advice.

Gold/Copper Signaling Recession & Market Super bubble!We're continuing to see extreme signals from Gold, and that should raise concerns.
Earlier, I highlighted the Gold/Oil ratio — now, I want to draw your attention to the Gold/Copper ratio:
🔗
Historically, such extreme readings in the Gold/Copper ratio have consistently preceded recessions. The only exception? A period of economic stagnation and sideways markets — not exactly a bullish outcome. See the chart from 2014 to 2016
🔗 www.tradingview.com
Quick recap:
Gold = Fear + Inflation hedge
Copper = Economic strength + Inflation signal
Oil = Similar to Copper; reflects growth and inflation expectations
These divergences aren't random — they’re warning signs of a recession & market Super Bubble that's about to POP!
These are not random fluctuations of prices. You can choose to view them as such. I get it. But from a macroeconomic perspective, this is bad JUJU!
Capitalism without failure is like religion without hell! Remember that!
Click boost, like, and subscribe! Let's get to 5,000 followers! ))

Silver overbought pullback support at 7230The Silver remains in a bullish trend, with recent price action showing signs of a corrective pullback within the broader uptrend.
Support Zone: 7230 – a key level from previous consolidation. Price is currently testing or approaching this level.
A bullish rebound from 7230 would confirm ongoing upside momentum, with potential targets at:
7926 – initial resistance
7154 – psychological and structural level
7397 – extended resistance on the longer-term chart
Bearish Scenario:
A confirmed break and daily close below 7230 would weaken the bullish outlook and suggest deeper downside risk toward:
7126 – minor support
6984 – stronger support and potential demand zone
Outlook:
Bullish bias remains intact while the Silver holds above 7230. A sustained break below this level could shift momentum to the downside in the short term.
This communication is for informational purposes only and should not be viewed as any form of recommendation as to a particular course of action or as investment advice. It is not intended as an offer or solicitation for the purchase or sale of any financial instrument or as an official confirmation of any transaction. Opinions, estimates and assumptions expressed herein are made as of the date of this communication and are subject to change without notice. This communication has been prepared based upon information, including market prices, data and other information, believed to be reliable; however, Trade Nation does not warrant its completeness or accuracy. All market prices and market data contained in or attached to this communication are indicative and subject to change without notice.

Gold corrective pullback support at 4398The Gold remains in a bullish trend, with recent price action showing signs of a corrective pullback within the broader uptrend.
Support Zone: 4398 – a key level from previous consolidation. Price is currently testing or approaching this level.
A bullish rebound from 4398 would confirm ongoing upside momentum, with potential targets at:
4550 – initial resistance
4580 – psychological and structural level
4610 – extended resistance on the longer-term chart
Bearish Scenario:
A confirmed break and daily close below 4398 would weaken the bullish outlook and suggest deeper downside risk toward:
4370 – minor support
4340 – stronger support and potential demand zone
Outlook:
Bullish bias remains intact while the Gold holds above 4398. A sustained break below this level could shift momentum to the downside in the short term.
This communication is for informational purposes only and should not be viewed as any form of recommendation as to a particular course of action or as investment advice. It is not intended as an offer or solicitation for the purchase or sale of any financial instrument or as an official confirmation of any transaction. Opinions, estimates and assumptions expressed herein are made as of the date of this communication and are subject to change without notice. This communication has been prepared based upon information, including market prices, data and other information, believed to be reliable; however, Trade Nation does not warrant its completeness or accuracy. All market prices and market data contained in or attached to this communication are indicative and subject to change without notice.

SOL/USDT | What is Solana doing? (READ THE CAPTION)By analysing the daily chart of SOL CRYPTOCAP:SOL , we can see that it is still struggling to make a move back up, currently being traded at 123.50. If this continues, a drop to 105 doesn't seem that far off.

Crude OilU.S Oil
- Symmetrical Triangle as an corrective pattern in Long Time Frame
- Break of Structure
- Impulse Correction
- Demand Zone
- Change of Characteristics

Gold. Historic chart. Elliottwave structrueGold started trading freely at 40 dollars in august 1971. This is a textbook elliottwave structure. Now gold has hit 2,382 extension where there is a nice confluence with the internal structure. This is the region where wave 3 ends. I expect a longterm downside wave 4 to the region marked by the rectangle. This region is 0,236 - 0,382 retracement measured between wave 2 and wave 3.

PPLT: macro-trend structure Price has reached the first key mid-term resistance zone at 230–278, where a new corrective and consolidation phase may begin to unfold.
The mid-term structure still allows for further upside in the coming weeks, as long as price holds above the 200–185 support area.
On a macro basis, the trend remains constructive, with higher resistance targets at 312–377 in the coming months, provided price stays above the 170 support.
Weekly chart:

THE KOG REPORTTHE KOG REPORT:
In last week’s KOG Report we said we would be looking for the lower red box to be targeted, and if held, we wanted to long to test the high from there. Unfortunately, that level did not present itself ultimately resulting in the break above and then the red box targets being completed in one full sweep. We were a little stretched upside but Excalibur remained consistent and we managed to capture some decent trades not on upside but on the retracements for the RIPs as well.
Not a bad week at all not only on gold but the other pairs we trade and analyse.
So, what can we expect in the week ahead?
As we closed last week we have activations a little higher but without a pullback here I’m not comfortable entering new positions up here due to the shorter TF’s being overbought and sentiment still looking like it’s not convinced.
For that reason, and due to it being the last trading week of the 2025, we’re going to play caution here and instead look above for the RIPs unless our target level below is hit and we get a long from there.
So, we have the resistance level above at 4540 which will need to break for us to then target higher pricing, the pull back here should come from around the 4520 level which will need to hold us up. As long as it does, we see price attempting a new high but it’s that defence we want to watch for a clean reversal. If we can get that and the indicators align, short is the option for us attempting the break of 4520 and then the break of 4500 with the ideal target being the 4470 initially, 4455 and below that 4430-20 region.
The above is based on price remaining below the 4555-65 level.
RED BOXES:
Break above 4540 for 4555, 4565, 4570 and 4583 in extension of the move
Break below 4520 for 4510, 4504, 4490, 4479 and 4465 in extension of the move
Please do support us by hitting the like button, leaving a comment, and giving us a follow. We’ve been doing this for a long time now providing traders with in-depth free analysis on Gold, so your likes and comments are very much appreciated.
As always, trade safe.
KOG

ETH/USDT | No sign of life! (READ THE CAPTION)In the daily chart of ETHUSDT you can see that it has been going up and down in the Bullish OB zone. Currently it's being traded at 2933. No clear sign as to when it'll get its momentum back and go moving upwards.
For the time being, next targets: 3035, 3241and 3447.

USDJPY: bullish momentum eyes 158 breakout🛠 Technical Analysis: On the 4-hour (H4) timeframe, USDJPY continues to trade within a dominant Ascending Channel, maintaining a clear bullish structure. The price has recently successfully retested the "Broken resistance line" (the previous diagonal downtrend) and is now pushing higher, supported by a healthy alignment of moving averages.
The pair is currently positioned above the SMA 50, 100 and 200, which act as a dynamic support cluster. The primary focus is now on the major horizontal Resistance zone at 158. As noted on the chart, the bias remains strongly bullish, and a confirmed breakout above this 158 handle is expected to trigger a significant impulse move toward the upper boundary of the main channel.
———————————————
❗️ Trade Parameters (BUY)
———————————————
➡️ Entry Point: Buy on a confirmed breakout and H4 candle close above 158 (approx. 158.096).
🎯 Take Profit: 161.936 (Upper boundary of the Ascending Channel).
🔴 Stop Loss: 156.175
⚠️ Disclaimer: This is a potential trade idea based on current analysis; market conditions and price direction are subject to change based on news factors and volatility.

GBPUSD: bullish breakout🛠 Technical Analysis: On the 4-hour (H4) timeframe, GBPUSD continues to exhibit a strong bullish structure, following the "Global bullish signal" established earlier in December. The pair has been consistently making higher highs and higher lows, supported by the upward-sloping SMA 50, 100, and 200.
A breakout above the 1.35000 resistance zone is likely to be expected. This is supported by the current accumulation and price consolidation at this resistance.
———————————————
❗️ Trade Parameters (BUY)
———————————————
➡️ Entry Point: After a confirmed breakout (approx. 1.35109).
🎯 Take Profit: 1.35897 (Resistance line).
🔴 Stop Loss: 1.34583.
⚠️ Disclaimer: This is a potential trade idea based on current analysis; market conditions and price direction are subject to change based on news factors and volatility.

The Silent Supercycle: The Trade Hiding in Plain Sight ($DBB)The market loves a shiny object. Right now, that object is Silver ( AMEX:SLV ). Everyone is looking at it. Everyone is talking about it.
But in this game, by the time "everyone" is talking about it, the easy alpha is gone.
I am not interested in chasing a vertical chart. I am interested in Asymmetry. My data suggests the "Smart Money" is quietly positioning for a massive rotation into the backbone of the global economy: Base Metals.
Here is the "Boring" trade that could outperform the "Sexy" trade in 2026.
1️⃣ THE MACRO THESIS:
The "Physical" Crunch 🏗️ Forget the "Inflation Hedge" narrative for a second. Look at the Supply/Demand mechanics.
The Reality: The world is building AI Data Centers and Green Grids at a record pace. These don't run on Gold. They run on Copper .
The Crunch: We are staring down a forecasted refined copper deficit for 2025/2026.
The Trade: Economics 101 says when Demand > Supply, price must adjust.
2️⃣ THE TECHNICAL "COILED SPRING" ( AMEX:DBB )
📈 While Silver was running vertical, Invesco DB Base Metals ( AMEX:DBB ) was doing something much more powerful: Compressing.
Looking at the Monthly Chart above:
The Structure: We just broke out of a massive 3-year consolidation wedge.
The Implication: Consolidation builds energy. The longer the base, the higher the space.
The "Blue Sky": Unlike the crowded Precious Metals trade, DBB has minimal overhead resistance until $27.30 (TP1).
3️⃣ THE PSYCHOLOGY: Retail vs. Pro 🧠
Retail: Buys AMEX:SLV because it went up yesterday. (Chasing Performance).
Pros: Buy AMEX:DBB because the structure says it will go up tomorrow. (Front-running the Rotation).
4️⃣ THE WATCHLIST 📋
AMEX:DBB : The pure basket (Copper, Zinc, Aluminum).
NYSE:FCX : The institutional favorite.
AMEX:COPX : The miner leverage play.
💡 THE VERDICT I’m letting the crowd fight over the Silver scraps at the top of the range. The Asymmetric Bet—where you risk $1 to potentially make $5—is in the Industrial Rotation.
⚠️ RISK CHECK: Commodities are volatile. If a global recession hits, industrial demand vanishes, and this thesis breaks. This is NOT a "Buy Now" signal. It is a "Wake Up" call. Manage your risk.
👇 YOUR MOVE: Are you chasing the shiny stuff, or positioning for the industrial crunch? Let's discuss below.
🔥 Follow me for more institutional-grade setups.
Disclaimer: This analysis is for educational purposes only. Trading involves significant risk. Do your own due diligence.

GOLD (xauusd): towards $5000?Hi!
Gold remains in a strong bullish structure, having formed a clear impulsive leg from late August, followed by a healthy corrective phase. The correction held above the prior breakout zone, confirming this area as demand rather than distribution. Price is currently consolidating just below a key resistance band around 4,350–4,380, which acts as the decision zone for the next major move.
If price breaks above this resistance with strong momentum and acceptance, the bullish continuation scenario remains valid. In that case, the first upside target lies near 4,694, followed by an extended projection toward the 5,020 area based on the impulse leg expansion.
Alternatively, failure to break higher may result in a deeper correction. A strong bearish break below the corrective structure would open the door for a move toward the major demand zone around 3,576, where buyers previously entered aggressively.
RSI remains elevated but constructive, suggesting momentum is still supportive of a breakout rather than exhaustion.
Disclaimer: As part of ThinkMarkets’ Influencer Program, I am sponsored to share and publish their charts in my analysis.

XAUUSD Short: Rejected at Supply - Decline Toward 4,470 in FocusHello traders! Here’s a clear technical breakdown of XAUUSD (Gold, 3H) based on the current chart structure. Gold is trading within a well-defined bullish recovery after forming a clear pivot low on the left side of the chart. From that pivot point, price established a rising trend line, confirming that buyers have regained control and are steadily pushing the market higher.
Currently, price is trading between a major Supply Zone near 4,530 and a Demand Zone around 4,470. The recent pullback into the demand area appears corrective, not impulsive, suggesting profit-taking rather than a trend reversal. Buyers are defending this zone, which also aligns with prior breakout structure and short-term support.
My scenario: as long as Gold remains capped below the 4,530 Supply Zone, the risk of a bearish reaction stays elevated. Failure to break and hold above this resistance would confirm seller control at the highs and could trigger a corrective move lower. A clear rejection from the supply area may lead to a pullback toward the 4,470 Demand Zone as the first downside target. If price breaks below 4,470 with acceptance, it would signal a loss of bullish structure and open the door for a deeper correction toward lower support levels. A sustained hold below former demand would confirm a short-term bearish shift in momentum. For now, the focus is on price behavior at the supply zone, with rejection favoring a short scenario while resistance holds. Manage your risk!

HURRY Up I See Wonderful opportunity AwaitsYou Can see clearly the turtle Soup for Bearish in past
What we Show You The Upcoming opportunity
1st it will fill the empty Gray Box below as soon it offer into the
Green Box We Immediately looking for longs .

Gold Pullback Toward 4,420 as Dollar Weakness Persists!Hey Traders,
In today’s trading session, we are monitoring XAUUSD for a potential buying opportunity around the 4,420 zone.
From a technical perspective, Gold remains firmly within a broader uptrend and is currently undergoing a controlled corrective phase. Price is approaching the 4,420 area, a key confluence zone combining trend support with a former support/resistance level — an area where buyers have previously stepped in.
On the fundamental side, the backdrop continues to favor Gold. The Federal Reserve’s December rate cut has reinforced downside pressure on the US Dollar, while incoming data keeps the door open for another potential rate cut at the January FOMC, further weighing on USD expectations. This persistent weak-dollar bias remains structurally supportive for Gold.
Additionally, concerns around Federal Reserve independence and rising political and geopolitical tensions are contributing to renewed safe-haven demand, providing an additional tailwind for the metal.
As long as price holds above the 4,420 region, the broader bullish structure remains intact, with pullbacks viewed as potential continuation opportunities rather than trend reversals.
Don't forget to boost the post and leave your opinion on the comment section.
Trade safe,
Joe

Gold (XAUUSD) H1 – Intraday Structure & Key LevelsGold is currently trading within a corrective phase after a strong bullish impulse, with price reacting below a weak high. The broader structure remains constructive, but short-term price action suggests two-sided risk.
Key observations
Recent CHOCH signals indicate a pause in momentum rather than a trend reversal.
Price rejected from the upper supply zone and is now reacting around the mid-range.
Liquidity remains stacked above the weak high, while demand sits below near the prior support block.
Key levels to watch
Resistance: 4,520–4,560 (weak high / supply)
Support: 4,400–4,420 (intraday demand)
Invalidation: Below 4,380 opens room toward deeper demand
Scenarios
Bullish continuation: Hold above support → reclaim 4,480–4,500 → liquidity run toward 4,520–4,560.
Bearish pullback: Failure to reclaim 4,480 → continuation lower into 4,400 demand before buyers step in.
Bias stays neutral-to-bullish while above key demand. Patience and confirmation around these levels will define the next high-probability move.
Follow to stay updated, and save this if it adds value.

Gold Slides as Investors Lock in Profits, Safe-Haven Demand FadeGOLD | Overview
Gold Falls as Investors Lock In Profits
Gold prices pulled back as investors locked in profits after a strong rally this year, with prices having traded around $2,670 in early January.
Additionally, signs of potential progress between U.S. President Donald Trump and Ukrainian President Volodymyr Zelensky on ending the conflict with Russia have reduced safe-haven demand, adding pressure to the metal in the short term.
Technically:
Gold maintains a bearish bias while trading below the pivot level at 4472.
As long as price remains below 4472, downside momentum is expected to continue toward 4459, with a deeper move likely toward 4420 if selling pressure strengthens.
A bullish recovery would require a 1H candle close above 4472, which would open the path toward 4500 and 4545.
Key Levels
Pivot Line: 4472
Support: 4459 · 4438 · 4420
Resistance: 4490 · 4500 · 4545
Outlook:
Gold remains bearish below 4472, targeting 4459–4420.
A confirmed 1H close above 4472 would shift momentum to bullish, aiming for 4500–4545.

WTI Energy Markets: Are Buyers Still in Control?🛢️ WTI / USOIL — Bullish Energy Momentum Play
Energies • Commodities CFD • Day / Swing Trade
📌 Market Bias
🟢 Bullish Plan Active
WTI crude oil is trading with strong upside momentum, supported by trend structure and energy-sector flows. Buyers continue to defend dips while price respects bullish continuation behavior.
🎯 Trade Plan
Entry:
✅ Flexible entry allowed — you may enter at any price level, depending on your execution model and risk profile.
Stop Loss:
⛔ Reference SL: 56.000
⚠️ Risk disclaimer: Adjust your stop-loss based on your strategy, position sizing, and account risk rules.
Take Profit Zone:
🚨 Primary Objective: 60.000
📉 The moving average zone acts as a “police force” resistance — expect:
Overbought conditions
Liquidity traps
Potential corrective reactions
💡 Protect profits aggressively near resistance.
🧠 Technical Logic (Why This Works)
✔️ Bullish trend structure intact
✔️ Higher-low defense suggests dip buyers are active
✔️ Moving average acting as dynamic resistance → profit-booking zone
✔️ Momentum favors continuation until supply absorbs demand
🔗 Related Markets to Watch (Correlation Guide)
💵 USD-Based Pairs
DXY (U.S. Dollar Index) → Inverse correlation
📉 Weaker USD often supports higher oil prices.
USD/CAD → Strong negative correlation
🛢️ Rising oil typically strengthens CAD.
🛢️ Energy Instruments
BRENT Crude → Directional confirmation
XLE (Energy Sector ETF) → Institutional energy flow tracker
Natural Gas (XNG/USD) → Sentiment cross-check (not direct correlation)
📈 Risk Sentiment
US30 / S&P500 → Risk-on flows support commodity demand
Bond Yields → Rising yields can cap aggressive oil rallies
🌍 Fundamental & Economic Factors to Monitor
📊 (Current & upcoming macro drivers)
🛢️ OPEC+ supply guidance (production discipline impacts price stability)
🏭 U.S. crude inventory data (supply-demand imbalance signals)
🌍 Global growth outlook (energy consumption expectations)
🚢 Geopolitical supply risks (shipping routes & production regions)
💵 U.S. Dollar strength (pricing pressure on commodities)
🏦 Central bank policy tone (risk appetite & inflation hedging)
📌 These factors can accelerate or cap bullish momentum, especially near resistance zones.
⚠️ Risk Note
This idea provides market structure and directional context only.
You control:
Position size
Risk exposure
Entry & exit execution
Trade responsibly and manage capital professionally.
💬 If this setup adds value, hit 👍 and ⭐ to support quality analysis.
📌 Follow for more structured energy & macro-driven trade ideas.
