Gold (XAUUSD): 15m timeframe idea, sell setupGold (XAUUSD): 15m timeframe idea, sell setup. I still believe in this trade, even more with the current pattern.
Cheers
Commodities

Gold (XAUUSD): Sell setupGold (XAUUSD): Sell setup. Still I am bearish on Gold. My last analysis was good, but I did not consider an inside liquidity.

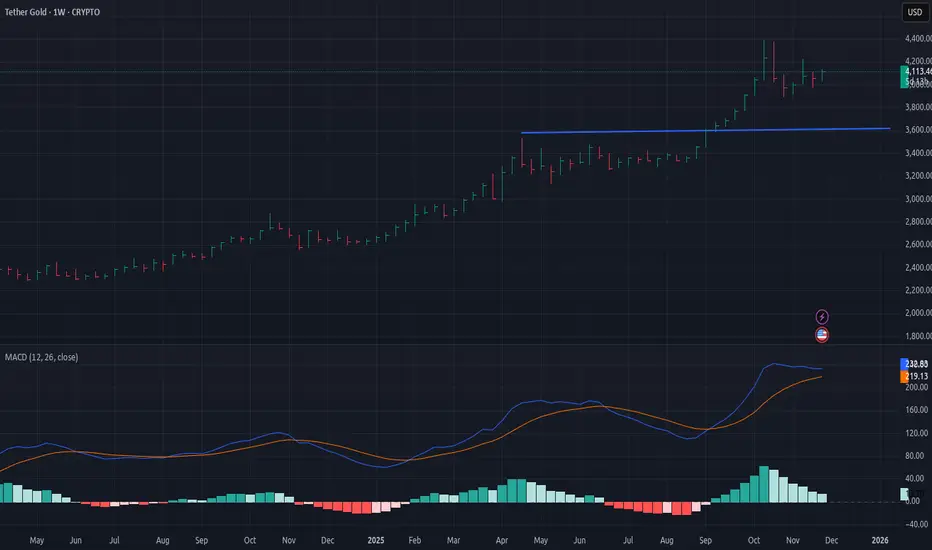
XAUT (GOLD) long-term TAFolks, those who are waiting for the gold to run higher again, please be patient. The uptrend for the GOLD remains very strong, but mid-term has been in distribution for the last couple of weeks, the blue line shows weekly support if there's a correction to proceed deeper, but current daily support at $3900ish area is keeping fine, if that level is broken it may touch the blue line.
In general, GOLD remains very strong in long-term run.
XAUUSD PPI PLAN: 1000PIPS SELL ZONE IS READY 📈 XAU/USD TRADING PLAN (4H) - SMC LOGIC
Date: November 25, 2025 (Based on chart data) Pair: Gold Spot / U.S. Dollar (XAU/USD) Timeframe: 4 Hour (H4)
1. Market Structure Analysis
Overall Bias: Bullish (Uptrend) is maintained as the market structure recently made a higher low (HL) around $4020 and is currently pushing towards the previous high ($4212.741).
Key Liquidity (Indicated as $$$): Liquidity rests below the recent swing lows, suggesting these areas ($4020, $3980) are potential targets for a Liquidity Sweep before a major continuation move.
2. Supply & Demand Zones (Order Blocks)
Primary Supply/Sell Zone (Order Block): $4188 - $4190
Interpretation: This is the institutional Order Block (OB) or area of significant rejection prior to the sharp drop from the swing high. It is a high-probability reversal area.
Immediate Demand/Buy Zone 1 (FVG Mitigation): $4090 - $4088
Interpretation: This is the Demand Zone resting right below the Fair Value Gap (FVG). Price is expected to return to this area to mitigate the imbalance before continuing the uptrend.
Extreme Demand/Buy Zone 2 (Structural Support OB): $4022 - $4020
Interpretation: This is the most critical Order Block for the current bullish structure. A bounce here would confirm the continuation of the H4 uptrend.
3. Execution Plan
A. SELL SCENARIO (Counter-Trend/Correction)
Entry Zone: SELL GOLD $4188 - $4190 (Limit Order)
Stop Loss (SL): $4192 (Tight SL above the Supply Zone)
Take Profit Targets (TP):
TP 1 (Immediate): $4140 - $4150 (Top of FVG)
TP 2 (Primary): $4090 (Demand Zone 1)
TP 3 (Extreme): $4022 (Demand Zone 2)
B. BUY SCENARIO 1 (FVG Mitigation & Continuation)
Entry Zone: BUY GOLD $4090 - $4088 (Limit Order)
Stop Loss (SL): $4085 (Below the Demand Zone 1 OB)
Take Profit Targets (TP):
TP 1 (Immediate): $4132 (Current Swing High)
TP 2 (Primary): $4188 (Previous Supply Zone)
TP 3 (Continuation): Break of $4212.741 (Break of Structure - BOS)
C. BUY SCENARIO 2 (Extreme Demand/Structural Hold)
Entry Zone: BUY GOLD $4022 - $4020 (Limit Order)
Stop Loss (SL): $4017 (Below the Extreme Demand OB)
Take Profit Targets (TP):
TP 1: $4090 (Demand Zone 1)
TP 2: $4188 (Supply Zone)
TP 3: Break of $4212.741 (BOS)
4. Confirmation (Important)
Always look for a Change of Character (CHoCH) or Break of Structure (BOS) on a lower timeframe (e.g., H1 or M15) upon arrival at the Entry Zones ($4188, $4090, $4020) to validate the institutional order flow shift before execution.

How to build Discipline & Structured Trading HabitsDiscipline is not something you rely on in the moment; it is something you build through habits that remove emotional decision-making from your trading process.
1. Define Rules Before You Trade
Traders without predefined rules rely on emotion. Traders with rules rely on structure.
Clearly define your entry criteria, risk per trade, maximum daily loss, and exit strategy.
When these rules exist before the session starts, you eliminate most impulsive behaviors.
2. Limit Your Daily Decisions
Every decision drains mental energy. The more choices you make, the weaker your discipline becomes.
Reduce the number of markets you watch, the number of setups you take, and the amount of chart time you expose yourself to.
Fewer decisions lead to higher-quality decisions.
3. Use a Pre-Session Checklist
A checklist forces you into a disciplined routine. It can include:
• Reviewing your trading plan
• Checking upcoming news releases
• Confirming your bias or market conditions
• Ensuring your risk settings are correct
The act of going through the checklist prepares your mind to follow structure.
4. Implement a Hard Stop for the Day
One of the fastest ways to lose discipline is to trade while emotional.
Set a maximum daily drawdown. Once it is hit, the session ends. No exceptions.
This protects both your capital and your psychology.
5. Track Your Rule Breaks
Most traders only track wins and losses. Disciplined traders also track deviations.
Write down every time you break a rule, why it happened, and how you plan to prevent it next time.
Over time, this builds awareness and accountability.
6. Delay Impulsive Actions
If you feel the urge to jump into a trade that does not fit your plan, delay the action by 30 to 60 seconds.
Impulses lose power quickly. By introducing a pause, you give your rational mind time to regain control.
7. Keep Your Environment Clean
Distractions destroy discipline.
Silence notifications, close irrelevant tabs, and avoid multitasking.
A clean trading environment supports clean decisions.
8. End Each Session With a Routine
A consistent end-of-day routine reinforces discipline. Examples:
• Rating your discipline on a scale from 1 to 10
• Reviewing whether you followed your rules
• Logging emotional triggers
Ending the day with structure makes it easier to begin the next one with structure.
Conclusion
Discipline is not built through motivation but through habits that create consistent behavior. A structured trading routine removes uncertainty, minimizes emotional influence, and helps you operate like a professional rather than a reactive participant.
Crude Ready For New Strong Leg UpCrude oil is recovering for the last few weeks, after new sanctions against Russia, with price rebounding from 56 sharply and impulsively. This suggests an important new swing low is in place, and we should now be aware of more upside ahead, with a minimum three-wave recovery that could take us toward 66.60 or even higher, after that wave b/ii setback which is now coming to an end at 58-59 support area.
Even HS bullish pattern is calling for more upside.
GH

GOLD: Bearish Continuation & Short Trade
GOLD
- Classic bearish formation
- Our team expects fall
SUGGESTED TRADE:
Swing Trade
Sell GOLD
Entry Level - 4130.2
Sl - 4144.7
Tp - 4106.1
Our Risk - 1%
Start protection of your profits from lower levels
Disclosure: I am part of Trade Nation's Influencer program and receive a monthly fee for using their TradingView charts in my analysis.
❤️ Please, support our work with like & comment! ❤️

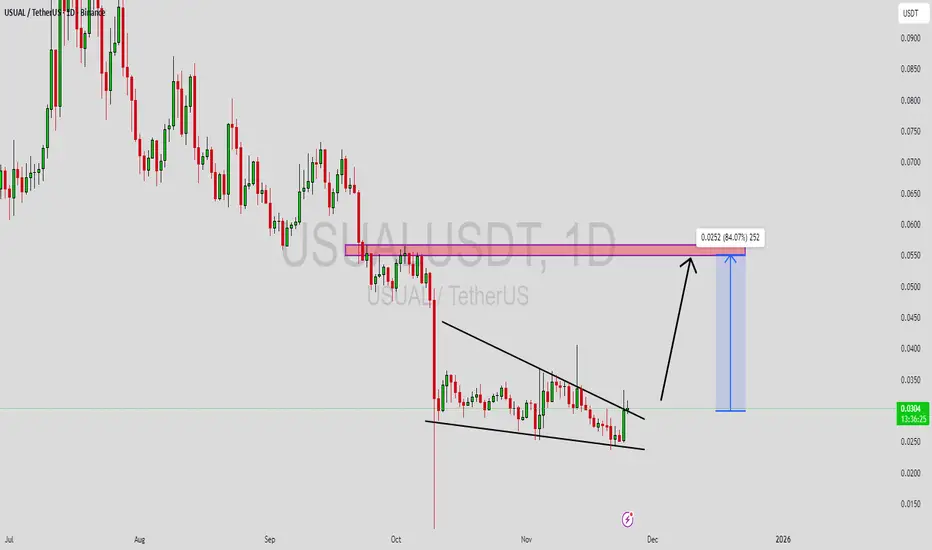
USUALUSDT ReadyUSUALUSDT is forming a clear falling wedge pattern, a classic bullish reversal signal that often indicates an upcoming breakout. The price has been consolidating within a narrowing range, suggesting that selling pressure is weakening while buyers are beginning to regain control. With consistent volume confirming accumulation at lower levels, the setup hints at a potential bullish breakout soon. The projected move could lead to an impressive gain of around 40% to 50% once the price breaks above the wedge resistance.
This falling wedge pattern is typically seen at the end of downtrends or corrective phases, and it represents a potential shift in market sentiment from bearish to bullish. Traders closely watching USUALUSDT are noting the strengthening momentum as it nears a breakout zone. The good trading volume adds confidence to this pattern, showing that market participants are positioning early in anticipation of a reversal.
Investors’ growing interest in USUALUSDT reflects rising confidence in the project’s long-term fundamentals and current technical strength. If the breakout confirms with sustained volume, this could mark the start of a fresh bullish leg. Traders might find this a valuable setup for medium-term gains, especially as the wedge pattern completes and buying momentum accelerates.
✅ Show your support by hitting the like button and
✅ Leaving a comment below! (What is your opinion about this Coin?)
Your feedback and engagement keep me inspired to share more insightful market analysis with you!
AUD/USD 2-hour chart Pattern.....AUD/USD 2-hour chart open, with trend lines, Ichimoku cloud, and two “Target Point” markers drawn. From what’s visible:
1. First Target: Around 0.6518 (marked on the chart as the lower target line).
2. Second Target: Around 0.6575 (the higher target line).
These targets appear to be based on a breakout from the descending trendline, with projected upward moves indicated by the vertical arrows.

XAUUSD Ascending Channel Strengthens: Bulls Target $4,130 TP1Hello traders! I want to share my view on the current XAUUSD setup. After a deep corrective move, gold has formed a local bottom around the Support Level at $4,000–$4,030, where strong buying pressure has re-entered the market. As shown on the chart, price is gradually climbing within a well-defined ascending channel, supported by the rising trendline and a parallel upper boundary. Inside this structure, the Buyer Zone has played a crucial role, providing the base for previous impulsive breakouts. Several fake breakdowns below the channel support confirmed the presence of significant demand. After these rebounds, XAUUSD twice reached the Seller Zone and the Resistance Level near $4,130, where it faced clear rejection and rotated back toward the Buyer Zone. Currently, gold is holding above the ascending channel support. If buyers continue to defend the $4,030 level and price remains stable within the Buyer Zone, I expect a move toward TP1 → $4,130, which is the nearest resistance. A clean breakout above this level would open the door for further bullish continuation toward the upper supply area around $4,200–$4,230. However, if the price breaks below the Buyer Zone and drops out of the channel, the bullish scenario becomes invalid, and the market may revisit the $4,000 support area. For now, the structure remains moderately bullish as long as price holds above demand and stays inside the ascending channel. Please share this idea with your friends and click Boost 🚀

DeGRAM | GOLD is preparing to rebound from the $4k level📊 Technical Analysis
● XAU/USD is holding above the 4,040–4,060 support zone, aligning with the rising trendline that has produced multiple higher lows, indicating sustained buyer defense.
● Price is compressing beneath the descending resistance line; a breakout toward 4,138 and then 4,211 becomes likely once structure lifts above 4,097.
💡 Fundamental Analysis
● Gold is supported by cooling U.S. yields and steady safe-haven demand as global risk sentiment remains fragile.
✨ Summary
Support: 4,040–4,060. Targets: 4,138 → 4,211. Bias remains bullish above rising support.
-------------------
Share your opinion in the comments and support the idea with a like. Thanks for your support!

Gold remains bullish.Gold maintained its bullish structure, closing significantly higher on the daily chart. The New York closing price once again rose above the 10-day moving average (MA10) at 4105, with the 5-day and 7-day moving averages forming a golden cross and trending upwards. The RSI indicator is above the midline. On the shorter-term 4-hour and hourly charts, the Bollinger Bands are widening upwards, with the price maintaining its position in the upper half of the bands, and the moving average system showing an upward crossover. The trading strategy for gold remains unchanged from yesterday: prioritize buying on pullbacks to support levels, and only consider selling at higher levels.
At the Asian open today, gold experienced a rebound, reaching a high of 4144 before retracing. Currently, gold is still in a consolidating upward trend, and our overall bullish outlook remains unchanged. Gold is still developing within a narrowing triangle pattern on the daily chart, with the key level around $4150. A break above this level would open up further upside potential.
Key Levels:
First Support: 4108, Second Support: 4092, Third Support: 4074
First Resistance: 4150, Second Resistance: 4167, Third Resistance: 4183
Gold Intraday Trading Strategy:
BUY: 4085-4090, SL: 4070, TP: 4110-4120;
SELL: 4170-4175, SL: 4190, TP: 4150-4140;
More Analysis →

GOLD Will Move Lower! Short!
Take a look at our analysis for GOLD.
Time Frame: 9h
Current Trend: Bearish
Sentiment: Overbought (based on 7-period RSI)
Forecast: Bearish
The price is testing a key resistance 4,126.79.
Taking into consideration the current market trend & overbought RSI, chances will be high to see a bearish movement to the downside at least to 4,038.14 level.
P.S
Please, note that an oversold/overbought condition can last for a long time, and therefore being oversold/overbought doesn't mean a price rally will come soon, or at all.
Like and subscribe and comment my ideas if you enjoy them!

USOIL Is Very Bearish! Sell!
Please, check our technical outlook for USOIL.
Time Frame: 15m
Current Trend: Bearish
Sentiment: Overbought (based on 7-period RSI)
Forecast: Bearish
The market is approaching a significant resistance area 57.983.
Due to the fact that we see a positive bearish reaction from the underlined area, I strongly believe that sellers will manage to push the price all the way down to 57.471 level.
P.S
We determine oversold/overbought condition with RSI indicator.
When it drops below 30 - the market is considered to be oversold.
When it bounces above 70 - the market is considered to be overbought.
Like and subscribe and comment my ideas if you enjoy them!

Gold: Bounce or Breakdown? Support Says BounceAs I expected in the previous idea , Gold touched the First Target($4,049) but failed to break the support zone($4,053 – $4,025).
In terms of Elliott Wave theory, given that Gold failed to break the support zone($4,053 – $4,025), we can expect bullish waves, at least in the short term.
---------------------------------------------
Minutes ago, the U.S. labor market indicators were released — including NFP, Average Hourly Earnings, and the Unemployment Rate.
Here are the actual numbers:
NFP: 119K (vs. 53K expected) — much stronger
Hourly Earnings m/m: 0.2% (vs. 0.3% expected) — weaker
Unemployment Rate: 4.4% (vs. 4.3% expected) — higher
Gold’s Fundamental Reaction:
Today’s data is mixed in a very interesting way:
Stronger NFP = USD bullish pressure
A print of 119K signals a stronger labor market rebound, which normally puts downside pressure on gold.
But weaker wage growth (0.2%) = lower inflation pressure
This reduces the urgency for further Fed tightening, which is gold-positive.
Higher unemployment (4.4%) = economic cooling signal
This supports the idea that the economy is slowing beneath the surface — also positive for gold.
Net Result:
Gold is likely to experience initial volatility, but the combination of weaker wage inflation + higher unemployment offsets the strong NFP.
This means gold could find support after the first drop, especially if markets focus on softer inflation expectations and rising unemployment.
---------------------------------------------
I expect Gold to rise to at least $4,137 based on the above explanation.
It is also possible that Gold will form an ascending channel. One of the upside targets for gold could be near the upper line of the ascending channel(possible).
First Target: $4,137
Second Target: $4,174
Stop Loss(SL): $4,017
Points may shift as the market evolves
💡 Please respect each other's opinions and express agreement or disagreement politely.
📌 Gold Analyze (XAUUSD), 1-hour time frame.
🛑 Always set a Stop Loss(SL) for every position you open.
✅ This is just my idea; I’d love to see your thoughts too!
🔥 If you find it helpful, please BOOST this post and share it with your friends.

XAU/USD Intraday Plan | Gold Breaks Out — Can Buyers Hold?Gold broke out of the consolidation range yesterday, finally pushing above the 4098 level and extending into the 4142 resistance zone.
Price is now sitting above both the MA50 and MA200 — a constructive sign — but both moving averages remain flat, showing that momentum has not fully shifted yet.
If buyers want to build on this breakout, they need a clean hold above 4142. A confirmed break here would open the path toward 4198 → 4232.
If gold fails to clear 4142, we could see a pullback. First support sits at 4098, followed by 4052.
A deeper correction would bring us back into the Support Zone (4016–3968), with the HTF Support Zone (3921–3862) acting as the major safety net.
📌Key levels to watch:
Resistance:
4142
4198
4232
Support:
4098
4052
4016
3968
3921
3862
📰 Fundamental Focus:
Today brings the first batch of high-impact U.S. data for the week, including Core PPI, PPI, and Retail Sales — all key indicators of inflation and consumer strength. Traders should be prepared for sharper moves as the market reacts to inflation and consumer-spending data.

GOLD → Neutral price channel... Waiting for news FX:XAUUSD is testing the lower boundary of the 4060 channel and rebounding, maintaining moderate fluctuations in anticipation of key US data. Focus on 4040 - 4100...
The probability of a Fed rate cut in December has risen to 74% following comments by J. Williams
The unusual situation surrounding the Russia-Ukraine conflict means that any hints of de-escalation could trigger a correction in the metal...
The trading week will be relatively short, as Thursday and Friday are public holidays in the US, and the market may see reduced volatility.
Focus on the following news:
- PPI (forecast +0.3%) and US retail sales
- Q3 GDP and PCE index (inflation)
Gold remains sensitive to Fed comments and geopolitics. Strong data could lower expectations for policy easing. A breakout is likely after the release of inflation data and GDP. Rising odds of a rate cut in December limit downside potential.
Resistance levels: 4100, 4111
Support levels: 4040, 4024
Gold is being held within its current trading range. The last four trading sessions indicate uncertainty about the future direction. In this case, it is worth considering trading within the current boundaries first. I expect a retest of resistance and a subsequent downward rebound.
Best regards, R. Linda!

USDCAD outcome.USDCAD is near RESISTANCE and waiting for confirmation for reversal going into London session.

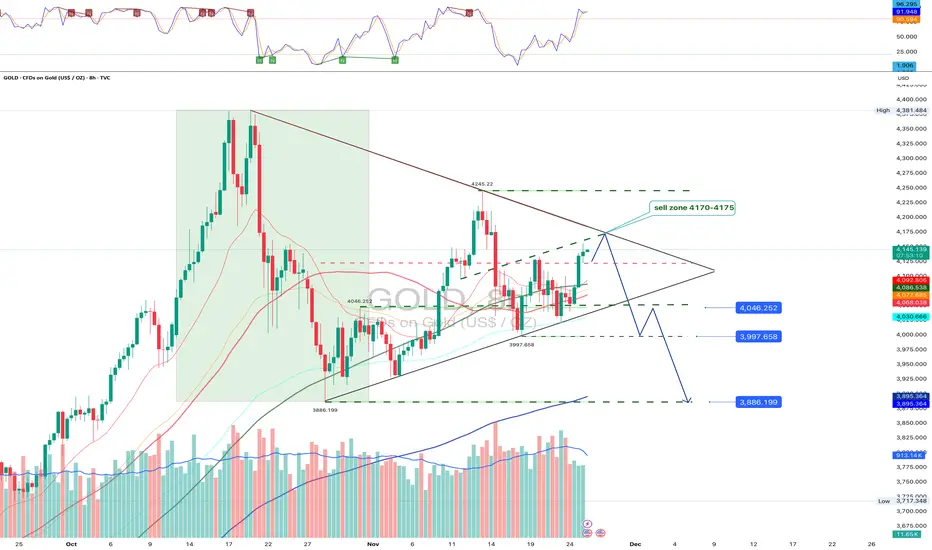
GOLD approaches a critical inflection inside the triangleGold is compressing inside a large triangle on the four hour chart and has returned to the twenty four hundred seventy area which acts as the main sell zone at four thousand one hundred seventy to four thousand one hundred seventy five. The market still fails to break above this region and preserves a sequence of lower highs. A breakdown through the triangle support may open the path toward four thousand forty six three thousand nine hundred ninety seven and three thousand eight hundred eighty six where strong liquidity and the two hundred period moving average converge.
The fundamental picture as of November twenty fifth remains mixed. United States inflation is cooling more slowly than expected which keeps treasury yields elevated and limits the attractiveness of gold as a defensive asset. Market expectations for a Federal Reserve rate cut in the first half of next year persist which supports the metal during pullbacks. Demand from Asian jewelry markets stays muted which adds pressure when yields rise.
Price is approaching a decision point. A rejection from the sell zone may send the market toward four thousand forty six three thousand nine hundred ninety seven and three thousand eight hundred eighty six. A confirmed move above four thousand one hundred seventy five will invalidate the bearish scenario and allow a possible breakout to the upside although the market still looks weaker than the seller for now.
Gold is precious without doubt but inside a triangle nothing shines too confidently until the market shows its choice.
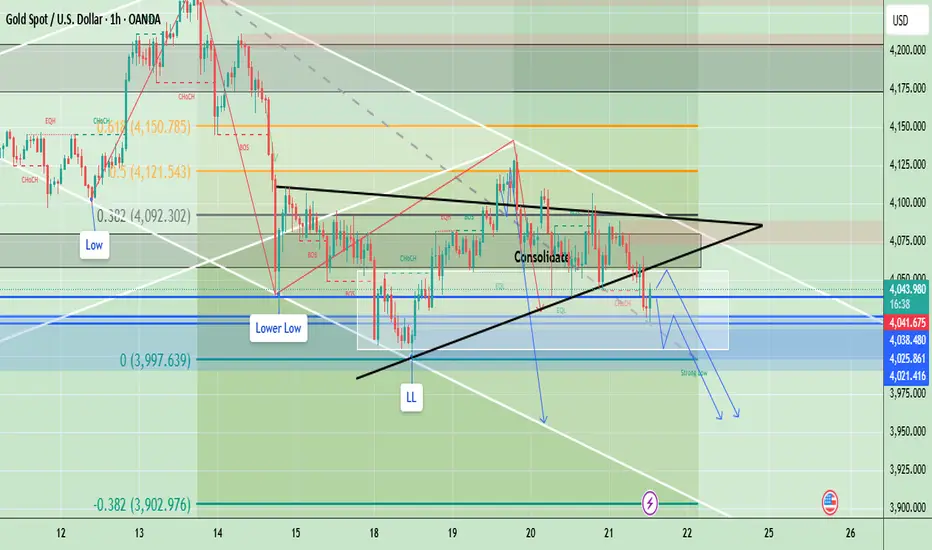
Gold Bearish Structure Continues – Sell Levels UpdatedGold remains bearish after rejecting from the upper consolidation boundary and continuing its pattern of lower highs and lower lows. Price has now broken below the triangle-consolidation zone and is retesting the lower boundary around 4038-45 which aligns with previous liquidity. As long as price stays below the triangle resistance and fails to reclaim 4080 momentum favors further downside. The next bearish targets lie below the Strong Low zone aiming toward deeper liquidity and Fibonacci extensions.
✅ Bias: Sell below 4080
- Sell Zone: 4045 - 4055 (Retest of broken consolidation + minor supply)
- Stop Loss: 4082 (Above triangle resistance + structure break)
- Take Profit: 4025 - 4008 - 3988
- Invalidate: 4082 (Above triangle resistance + structure break)
Note
Please risk management in trading is a Key so use your money accordingly. If you like the idea then please like and boost. Thank you and Good Luck!
Hellena | GOLD (4H): LONG to resistance area of 4382(Wave 3).In the past forecast, many have rightly pointed out that wave “4” went behind the high of wave “2” and yet we are not dealing with a diagonal.
This means that the waves have stretched and have a larger range of motion and now the correction in wave “2” is ending.
Essentially the upward movement is still prioritized and I expect two scenarios:
1) Continuation of the upward movement to the resistance area of 4382 (market entry)
2) Reaching the support area 3994.4, after which the correction can be considered complete and only then the movement to the area 4382 will start.
Manage your capital correctly and competently! Only enter trades based on reliable patterns!

Stop!Loss|Market View: EURUSD🙌 Stop!Loss team welcomes you❗️
In this post, we're going to talk about the near-term outlook for the EURUSD currency pair☝️
Potential trade setup:
🔔Entry level: 1.14869
💰TP: 1.14036
⛔️SL: 1.15401
"Market View" - a brief analysis of trading instruments, covering the most important aspects of the FOREX market.
👇 In the comments 👇 you can type the trading instrument you'd like to analyze, and we'll talk about it in our next posts.
💬 Description: The US dollar continues to strengthen, and its upside potential is likely yet to be realized in the medium term. Against this backdrop, selling pressure on the euro remains high, and the 1.14000 target remains a seller's focus. The current accumulation just below 1.15500 offers a potential opportunity to consider short-term selling through a breakout of the lower boundary.
Thanks for your support 🚀
Profits for all ✅

Bearish reversal off 61.8% FIbonacci resistance?Gold (XAU/USD) is reacting off the pivot, which is a pullback support that aligns with the 61.8% Fibonacci retracement and could reverse to the 1st support.
Pivot: 4,147.61
1st Support: 4,093.63
1st Resistance: 4,219.46
Disclaimer:
The opinions given above constitute general market commentary and do not constitute the opinion or advice of IC Markets or any form of personal or investment advice.
Any opinions, news, research, analyses, prices, other information, or links to third-party sites contained on this website are provided on an "as-is" basis, are intended to be informative only, and are not advice, a recommendation, research, a record of our trading prices, an offer of, or solicitation for, a transaction in any financial instrument and thus should not be treated as such. The information provided does not involve any specific investment objectives, financial situation, or needs of any specific person who may receive it. Please be aware that past performance is not a reliable indicator of future performance and/or results. Past performance or forward-looking scenarios based upon the reasonable beliefs of the third-party provider are not a guarantee of future performance. Actual results may differ materially from those anticipated in forward-looking or past performance statements. IC Markets makes no representation or warranty and assumes no liability as to the accuracy or completeness of the information provided, nor any loss arising from any investment based on a recommendation, forecast, or any information supplied by any third party.
