Bearish reversal off 61.8% FIbonacci resistance?Gold (XAU/USD) is reacting off the pivot, which is a pullback support that aligns with the 61.8% Fibonacci retracement and could reverse to the 1st support.
Pivot: 4,147.61
1st Support: 4,093.63
1st Resistance: 4,219.46
Disclaimer:
The opinions given above constitute general market commentary and do not constitute the opinion or advice of IC Markets or any form of personal or investment advice.
Any opinions, news, research, analyses, prices, other information, or links to third-party sites contained on this website are provided on an "as-is" basis, are intended to be informative only, and are not advice, a recommendation, research, a record of our trading prices, an offer of, or solicitation for, a transaction in any financial instrument and thus should not be treated as such. The information provided does not involve any specific investment objectives, financial situation, or needs of any specific person who may receive it. Please be aware that past performance is not a reliable indicator of future performance and/or results. Past performance or forward-looking scenarios based upon the reasonable beliefs of the third-party provider are not a guarantee of future performance. Actual results may differ materially from those anticipated in forward-looking or past performance statements. IC Markets makes no representation or warranty and assumes no liability as to the accuracy or completeness of the information provided, nor any loss arising from any investment based on a recommendation, forecast, or any information supplied by any third party.
Commodity

USOIL H4 | Bearish Drop OffMomentum: Bearish
The price is currently moving along a descending trendline and remains below the Ichimoku Cloud, indicating continued downside pressure.
Sell entry: 60.35
Pullback resitance
Stop loss: 61.42
Pullback resistance
Take profit: 58.21
High Risk Investment Warning
Stratos Markets Limited (tradu.com ), Stratos Europe Ltd (tradu.com ):
CFDs are complex instruments and come with a high risk of losing money rapidly due to leverage. 70% of retail investor accounts lose money when trading CFDs with this provider. You should consider whether you understand how CFDs work and whether you can afford to take the high risk of losing your money.
Stratos Global LLC (tradu.com ): Losses can exceed deposits.
Please be advised that the information presented on TradingView is provided to Tradu (‘Company’, ‘we’) by a third-party provider (‘TFA Global Pte Ltd’). Please be reminded that you are solely responsible for the trading decisions on your account. Any information and/or content is intended entirely for research, educational and informational purposes only and does not constitute investment or consultation advice or investment strategy. The information is not tailored to the investment needs of any specific person and therefore does not involve a consideration of any of the investment objectives, financial situation or needs of any viewer that may receive it. Past performance is not a reliable indicator of future results. Actual results may differ materially from those anticipated in forward-looking or past performance statements. We assume no liability as to the accuracy or completeness of any of the information and/or content provided herein and the Company cannot be held responsible for any omission, mistake nor for any loss or damage including without limitation to any loss of profit which may arise from reliance on any information supplied by TFA Global Pte Ltd.

Gold Market Moving Exactly As MappedVANTAGE:XAUUSD tapped perfectly into my OG Demand Zone around
4,020–4,050 and buyers stepped in exactly where the system expected. The bounce carried straight into my upper OG Supply Zone, and today’s wick shows clear hesitation right on the zone border.
The structure is still holding a bullish tone as long as price stays above the OG Trend Zone support at 4,050–4,100.
My X-pattern intersection also acted as a confluence pivot, guiding the move into the current rejection point.
Short-term 🐼 I am watching for a sweep of the supply zone highs and a cleaner reaction.
Mid-term I still prefer long setups only after a pullback into my green demand zone where momentum can reload.
Both OG Zones and OG Trend Zones played this move with precision. The system mapped the bounce, mapped the continuation, and is now catching the rejection area.
📊 Current bias: Neutral to bearish inside supply
🟢 Long interest: Rebuilds on a dip back into demand
🔴 Short interest: Only if supply shows clean rejection
📆 Watching daily close for confirmation

The Dual Catalyst: Why Silver's \$50 Breakout is SustainableSilver (XAG/USD) recently broke the crucial $50 per ounce level, signaling a fundamental shift in its market dynamics. While the price edges lower in the short term, primarily due to a strengthened US Dollar (USD), its long-term trajectory is decisively bullish. This surge is not merely speculative. It is driven by an unprecedented convergence of geopolitical risks, critical industrial demand, and shifting macroeconomic policy. Analyzing these catalysts across multiple domains confirms silver's evolving role from a precious metal to a critical industrial asset.
Macroeconomics and Geopolitics
Silver's price strength reflects global systemic risk and monetary policy uncertainty. Current market expectations strongly favor a Federal Reserve (Fed) rate cut by December, with a nearly 68% probability priced in by the CME FedWatch Tool. Lower interest rates reduce the opportunity cost of holding non-yielding silver, making it relatively more attractive than bonds or cash. This dovish outlook provides a powerful structural floor for the price.
From a geopolitical perspective, ongoing global tensions and elevated political risks, like recent US government funding debates, accelerate safe-haven demand. Investors seek hard assets to hedge systemic risks. While gold often leads as the primary safe haven, silver's lower cost and dual-use nature attract broader retail and institutional flows, pushing it higher. A strong, sustained rally will require the price to hold above $50 and overcome the next major resistance near the historical high of $54.50.
Technology, Science, and Patents
Industrial demand now constitutes over 50% of silver’s total annual consumption, fundamentally redefining its market. Its unmatched electrical and thermal conductivity makes it indispensable in high-growth sectors.
* Renewable Energy: Silver is critical for photovoltaics (PV), specifically in solar cells, which form the conductive paste that harvests electrons. The global push for green energy and solar capacity expansion creates structural, persistent demand that consistently tightens the market.
* High-Tech and EVs: Electric Vehicles ( EVs) require significantly more silver (25–50 grams per unit) than traditional vehicles for inverters, battery management systems, and high-voltage contacts. The expansion of 5G technology, advanced computing, and the Internet of Things (IoT) further relies on silver-based components for seamless connectivity and efficiency.
Geostrategy and Supply Chain Risk
Silver is now recognized as a critical mineral by several major economies. This reclassification acknowledges its essential role in national security, advanced manufacturing, and the energy transition. This status highlights a geopolitical vulnerability: silver's supply chain is increasingly seen as a strategic concern.
The market currently runs a persistent supply deficit, depleting above-ground stockpiles to critically low levels. Mining silver often occurs as a byproduct of copper, lead, and zinc, meaning its supply cannot easily scale up based on price alone. Trade conflicts or export controls imposed by major producing nations could severely disrupt supply, immediately spiking the price due to its non-substitutable role in key high-tech applications.
Cyber and Economics: The Future Nexus
Silver’s unique properties extend into emerging fields like cybersecurity* and advanced computing. Research integrates silver nanoparticles and quantum materials into sophisticated systems. These materials enhance data processing efficiency and bolster the security of financial supply chains. Furthermore, flexible electronics using silver nanowires* will drive the next generation of wearable and flexible displays, creating entirely new demand vectors.
The long-term economic case for a $100 silver price remains dependent on this confluence of factors. Sustained high industrial consumption, a breakdown in global supply chains, and a continued environment of monetary debasement must align. Silver has truly become a dual-catalyst metal, positioned to thrive as both a financial safe haven and a fundamental building block of the twenty-first-century green and digital economy.

GOLD Bounce Incoming?VANTAGE:XAUUSD short-term technicals make it possible. Here’s why:
The downside move already stretched with three impulsive bearish candles, showing an overextended drop.
Price is now sitting right around the trendline + falling channel confluence, which often acts as a reaction zone.
Below, those green FVG/demand blocks remain unfilled meaning the market could grab liquidity from above before revisiting the lower zones.
⚡️A short-term relief bounce can play out first, but the main structure is still bearish unless the market reclaims the upper FVG area with strength.
Price reacting inside the accumulation zone after double CHoCH and unfilled FVG below.
If bulls hold 3,945–3,955, a bounce toward 3,990 → 4,020 remains valid.
Volume shifting blue = early demand confirmation.
Above 4,000 → distribution area may trigger short-term profit-taking.
A close below 3,930 invalidates the setup.
Macro side: Fed’s hawkish tone & rising yields may cap upside,
but weaker USD or risk-off sentiment could fuel the bounce. ⚡️
📊 Daily Outlook (1D)
The long-term trend is still bullish, but after the rejection from 4,300, price is consolidating near the key demand zone around 3,920.
If this level holds, a short-term rebound toward 4,080–4,250 is possible.
However, a daily close below 3,915 could extend the correction down toward 3,820–3,750.
⏱ 1-Hour Outlook (1H)
The medium-term bias remains bearish as price trades below both EMAs.
The 4,000–4,120 region acts as a major distribution/supply zone,
while 3,935–3,950 serves as a short-term accumulation/demand area.
At the moment, gold is ranging between these two liquidity clusters a neutral zone where volatility can expand either way.
💡 15-Minute Outlook (M15)
Price shows a minor recovery move from the lower demand zone.
Liquidity above 3,995–4,015 is the next key target zone.
As long as price holds above 3,940, upside targets sit around 4,015–4,040.
But a new rejection near 4,000 could trigger a retest of the lower accumulation area.
🧭 Overall View
• Mid-term: Trend remains positive, but still in correction phase.
• Short-term: Bounce potential is valid, yet supply pressure sits just above.
• Summary: Accumulation is forming below, distribution remains above best to approach with reactive “confirmation-based” setups from demand zones rather than chasing moves in the middle.

Beyond the Chart - GOLD Market Technicals & Fundamentals🟡 XAUUSD Daily OG FlowMaster Zones
Gold is testing the key 3,930-3,910 demand region after rejecting the 4,250 distribution zone. The market is in a mid-term correction phase within a broader bullish structure.
🔴 Short-Term
If 3,910 breaks, expect a continuation toward 3,750 → 3,500 — next OG accumulation layers where liquidity may build again.
🟢 Mid-Term
Holding above 3,900 could trigger a bounce toward 4,100–4,250 (previous imbalance zone) before the next decision phase.
⚙️ Accumulation / Distribution Map
Distribution: 4,250–4,300
Current Reaction: 3,910
Next Demand Pools: 3,750 → 3,500
📰 Market Data Watch
Upcoming U.S. inflation, bond yields, and Fed tone can sharply impact gold’s volatility and decide if the correction extends or reverses.

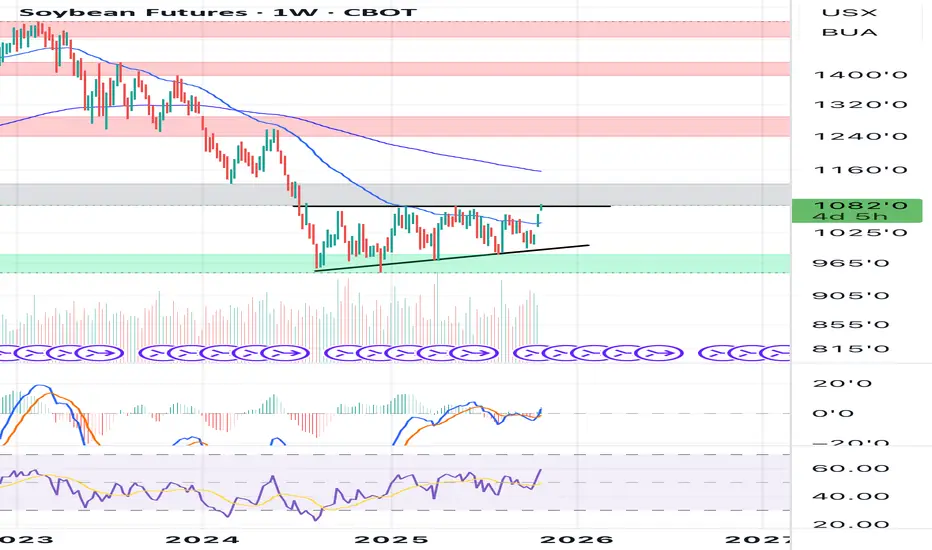
Long on Soybeans Clear ascending triangle in play.
RSI, MACD are bullish and also above the 50 EMA.
I’m bullish on soybeans and current fundamentals.
I will long on breakout of ascending triangle.
TP - 1200
Palladium - The Calm Before the Next Surge!🏹Palladium has been on a strong bullish run , riding within a clean rising channel. After a sharp impulse, price is now cooling off — and this pullback might just be the calm before the next surge.
⚔️The metal is approaching a major intersection zone where the rising trendline meets a strong demand and structure area, a confluence that has previously sparked powerful rallies. As long as this intersection holds, I’ll be watching for bullish confirmations to join the trend.
A healthy correction into this zone could set the stage for the next impulsive wave, with potential upside targets around $1,550 and even $1,700 if momentum kicks in.
In short, Palladium remains overall bullish, and this upcoming retest could be the perfect reload zone before the next big move north.
📊All Strategies Are Good; If Managed Properly!
~Richard Nasr

COPPER - Following Gold?Hello TradingView Family / Fellow Traders. This is Richard, also known as theSignalyst.
📈 COPPER has been overall bullish, trading inside the rising wedge pattern in blue.
At present, COPPER is undergoing a correction phase and it is hovering around the lower bound of the wedge.
Moreover, it is retesting a massive support zone marked in green.
🏹 Thus, the highlighted blue circle is a strong area to look for buy setups as it is the intersection of the green support and lower blue trendline acting as a non-horizontal support.
📚 As per my trading style:
As #COPPER approaches the blue circle zone, I will be looking for bullish reversal setups (like a double bottom pattern, trendline break , and so on...)
📚 Always follow your trading plan regarding entry, risk management, and trade management.
Good luck!
All Strategies Are Good; If Managed Properly!
~Rich

Gold’s Golden Retest?Gold continues to trade within a rising blue channel, maintaining its overall bullish structure.
Currently, price is retesting the intersection between the lower blue trendline and the red structure zone, which has acted as strong support multiple times.
As long as this confluence area holds, I’ll be looking for trend-following longs targeting the upper boundary of the channel.
A break and close below this zone would temporarily pause the bullish momentum and open room for a deeper correction.
⚠️ Disclaimer: This is not financial advice. Always do your own research and manage risk properly.
📚 Stick to your trading plan regarding entries, risk, and management.
Good luck! 🍀
All Strategies Are Good; If Managed Properly!
~Richard Nasr

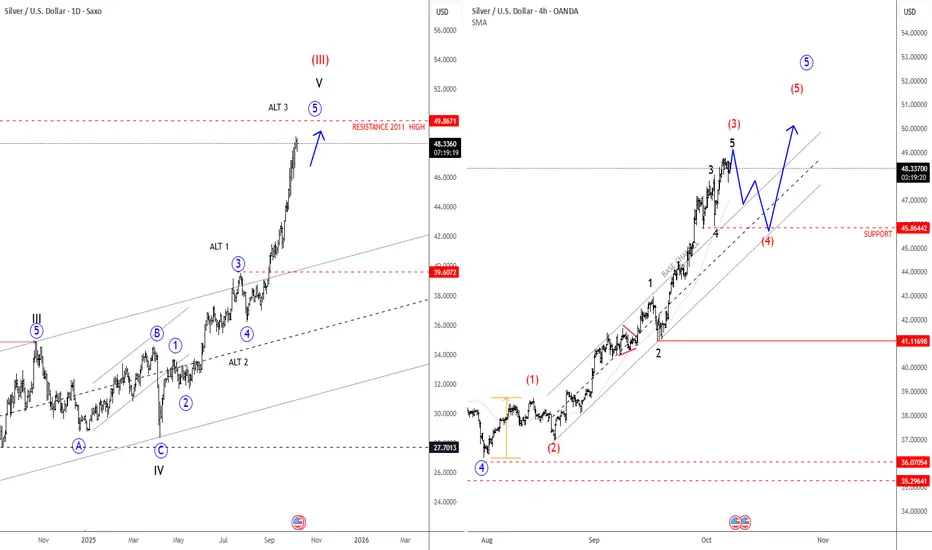
Silver Is Extending Impulsively Higher; All-Time Highs SoonSilver Is Extending Impulsively Higher, which can push the price into all-time highs from a technical point of view and by Elliott wave model.
Silver is on the rise and has been outperforming gold quite a lot over the last week, and it looks like an extended leg up is still in progress; seems like wave three of an extended impulse, therefore more gains are possible after next three-leg retracement. Based on the 4-hour chart, there is a chance that price goes towards 50usd, but there can be some new pullback first. Ideally red wave (4) could stabilize near 45.86. Only a sharp impulse down closer to 43 level will be an indication that higher degree wave four has started.
Higher Time frame charts show an ongoing bull cycle that is now targeting the high from April 2011, which could be the next major level and a potential area for a new retracement, maybe sometime in 2026.
UKOIL H1 | Potential Bearish Drop AheadBased on the H1 chart analysis, we could see the price rise to the sell entry, which is an overlap resistance that aligns with the 23.6% Fibonacci retracement and could reverse from his levle to the take profit.
Sell entry is at 65.70, which is an overlap resistance that aligns with the 23.6% Fibonacci retracement.
Stop loss is at 66.69, which is a pullback resistance that aligns with the 38.2% Fibonacci retracement.
Take profit is at 64.03, which is a pullback support.
High Risk Investment Warning
Trading Forex/CFDs on margin carries a high level of risk and may not be suitable for all investors. Leverage can work against you.
Stratos Markets Limited (tradu.com ):
CFDs are complex instruments and come with a high risk of losing money rapidly due to leverage. 65% of retail investor accounts lose money when trading CFDs with this provider. You should consider whether you understand how CFDs work and whether you can afford to take the high risk of losing your money.
Stratos Europe Ltd (tradu.com ):
CFDs are complex instruments and come with a high risk of losing money rapidly due to leverage. 66% of retail investor accounts lose money when trading CFDs with this provider. You should consider whether you understand how CFDs work and whether you can afford to take the high risk of losing your money.
Stratos Global LLC (tradu.com ):
Losses can exceed deposits.
Please be advised that the information presented on TradingView is provided to Tradu (‘Company’, ‘we’) by a third-party provider (‘TFA Global Pte Ltd’). Please be reminded that you are solely responsible for the trading decisions on your account. There is a very high degree of risk involved in trading. Any information and/or content is intended entirely for research, educational and informational purposes only and does not constitute investment or consultation advice or investment strategy. The information is not tailored to the investment needs of any specific person and therefore does not involve a consideration of any of the investment objectives, financial situation or needs of any viewer that may receive it. Kindly also note that past performance is not a reliable indicator of future results. Actual results may differ materially from those anticipated in forward-looking or past performance statements. We assume no liability as to the accuracy or completeness of any of the information and/or content provided herein and the Company cannot be held responsible for any omission, mistake nor for any loss or damage including without limitation to any loss of profit which may arise from reliance on any information supplied by TFA Global Pte Ltd.
The speaker(s) is neither an employee, agent nor representative of Tradu and is therefore acting independently. The opinions given are their own, constitute general market commentary, and do not constitute the opinion or advice of Tradu or any form of personal or investment advice. Tradu neither endorses nor guarantees offerings of third-party speakers, nor is Tradu responsible for the content, veracity or opinions of third-party speakers, presenters or participants.

GOLD => $4000 The MagnetGold has been pushing higher within its bullish log-chart structure, moving inside two rising channels (red short-term and blue long-term).
The interesting part? The $4000 level is acting like a magnet, and it happens to intersect with the upper bound of both channels. This rare confluence makes $4000 a key level to watch.
As long as the bullish momentum holds, Gold remains on track toward this magnet level. But once there, the reaction will be critical, a clean breakout could open the door for fresh highs, while a rejection may trigger a correction before continuation.
⚠️ Disclaimer: This is not financial advice. Always do your own research and manage risk properly.
📚 Stick to your trading plan regarding entries, risk, and management.
Good luck! 🍀
All Strategies Are Good; If Managed Properly!
~Richard Nasr

UKOIL H4 | Based on the H4 chart analysis, we could see the price fall to the buy entry which is a pullback support that aligns with the 50% Fibonacci retracement and could bounce from this levle to the upside.
Buy entry is at 68.47, which is a pullback support that aligns with the 50% Fibonacci retracement.
Stop loss is at 67.17, which is a pullback support that is slightly above the 78.6% Fibonacci retracement.
Take profit is at 70.53, which is a swing high resistance.
High Risk Investment Warning
Trading Forex/CFDs on margin carries a high level of risk and may not be suitable for all investors. Leverage can work against you.
Stratos Markets Limited (tradu.com ):
CFDs are complex instruments and come with a high risk of losing money rapidly due to leverage. 65% of retail investor accounts lose money when trading CFDs with this provider. You should consider whether you understand how CFDs work and whether you can afford to take the high risk of losing your money.
Stratos Europe Ltd (tradu.com ):
CFDs are complex instruments and come with a high risk of losing money rapidly due to leverage. 66% of retail investor accounts lose money when trading CFDs with this provider. You should consider whether you understand how CFDs work and whether you can afford to take the high risk of losing your money.
Stratos Global LLC (tradu.com ):
Losses can exceed deposits.
Please be advised that the information presented on TradingView is provided to Tradu (‘Company’, ‘we’) by a third-party provider (‘TFA Global Pte Ltd’). Please be reminded that you are solely responsible for the trading decisions on your account. There is a very high degree of risk involved in trading. Any information and/or content is intended entirely for research, educational and informational purposes only and does not constitute investment or consultation advice or investment strategy. The information is not tailored to the investment needs of any specific person and therefore does not involve a consideration of any of the investment objectives, financial situation or needs of any viewer that may receive it. Kindly also note that past performance is not a reliable indicator of future results. Actual results may differ materially from those anticipated in forward-looking or past performance statements. We assume no liability as to the accuracy or completeness of any of the information and/or content provided herein and the Company cannot be held responsible for any omission, mistake nor for any loss or damage including without limitation to any loss of profit which may arise from reliance on any information supplied by TFA Global Pte Ltd.
The speaker(s) is neither an employee, agent nor representative of Tradu and is therefore acting independently. The opinions given are their own, constitute general market commentary, and do not constitute the opinion or advice of Tradu or any form of personal or investment advice. Tradu neither endorses nor guarantees offerings of third-party speakers, nor is Tradu responsible for the content, veracity or opinions of third-party speakers, presenters or participants.

Copper – Gearing Up for Higher LevelsAs long as Copper continues to hold above the $4.00 handle, the structure favors continuation to the upside. A clean break of $5.00 sets the stage for a strong bullish leg, with medium-term targets around $7.40 and, eventually, the possibility of Copper extending into double digits above $10.
> Key Levels:
Major support: $4.00 – $4.20 zone
Resistance / breakout level: $5.00
TP1: $7.39
TP2: $11.04
Beyond the chart, the future demand outlook for Copper remains extremely strong. With accelerating trends in electrification, renewable energy, EV adoption, and global infrastructure expansion, Copper is set to play a critical role in the next decade. This positions the metal as not just a strong technical play, but also a strategic long-term investment.
TL;DR
Copper is building momentum technically, while future demand drivers add strong tailwinds. Above $5, the path toward $7+ and potentially $10+ becomes increasingly realistic.

XAUUSD H1 | Bearish drop offBased on the H1 chart analysis, we can see that the price has rejected off the sell entry at 3,655.23, which is a pullback resistance and could drop from this levle to the take profit.
Stop loss is at 3,672.97, whichis a pullback resistance.
Take profit is at 3,616.99, which is a pullback support that lines up with the 127.2% Fibonacci extension.
High Risk Investment Warning
Trading Forex/CFDs on margin carries a high level of risk and may not be suitable for all investors. Leverage can work against you.
Stratos Markets Limited (tradu.com ):
CFDs are complex instruments and come with a high risk of losing money rapidly due to leverage. 65% of retail investor accounts lose money when trading CFDs with this provider. You should consider whether you understand how CFDs work and whether you can afford to take the high risk of losing your money.
Stratos Europe Ltd (tradu.com ):
CFDs are complex instruments and come with a high risk of losing money rapidly due to leverage. 66% of retail investor accounts lose money when trading CFDs with this provider. You should consider whether you understand how CFDs work and whether you can afford to take the high risk of losing your money.
Stratos Global LLC (tradu.com ):
Losses can exceed deposits.
Please be advised that the information presented on TradingView is provided to Tradu (‘Company’, ‘we’) by a third-party provider (‘TFA Global Pte Ltd’). Please be reminded that you are solely responsible for the trading decisions on your account. There is a very high degree of risk involved in trading. Any information and/or content is intended entirely for research, educational and informational purposes only and does not constitute investment or consultation advice or investment strategy. The information is not tailored to the investment needs of any specific person and therefore does not involve a consideration of any of the investment objectives, financial situation or needs of any viewer that may receive it. Kindly also note that past performance is not a reliable indicator of future results. Actual results may differ materially from those anticipated in forward-looking or past performance statements. We assume no liability as to the accuracy or completeness of any of the information and/or content provided herein and the Company cannot be held responsible for any omission, mistake nor for any loss or damage including without limitation to any loss of profit which may arise from reliance on any information supplied by TFA Global Pte Ltd.
The speaker(s) is neither an employee, agent nor representative of Tradu and is therefore acting independently. The opinions given are their own, constitute general market commentary, and do not constitute the opinion or advice of Tradu or any form of personal or investment advice. Tradu neither endorses nor guarantees offerings of third-party speakers, nor is Tradu responsible for the content, veracity or opinions of third-party speakers, presenters or participants.

Gold Pulls Back Within UptrendGold pushed higher to the upper side of the triangle this month, and then also broke above the 3450 area, above both waves D and B swing points. This suggests the contracting range since May is finished and we are now in a new bullish phase, likely the fifth wave on the higher time frame chart. We see metal now in the third subwave of this fifth wave, extending now to 261.8% Fib target. So gold is clearly in an uptrend as long as we trade above 3400, but keep in mind that this higher-degree fifth wave could complete the bull run from the 2023 lows within the next few weeks. But we are not in that final stage yet, looks like more upside after intraday sub wave four pullback., First support is at 3579-3600. So after some slow-down, gold is expected to stay up.

Feeder Cattle Outperform Gold - Cyclical or Structural?Why Do Food Costs Keep Increasing? Could it be cyclical or structural?
Since Covid, most commodity prices reached their lows. From there, not only has gold climbed to an all-time high, but feeder cattle or beef prices have also broken record highs. Their percentage gains have even surpassed that of gold.
If the price increase is cyclical, it should eventually come back down with the cycle.
So, what are the structural elements that cause some commodities to break new highs, while others are still pending growth —and how can we manage them?
Feeder Cattle Futures & Options
Ticker: GF
Minimum fluctuation:
0.00025 per pound = $12.50
Disclaimer:
• What presented here is not a recommendation, please consult your licensed broker.
• Our mission is to create lateral thinking skills for every investor and trader, knowing when to take a calculated risk with market uncertainty and a bolder risk when opportunity arises.
CME Real-time Market Data help identify trading set-ups in real-time and express my market views. If you have futures in your trading portfolio, you can check out on CME Group data plans available that suit your trading needs www.tradingview.com

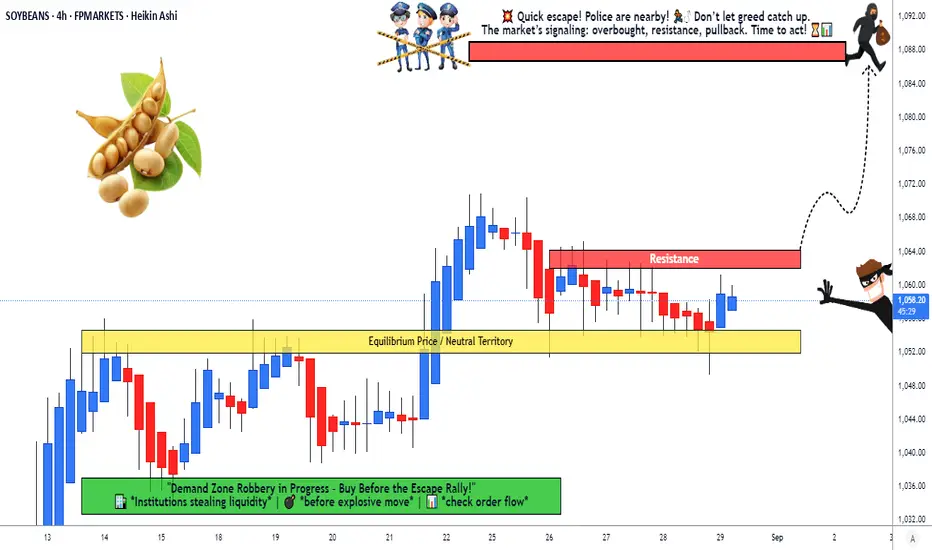
Soybeans vs USD: Breakout Robbery in Progress – Join the Escape!🚨💰🌱 Soybeans vs. US Dollar Commodities CFD Heist Plan (Swing/Day) 🕶️⚡
👋 Dear Ladies & Gentlemen… and my fellow Thief OG’s 🐱👤💵,
Tonight’s grand heist is in the Soybeans Vault 🌱💰 vs. the Mighty Dollar 💵.
We move Bullish 📈 – the loot is ripe, and the guards are weak!
🎯 The Master Heist Plan
Entry (Breakout Trigger): ⚡ 1065.00
👉 Once the vault door cracks open at 1065, we sneak in with Thief Layer Entries 🕶️🔪:
1063.00
1060.00
1055.00
1052.00
(Keep layering your entries, thief-style… the deeper the pullback, the fatter the loot 💎💸).
Stop Loss (Thief Escape Plan): 🏃♂️💨
📍 The secret tunnel is at 1040.00.
But hey thieves, adjust your SL 🔑 based on your strategy & risk appetite.
Target (Police Barricade 🚔):
👉 1088.00 – That’s where the cops set up the roadblock, so escape with the bag before they catch you 🏆💰✈️.
🕶️ Thief Trading Wisdom
Multiple buy limit layered orders = professional thief entry strategy.
Always confirm the breakout before layering in.
Police (market makers) will try to trap you – stay one step ahead 🐱👤⚡.
🔥 Boost our Robbery Plan if you’re part of the crew 💣💵!
The more likes & views, the bigger the gang grows 🚀.
#ThiefTrading 🕶️ #SoybeansHeist 🌱💰 #CommodityLoot 💸 #SwingTradePlan ⚡ #DayTradeRobbery 🐱👤 #USDvsSoybeans 💵 #BreakoutStrategy 📈 #LayerEntry 🔑 #TradingViewHeist 🚔 #MarketLootPlan
Aluminum Trade View
On daily price initiated upside move.
4hour chart good level of risk place to hold for long periods.

Silver Unfolds A New Impulse Within 5th WaveSilver is moving higher as expected, pushing even beyond 39, but since the market also broke to new highs, it’s clear that higher degree wave four is finished as a flat correction back at 36.20, so be aware of even further continuation higher into wave five while makret trades above 39. We need five subwaves now in this blue wave 5 cycle, so more gains can follow after some intraday setbacks. But keep in mind that we are in the final leg of the higher-degree fifth wave impulse that could come to an end around 42/43 this year.

GOLD H4 | earish Reversal Setup at Swing High ResistanceBased on the H4 chart analysis, we could see the price rise to the sell entry at 3,400.60, which is a swing high resistance and could reverse from this level to the downside.
Stop loss is at 3,431.26, which is a swing high resistance that aligns with the 127.2% Fibonacci extension.
Take profit is at 3,350.21, which is a pullback support that lines up with the 50% FIbonacci retracment.
High Risk Investment Warning
Trading Forex/CFDs on margin carries a high level of risk and may not be suitable for all investors. Leverage can work against you.
Stratos Markets Limited (tradu.com ):
CFDs are complex instruments and come with a high risk of losing money rapidly due to leverage. 65% of retail investor accounts lose money when trading CFDs with this provider. You should consider whether you understand how CFDs work and whether you can afford to take the high risk of losing your money.
Stratos Europe Ltd (tradu.com ):
CFDs are complex instruments and come with a high risk of losing money rapidly due to leverage. 66% of retail investor accounts lose money when trading CFDs with this provider. You should consider whether you understand how CFDs work and whether you can afford to take the high risk of losing your money.
Stratos Global LLC (tradu.com ):
Losses can exceed deposits.
Please be advised that the information presented on TradingView is provided to Tradu (‘Company’, ‘we’) by a third-party provider (‘TFA Global Pte Ltd’). Please be reminded that you are solely responsible for the trading decisions on your account. There is a very high degree of risk involved in trading. Any information and/or content is intended entirely for research, educational and informational purposes only and does not constitute investment or consultation advice or investment strategy. The information is not tailored to the investment needs of any specific person and therefore does not involve a consideration of any of the investment objectives, financial situation or needs of any viewer that may receive it. Kindly also note that past performance is not a reliable indicator of future results. Actual results may differ materially from those anticipated in forward-looking or past performance statements. We assume no liability as to the accuracy or completeness of any of the information and/or content provided herein and the Company cannot be held responsible for any omission, mistake nor for any loss or damage including without limitation to any loss of profit which may arise from reliance on any information supplied by TFA Global Pte Ltd.
The speaker(s) is neither an employee, agent nor representative of Tradu and is therefore acting independently. The opinions given are their own, constitute general market commentary, and do not constitute the opinion or advice of Tradu or any form of personal or investment advice. Tradu neither endorses nor guarantees offerings of third-party speakers, nor is Tradu responsible for the content, veracity or opinions of third-party speakers, presenters or participants.

XAU/USD: Gold at Make-or-Break – Will 3400 Hold or Break?Macro & Fundamental Context
Gold remains highly influenced by Fed rate expectations: Powell’s speech at Jackson Hole opened the door to possible rate cuts as early as September. This is pressuring the US dollar lower and supporting precious metals, but at the same time, persistently high inflation and strong US macro data (PPI at the highest level since February) maintain a risk of two-way volatility.
COT & Sentiment
COT Report: Non-Commercials (speculators) remain strongly net long (275k contracts vs 62k short), but in recent weeks we’ve seen a decline of 12,800 longs and an increase of 4,000 shorts → clear signs of profit-taking.
Commercials (hedgers) remain heavily net short (316k contracts), consistent with a defensive stance at current resistance levels.
Retail Sentiment: 56% short vs 44% long → slightly contrarian, as retail traders tend to sell strength.
Seasonality
Historically, August is a bullish month for gold (+25–30 avg points over 10/15 years). However, September has one of the worst seasonal performances of the year (-11% over 20y, -29% over 10y). This reinforces the view that late-August rallies could turn into deeper corrections in September.
Technical Analysis
Daily Chart: Gold is currently testing a key supply zone at 3380–3400, with a bearish reaction already visible. RSI shows relative overbought conditions.
Key Levels:
Primary Resistance: 3400–3420 (supply + July highs).
Intermediate Support: 3280–3300 (demand zone + weekly block).
Bearish Target: 3240–3200 (major demand + bullish rejection block).
Operational Outlook
Base Case (most likely): Rejection from 3400 → retracement towards 3280/3240 → short setups favored with confirmation on H4/H1.
Alternative Scenario (less likely but possible): Breakout above 3420 with a weekly close → bullish continuation confirmed → targets at 3480–3520.
Risk Management: Extreme caution ahead of Powell’s speech and NFP release, as both could quickly invalidate setups.
