XAG to hit the psychological level of $100Targets are still very much bullish for 2026.
$100short term target
looking for a range between $80-100 for building up a liquidity block
Demand zone $71-74 - area of interest.
Daily (short term interest)
www.tradingview.com
Weekly
www.tradingview.com
Monthly Cup an Handle
www.tradingview.com
Calc of cup and handle:
Key zones
Critical resistance zones throughout the pattern:
Time Period Resistance Level Pattern Phase
1980-2011 $50+ (1980 high) Cup Formation
2011-2024 $49-$50 zone Handle Development
Late 2024 $50-$52 range Pre-breakout
Nov 2025 $55+ achieved Breakout Confirmation
Cup Structure (Multi-Decade)
Left Rim: ~1979–1980 highs near $49/oz — first peak.
Base: ~1982–2004 range near ~$3.46–$6.12 — extended bottom.
Right Rim: ~2011 high near ~$49/oz — second peak.
Handle structure:
Breakout Resistance: $49 (referring to 1979-80 and 2011), now 2025
$49-$3.46 = $45.54
use the extension target of $45.54 + $49 (breakout resistance) = $94.54 as a first point of reversal zone for an extension target.
Risk Warning
Trading leveraged products such as Forex, commodities and CFDs, carries with it a high level of risk and so may not be suitable for every investor. Prior to trading the foreign exchange, commodity or CFD market, consider your investment objectives, level of experience and risk appetite. You should never risk more than you can afford to lose. If you fail to understand or are uncertain of the risks involved, please seek independent advice and remember to conduct due diligence as criteria varies to suit the individual.
Below are some of the take aways from the video - please listen again incase any detail is missed.
Do you enjoy the setups?
Professional analyst with 8+ years experience in the capital markets
Focus on technical output not fundamentals
Focus on investing for long term positional moves
Provide updates where necessary - with new updated ideas tracking the progress.
If you like the idea, please leave a like or comment.
To all the followers, thank you for your continued support.
LVPA MMXXVI
Comodities


GOLD - Ascending Channel Holding Strong | FVG Retest in Play
Hey TradingView community! 👋
Gold is looking really interesting right now. Let me break down what I'm seeing on the 45-minute chart.
The Setup
XAUUSD is trading at 4,477 inside a well-defined ascending channel that's been holding since early January. After that sharp rejection from the 4,550 resistance zone, price pulled back and is now consolidating right above a key FVG (Fair Value Gap) zone around 4,460-4,480.
This is exactly the kind of structure I love to see - higher highs, higher lows, and now a healthy retest of the imbalance zone.
Why I'm Bullish
Ascending channel structure intact - buyers defending the rising trendline
FVG zone acting as support - price reacting positively here
Safe-haven demand returning amid geopolitical uncertainty
Performance is insane: +68.24% over the past year, +3.66% YTD already
52-week high at 4,550 - we're knocking on the door
Key Levels I'm Watching
Resistance:
4,500 - Psychological level and recent rejection
4,550 - 52-WEEK HIGH / Major resistance
Support:
4,460-4,480 - FVG zone (current test)
4,408 - Channel support / horizontal support
4,275 - Lower channel boundary
My Game Plan
Primary scenario: If gold holds above the 4,460 FVG zone and respects the rising channel support, I expect buyers to push price back toward 4,500-4,550 resistance. A clean break above 4,550 opens the door for 4,600+.
Risk scenario: A decisive break below 4,408 would weaken the bullish structure and could trigger a deeper pullback toward 4,300-4,350.
The Bottom Line
Structure remains constructive. The ascending channel is intact. Safe-haven flows are supporting gold amid all the Trump policy chaos and geopolitical headlines. As long as we hold above 4,408, I'm staying bullish with targets at 4,500 and 4,550.
What do you think? Are you bullish or bearish on gold here? Drop your thoughts in the comments! 👇
If this analysis helped you, please comment what you want me to analyze next!

Q4 2025 | Coffee bullish move to $466I'm expecting this move in the last quarter of 2025.
The invalidation level for the idea is shown on the chart.
I also expect some "resistance" at the $417.12 level.
Let's see what the price does.

Silver (SLV): Multi-Year Cup & Handle SetupSilver appears to be repeating the same large-scale institutional “Cup and Handle” structure that played out almost perfectly on Gold.
The difference is that in SLV (iShares Silver Trust), the chart history is shorter, so the full formation is not as clearly visible — but if we reference the historical silver chart (since 1802), the pattern becomes unmistakable.
That long-term chart shows a massive multi-decade rounded base — the cup — and now price has already touched the upper boundary, effectively activating the pattern.
🧠 Technical Context
On the long-term silver chart, the handle represents the multi-year consolidation we’ve seen since the 2011 peak.
In SLV, this structure is compressed, but the correlation with physical silver remains ~99%, since the fund is backed by over 90% physical silver holdings.
This makes SLV an ideal instrument for expressing long-term silver exposure — it tracks spot silver almost tick-for-tick, while providing the liquidity and accessibility of an ETF.
Technically, silver has already tested the upper rim of the cup, confirming that the pattern is active.
This breakout will likely be followed by a short-term consolidation (the final part of the handle) before the market enters what could become a multi-year rally phase.
Based on historical fractals and volume structure, the first major pullback is expected toward the $35–25 zone, which corresponds to the previous 4th-wave cluster — a classic accumulation area in Elliott terms.
I’ll be looking to accumulate aggressively in the $35–30 range, scaling in gradually as price approaches those levels.
🎯 Trade Plan
Instrument: SLV (iShares Silver Trust ETF)
Correlation to Spot Silver: ~99%
Primary Support Zone (Accumulation): $25 – $35
Handle Breakout Level: around $50
Long-Term Target: $800+ (silver spot equivalent)
Stop-Loss: per individual risk management
Time Horizon: 5+ years
Once silver completes its consolidation and breaks above $50, the measured move of the Cup and Handle suggests a multi-hundred percent rally that could unfold over the next decade.
The breakout will likely be accompanied by rising institutional volume and strong follow-through momentum.
🧭 Strategic View
I trade silver exclusively through SLV, as it offers the most direct and reliable exposure to the underlying metal.
The fund’s near-perfect correlation with spot silver makes it ideal for implementing long-term accumulation strategies without the operational complexities of futures or CFDs.
This will be one of my core positions for the coming decade.
After the expected correction into the $30–35 range, I plan to build a large position, possibly hedged later on, and hold through the full bullish cycle.
Silver’s technical structure, macro fundamentals, and historical analogs all point toward a potential generational rally once this base completes.
This is the setup I’m positioning for — patiently, systematically, and with conviction.
Summary
Long-term “Cup and Handle” formation now confirmed
Final correction expected before the next secular rally
SLV offers near-1:1 tracking with physical silver
Accumulation zone: $35–25
Target: $800+ over the next decade

WTI on high time frame
1. **Current Price Action**: WTI has reached the $56 level, indicating a liquidity sweep.
2. **Signals for Higher Prices**: After the liquidity sweep, there are indications that prices may rise, with the first target at around $64.
3. **Geopolitical Factors**: The analysis is contingent on geopolitical stability, as any changes in tariffs or geopolitical situations can invalidate this forecast.
If you need more detailed analysis or specific aspects explained, feel free to ask!

Silver forming a long-term “Cup and Handle” - as Gold didSilver seems to be repeating the same institutional “Cup and Handle” structure that we recently saw play out perfectly on Gold.
On Gold, the price completed the entire measured move — equal to the depth of the cup — before entering consolidation.
Now, Silver is building a very similar long-term formation, and this setup could define the market direction for the next several years.
🧠 Technical Context
On the higher timeframes (1W and 1M), Silver has formed a clear rounded base — the cup.
The current consolidation area represents the handle, and price is now approaching the upper boundary of that handle.
Once we see a decisive breakout above the handle resistance, institutions will likely defend that zone on the first retest.
This pattern is one of the most reliable continuation formations in long-term trends, especially when accompanied by rising volume near the breakout area.
There’s a very important condition: this pattern becomes active only after the handle breakout.
Before the breakout, it’s just an unconfirmed structure — the pattern is validated only once the handle level is broken.
🎯 Trade Plan
Breakout Level (Handle Resistance): around $50.0 – $51
Usually, the breakout happens on high volume, accompanied by several strong bullish candles
Retest Zone: $30 – $35.0
Target (long-term extension): $600.0+
Stop-Loss: according to your risk management strategy
📊 Summary
If Silver repeats the Gold scenario, we might see a clean breakout–retest–continuation structure with very limited pullbacks once the move begins.
This could mark the start of a multi-year bullish phase in silver.
I’ll be monitoring the breakout confirmation and volume profile closely before entering.
Once confirmed, the upside potential looks substantial compared to the risk.
This is not financial advice. For educational purposes only

Q4 2025 | SOYBEANS to $964.1After the bullish move in Q2, the price has been consolidating.
I would like to see this move towards the sell side occur in the last quarter of this year.
The price is within a 6-month consolidation, so either side of the range can be taken.
The invalidation level is indicated on the chart.

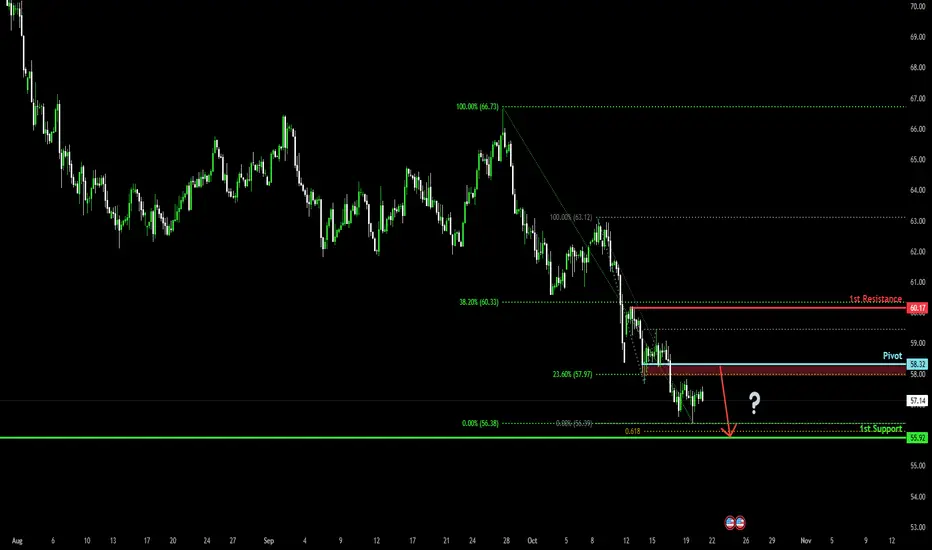
Bearish continuation setup?WTI Oil (XTI/USD) is rising towards the pivot and could drop to the 1st support.
Pivot: 58.32
1st Support: 55.92
1st Resistance: 60.17
Disclaimer:
The above opinions given constitute general market commentary, and do not constitute the opinion or advice of IC Markets or any form of personal or investment advice.
Any opinions, news, research, analyses, prices, other information, or links to third-party sites contained on this website are provided on an "as-is" basis, are intended only to be informative, is not an advice nor a recommendation, nor research, or a record of our trading prices, or an offer of, or solicitation for a transaction in any financial instrument and thus should not be treated as such. The information provided does not involve any specific investment objectives, financial situation and needs of any specific person who may receive it. Please be aware, that past performance is not a reliable indicator of future performance and/or results. Past Performance or Forward-looking scenarios based upon the reasonable beliefs of the third-party provider are not a guarantee of future performance. Actual results may differ materially from those anticipated in forward-looking or past performance statements. IC Markets makes no representation or warranty and assumes no liability as to the accuracy or completeness of the information provided, nor any loss arising from any investment based on a recommendation, forecast or any information supplied by any third-party.
Gold’s Bull Run Could Test $4k by Year-EndGold has been on a powerful run, breaking out of previous consolidation zones and holding strong above its key moving averages. The momentum on the weekly chart looks intact, and price action is now pushing into the $3,800–$3,900 range.
If this trend continues, the next big psychological level to watch is $4,000. That zone also lines up with a strong area of interest where some profit-taking could happen. As long as gold stays above the 33 EMA and keeps closing strong on higher timeframes, the path toward $4k by year-end looks very realistic.
In short, buyers are clearly in control, and gold is steadily marching toward uncharted territory.

Is Aster Ready for an Upside Surge?$ASTER bounced before reaching the key zone, but now it's facing a slight rejection at the trendline. If it manages to close successfully above the resistance line, we could see a solid upside move.
Keep a close eye on this setup, it might just break out soon.
DYOR, NFA
Stay tuned for more update and follow us on tradingview!

Ethereum’s $4K Battle: What's Next?CRYPTOCAP:ETH is currently retesting a strong support level on the weekly timeframe, previously acting as resistance, around the $4,000 mark.
If Ethereum holds this support, we could see a potential bounce back towards higher levels. However, if the price fails to hold, further downside may test lower support areas.
This could be a pivotal point for Ethereum’s next move, so monitoring this zone is essential for short- or long-term strategies.
DYOR, NFA
#PEACE

XAUUSD - Daily | The breakout is REALSimple trading - Triangle pattern
Gold is back to making All-Time highs. Reaching as high as 3600. You can see the breakout was fast and instant. In less than 2 weeks, gold managed to move the price over 1500 pips.
The target of the triangle breakout is nearly reached. Roughly 3675.
Gold has already tested support that was previously a bullish daily FVG. With clean rejection, we see the price remaining bullish.

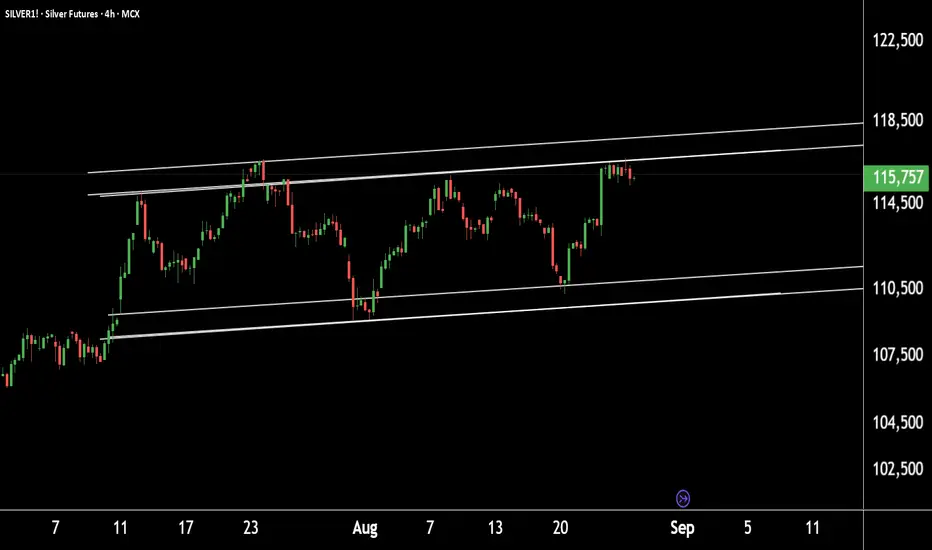
SILVER1! at resistance zone – confirmation before entryDaily Chart Update: SILVER1!
SILVER1! is currently sustaining near its resistance zone at 116000–117700.
If the resistance holds, we may see lower prices ahead.
However, if this level is breached, SILVER1! has the potential to move towards 120000.
Thank you !!
XAU/USD Technical Outlook for the upcoming week In this video I look at the current PA of gold using TPO chart and correlate a plan for where we could see price go in the coming week .
I use a regular chart and TPO chart for this analysis as well as Fibonacci tools .
We are currently in the middle of a range and until that range is broken we plan ahead and seek the best high probability setup via looking at the charts and correlating with the News catalysts.

$3,600 Gold Incoming? The Accumulation Zone Says It All!Gold has been showing textbook price action. After years of testing, the long-term trendline was finally broken and then flipped into solid support, classic breakout-retest behavior.
Former resistance zones have consistently turned into support on the way up, confirming bullish strength. Now, price is consolidating in a tight range near all-time highs, this is not weakness, it's accumulation.
As long as the structure holds, this looks like a potential launchpad for the next leg higher.
Patience pays in gold; accumulation leads to expansion.
DYOR, NFA
Thanks for Reading!

Sugar is entering into bullish marketSugar is entering a bull market. I expect a recovery this week or two. The minimum wave equality norm has been fulfilled, so we may see multi-year bullish growth. But we need to be careful not to fall into another, final low at $13-11.

COFFEE Setback targetGlobal picture on Coffee is exit from 20 years triangle. Locally i am anticipating setback into the marked zone because of ratio of the double zigzag on the minor degree.
After this i am anticipating grows resume to ~485

Bullish momentum to extend?WTI Oil (XTI/USD) has bounced off the pivot and could potentially rise to the 1st resistance.
Pivot: 73.40
1st Support: 71.46
1st Resistance: 76.64
Risk Warning:
Trading Forex and CFDs carries a high level of risk to your capital and you should only trade with money you can afford to lose. Trading Forex and CFDs may not be suitable for all investors, so please ensure that you fully understand the risks involved and seek independent advice if necessary.
Disclaimer:
The above opinions given constitute general market commentary, and do not constitute the opinion or advice of IC Markets or any form of personal or investment advice.
Any opinions, news, research, analyses, prices, other information, or links to third-party sites contained on this website are provided on an "as-is" basis, are intended only to be informative, is not an advice nor a recommendation, nor research, or a record of our trading prices, or an offer of, or solicitation for a transaction in any financial instrument and thus should not be treated as such. The information provided does not involve any specific investment objectives, financial situation and needs of any specific person who may receive it. Please be aware, that past performance is not a reliable indicator of future performance and/or results. Past Performance or Forward-looking scenarios based upon the reasonable beliefs of the third-party provider are not a guarantee of future performance. Actual results may differ materially from those anticipated in forward-looking or past performance statements. IC Markets makes no representation or warranty and assumes no liability as to the accuracy or completeness of the information provided, nor any loss arising from any investment based on a recommendation, forecast or any information supplied by any third-party.

Potential bullish bounce?USO/USD has bounced off the support level which is an overlap support that lines up with the 38.2% Fibonacci retracement and could potentially rise from this level to our take profit.
Entry: 60.39
Why we like it:
There is an overlap support level that aligns with the 38.2% Fibonacci retracement.
Stop loss: 57.93
Why we like it:
There is a pullback support level that lines up with the 71% Fibonacci retracement.
Take profit: 64.14
Why we like it:
There is a pullback resistance level.
Enjoying your TradingView experience? Review us!
Please be advised that the information presented on TradingView is provided to Vantage (‘Vantage Global Limited’, ‘we’) by a third-party provider (‘Everest Fortune Group’). Please be reminded that you are solely responsible for the trading decisions on your account. There is a very high degree of risk involved in trading. Any information and/or content is intended entirely for research, educational and informational purposes only and does not constitute investment or consultation advice or investment strategy. The information is not tailored to the investment needs of any specific person and therefore does not involve a consideration of any of the investment objectives, financial situation or needs of any viewer that may receive it. Kindly also note that past performance is not a reliable indicator of future results. Actual results may differ materially from those anticipated in forward-looking or past performance statements. We assume no liability as to the accuracy or completeness of any of the information and/or content provided herein and the Company cannot be held responsible for any omission, mistake nor for any loss or damage including without limitation to any loss of profit which may arise from reliance on any information supplied by Everest Fortune Group.

Palladium 8 Year Cycle Low is in and Gold AgreesMaking the case for an 8 year cycle low in palladium

ALUMINIUM Discretionary Analysis: Sinking Like the TitanicI’m not entirely sure, but my gut says aluminium will sink even lower, faster than the Titanic. If not, guess it learned to float. Profit if I’m right, lesson if I’m wrong!
Just my opinion, not financial advice.

Bullish bounce?The Silver (XAG/USD) is falling towards the pivot which has been identified as a pullback support and could bounce to the 1st resistance which acts as a pullback resistance.
Pivot: 32.70
1st Support: 31.91
1st Resistance: 34.46
Risk Warning:
Trading Forex and CFDs carries a high level of risk to your capital and you should only trade with money you can afford to lose. Trading Forex and CFDs may not be suitable for all investors, so please ensure that you fully understand the risks involved and seek independent advice if necessary.
Disclaimer:
The above opinions given constitute general market commentary, and do not constitute the opinion or advice of IC Markets or any form of personal or investment advice.
Any opinions, news, research, analyses, prices, other information, or links to third-party sites contained on this website are provided on an "as-is" basis, are intended only to be informative, is not an advice nor a recommendation, nor research, or a record of our trading prices, or an offer of, or solicitation for a transaction in any financial instrument and thus should not be treated as such. The information provided does not involve any specific investment objectives, financial situation and needs of any specific person who may receive it. Please be aware, that past performance is not a reliable indicator of future performance and/or results. Past Performance or Forward-looking scenarios based upon the reasonable beliefs of the third-party provider are not a guarantee of future performance. Actual results may differ materially from those anticipated in forward-looking or past performance statements. IC Markets makes no representation or warranty and assumes no liability as to the accuracy or completeness of the information provided, nor any loss arising from any investment based on a recommendation, forecast or any information supplied by any third-party.
