EURCHF Time To Scout Longs. Long-Term Trade Opportunity. EURCHF is at a major multi-year historical lows/support, along with a meaningful confluence of support.
Will be on the lookout for longs.
For the Risk-takers one could consider getting in long now with the patience to hold.
OR
For the more risk-averse, first wait for signs of strength from the bulls before getting in long.
As for me I'm more inclined to patiently wait for signs of buyers stepping in before getting in long rather than
jump in front of the momentum at the moment.
Confluence

Gold trade perspective; medium long term biasAlthough US fundamental activity has been progressively bullish, the pandemic outbreak of the coronavirus has had an effect on economies conditions, which can also deter attention from further progress talks between US and China. On a technical standpoint, confluences are pointing towards a more extensive push on gold prices to $1581 before a potential reversal.
-comment below your view and feedback

EURNZD ShortEURNZD is current at a resistance zone at psychological level 1.71000. This zone is confluent with the 61.8%. Entering short a at 1.71000 with TP 1 @ 1.70000 & TP 2 @ 1.69000. I am not a financial advisor. This is not financial advise. This is for educational purposes only.

Fundamentals Plus Technical = Profitability over 70% > So here i will break down the current fundamental analysis and Technical analysis for AUD/USD: im expecting a Push in the bullish side heres why, First looking at Fundamentals We have Retail Sales m/m coming out if you look at previous data its usually a 20-35 pip move in previous data in either bull or bear market. Now with that being said its FC (Forecast) is -0.2 with previous data showing that actual has been greater than -0.2 for a year now with last years report of m/m being -0.4 so chances are in our favor:
Now looking at Technical Analysis We have a market structure that is bullish with no previous market structure being broken according to 4h chart: we have a strong 4h support as a market in a blue highlighted zone - with that being said we have a confluence with Fibonacci being held at 38.2 ratio for my fib traders out there you know this is a PRZ or price reversal zone for trend continuations to happen while im typing this price is already moving into the bullish projection: Now on my indicators you can see on the 1h RSI that there is bullish momentum no indication that bears are in place: Trend is your friend in most scenarios: GOING TO THE 15m chart i like to call the entry chart is that we see are VC (Value chart) is showing indication that sellers are exhausted and it might be time for buyers to step in, With this trade since im a nadex trader there are two options i can take: one being very conservative and expensive at the .400 level or .600 level that i marked in lime green":
Hopefully this helps you how i trade using nadex platform: using fundamentals and technicals its brief i could of elaborated my thought process but also this is my journal for quick thoughts as well :) enjoy!

bullflag target of 10480 confluence w/ risingwedge breakdwn trgtI love the symmetry of equal and opposite reactions and am a big fan of the newtonian physics because I see them play out all the time including in the charts...that's why I decided to place the projected breakdown target line at the same exact price as the projected breakout target to see if any confluence would appear and in doing so you can see the breakdown target lines up precisely at the super strong horizontal support line at 8504 we've been talking about since early 2019. This is the perfect zone for this to land on as it fills the gap on the cme futures chart as well as provides a perfect zone to bounce from. I wouldn't be surprised if I busted a fib retracement out on it it would probably line up well with either the 61.8 or the 32 key fulcrum lines. Anyways for now its still speculation that it will break down from the wedge at this exact spot but will be fun to see how close it gets to my projection. I think it will set a bear trap convincing people that the golden cross might turn into a fakeout then once its gathers enough shorts it will resume bullishness and liquidate them all. Just my guess not financial advice. Thanks for reading!

USDCHF - Multiple confluence bullish moveConfluence factors
· Retested major support
· Broke 2 resistance levels
· Broke trendline
· Resistance turned support and is on fibonacci 38%

#AUDUSD Multiple Patterns, Overstretched Market, Going Up?We have several patterns here in the zone:
Cypher, Bat, ABCD

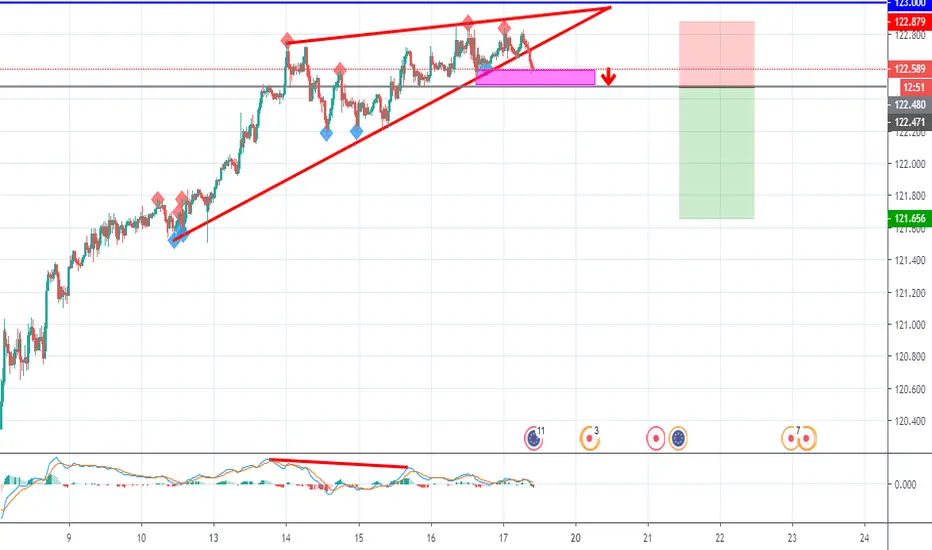
EURJPY Potential ReversalEURJPY Potential Reversal
we are waiting for a momentum candle close below 122.480 to sell this one
Reason:
1- Regular Bearish Divergence on MACD (in red)
2- Objective Wedge Pattern (in red)
3- Resistance Zone from H4 and Daily (in blue)
Three confluences are enough to consider Selling EURJPY , after a break below 122.480 (in gray)
Gold Miner ETF Holds Key ZoneGold miners have been consolidating for the last six months and now the Market Vectors Gold Miner ETF is bouncing at a potentially key level.
GDX peaked around $28 between late October and mid-December. It then broke out and has now pulled back to find support at the old resistance. There's also some confluence with the 50- and 100-day simple moving averages at the same area.
Meanwhile, the U.S. dollar index just made another lower high below its 50-day SMA. This isn't a huge surprise given the Fed's strongly dovish stance -- especially after last week's poor non-farm payrolls report AND this week's tepid inflation numbers.
GDX could also serve as something of a hedge against downside in the broader market. While the S&P 500 isn't showing many clearly bearish signs yet, a lot of good news is potentially priced in.
XAUUSD

EURCAD Short SwingPrice has respected the downward resistance level since early December and has also the horizontal support which has had 1 break out but broke back in within 1 candle. I predict price will break support and fall where the 2 resistance lines cross.

Institutional tradingWe are still in a bearish trend as we are heading to and past the order block into the Liquidity Zone giving us almost 100 pips with a 2:1 ratio.

BTC Bullish Swing ConfirmationChart says it all. Huge upside potential.
Only thing to be weary of is falling back into the orange descending wedge. Right now I'm looking for a doji to form on the current candle and a bounce off of the orange wedge.
When this wedge holds we will know the bottom for BTC in for this cycle. I hope you've been accumulating...

scripts + confluence = confidence for bitcoin longboth scripts have shown great results across the 3 day bitcoin chart but what makes this last move favorable long term is:
3day 200ma below price
ScriptA cloud thinning about to produce a long 'L' signal
Parasar now below price
7ema and 14ema have crossed above scriptA cloud
ScriptB is already a buy signal
^^^ would be a brutal bull trap to create these signals on htf and not continue to >$9k, second chance for those to ride this beautiful wave...
to take advantage of these scripts please visit tradingscripts.best

GBPUSD SHORTConfluence:
Confirmed - Falling channel on 4h
Confirmed - H+S with LL on RH shoulder.
Not confirmed - If price retraces to entry position and drops it will cross 50sma confirming move.
Tight SL gives 3:1 RRR
#confluence

UJ Short comingtechnically chart looking to be ready for a short - as a retracement or resumption of the long term down trend
OR if this breaks a significant bullrun could continue
risk is defined, so im placing my shorts

NZDUSD Big Short Opportunity ComingNZDUSD has been in a widening wedge pattern and has formed a shooting star candle on the daily timeframe. These are both signs of a reversal. Multiple confluence list:
1. Daily shooting star with 3rd test of trendline
2. Daily RSI overbought with 4 Hr RSI bearish divergence
Entry around 0.66150 with stop above high at 0.66450. TP1 0.65550 TP2 0.64550
This is for educational purposes only. This is in no way intended to be financial advice. I am not a financial advisor.

Price near 61.8. Break out on minor trend line From the large time frame price is near 61.8 level. This is a close to an area of structure.
The weekly trend is downwards so this would be countering the main trend. However a small break out has shown itself on the 30 minute chart.
Couple this with RSI divergence and we should see some bullish momentum until the descending trendline.

O

GbpNzdGbpNzd at minor support overall a daily flag type pattern so it is added confluence. There is some lower level of support a bit lower which in my opinion is a bit more important and significant but still not a bad opportunity.

EURUSD LongThe Euro has broken out of a descending channel and is about to retest the break of the channel for a long entry at 1.10100 confluent at the 38% fib. TP1 @ 1.10500 & TP 2 @ 1.10700 Stop below 1.09900. This is for educational purposes only. This is in no way intended to be financial advice. I am not a financial advisor.

XAUUSD LongGold has broken above previous resistance. Look for retest and long entry at $1458 confluent with 61.8%. TP @ $1472. Stop below previous low $1452. This is for educational purposes only. This is in no way intended to be financial advice. I am not a financial advisor.

AUDUSD complete analysis (Part-2)AUDUSD complete analysis (Part-2):
1. The price was very close to completing cypher pattern at 0.67683 but missed 78.6 price. In such cases we usually get a deeper cypher at 1.618 Fib Extension
2. At 0.67347 we have confluence of :
0.886 Fib Level,
1.618 Fib Extension
Cross Trend Line
HTF Support Line
Possible RSI divergence
3. This is a great place to take a Long Position.

GBPJPY Support and Resistance Trading StrategySTRATEGY: S&R Trading Strategy
ID: 1209
Analysis TF: 1D
Focus TF: 1H
AOV: Minor Resistance Area
ET (1H): Bearish Engulfing
CP: Ascending Channel
1D Analysis
MS: Sideways - Price is moving in a range
1H Analysis:
CP: Ascending Channel - Price is moving inside the Ascending Channel. However, price failed to break above minor resistance of 140.597. It also looks like price made a pullback under the Ascending Channel.
Price closed with Bearish Engulfing which act as our Entry Trigger (ET).
Short Position
SL: Just above the Minor resistance (140.618)
TP: 2.19R - Just before Major Support
Note: This post is my personal journal/opinion only. Please trade at your own risk.
