BTC — Cypher Pattern, Fading Momentum & What Comes NextAfter the –36% drop from ATH, Bitcoin has found support in the 80K–90K range, where price has now been chopping sideways for almost 60 days. This kind of consolidation is pretty typical after a sharp selloff.
Back in June 2025, I already mentioned that a potential Cypher harmonic could be forming on BTC. At the time it was still early, but months later the structure is lining up very cleanly and looks like it’s playing out step by step.
The 86K–82K zone remains a key support area that bulls need to defend. Losing this zone would be a big deal technically and would likely open the door for further downside.
Macro Context
Cypher patterns are powerful because they combine:
impulse exhaustion
failed continuation
deep retracement psychology
They tend to appear near major cycle inflection points, especially after extended bullish phases and distribution-style highs. This makes them particularly relevant in the current market environment.
Let’s break the structure down step by step.
Cypher Structure Breakdown (X–A–B–C–D)
BTC has respected the key Fibonacci relationships of a Cypher extremely well.
X → A: Impulse Move
This was a strong, clean impulsive leg showing clear bullish dominance and participation.
Psychology:
Late bears trapped, early longs confident
A → B: Pullback
Price retraced to 0.579, sitting nicely within the Cypher sweet spot (0.382–0.618).
Structure held, which is crucial.
Psychology:
Doubt kicks in → “Is the move over?” → weak hands get shaken out.
B → C: Expansion & Euphoria
BTC pushed to the 1.274 extension of XA, clearly exceeding point A.
This is where optimism peaked and momentum chasing kicked in.
Psychology:
FOMO → breakout buying → late-cycle confidence
C → D: Reversal Zone
This is the most important part of the structure.
0.786 retracement of XC
Completion zone around 65.5K
Strong overlap with:
2021 ATH
2024 trading range
Psychology:
Euphoria → disbelief → forced selling → acceptance.
Where We Are Now
Bitcoin is currently trading between C and D, meaning:
we’re in a corrective phase
volatility has faded
and for the first time in four years, we’re seeing a clear bearish bias after a long period of bullish momentum
100K psychological level remains the major overhead barrier. As long as price stays below this level, bulls are on the defensive.
Macro Check
The broader technical picture remains cautious:
Below previous yearly open (93.5K)
Above yearly open (87.6K)
Below weekly 21 EMA/SMA (98K-102K)
Above monthly 21 EMA/SMA (87K–89K)
Structurally, this looks very similar to previous cycle transitions where momentum slowly faded before deeper moves followed.
Scenarios Going Forward
🔴 Primary Scenario
If the Cypher continues to play out:
downside pressure persists
volatility expands near liquidity pockets
target zone sits around:
66K–64K, centered near the 0.786 Fib (~65.5K)
This would be a healthy macro correction.
🟢 Invalidation Scenario
The bearish structure weakens if:
BTC reclaims and holds above prior value
price shows acceptance above 100K
momentum flips bullish again
In that case, the Cypher either gets delayed or invalidated.
Final Thoughts
Right now, the data favors patience and caution.
The most ideal path would be:
a push into the 97K–100K resistance zone
followed by continuation lower toward the 74.5K year low, which I’d like to see taken out
In choppy conditions like this, no trade is still a trade. Staying flat, preserving capital, and waiting for clarity is often the smartest move. Plan your levels, set alerts, and only act when the market gives you a high-probability setup.
_________________________________
💬 If you found this helpful, drop a like and comment!
Confluencetrading

ZEC — Another -50% Drop AheadZEC has had one of the wildest runs this year, a +2000% explosion from August to November, all in just 80 days, before topping out at $750. Moves that go vertical like this tend to unwind just as aggressively, and ZEC did exactly that: a sharp –60% correction back into the $300 support zone.
That reaction wasn’t random, $300 was a major confluence level:
0.618 Fib retracement of the entire +2000% move
Weekly level lining up cleanly
0.786 Fib of the smaller impulsive wave
Altogether, an ideal spot for a bounce and that’s exactly what we saw. Looking at the current structure, here’s what I’d like to see next:
1. A move toward $500 → Short opportunity
$500 should now act as a psychological resistance level and would be the perfect area for a rejection.
2. A drop into the $250 region → Long opportunity
This zone is stacked with confluence:
0.702 Fib sweet-spot entry of the entire move
0.886 Fib retracement (deep retrace zone)
Weekly order block
Anchored VWAP
Monthly level
POC
This makes $250 a very attractive long-entry, with a simple target back toward $300.
Educational Insight
Parabolic moves like ZEC’s +2000% rally in such a short time almost never resolve sideways. When price accelerates this fast, the market typically needs time to rebalance value. This usually happens through deep retracements and distribution structures.
The first major retrace to the 0.618 Fib often acts as a relief bounce, which we already saw around $300. This bounce doesn’t mean the trend is healthy again it usually represents short covering and dip-buyers stepping in early. Structurally, these bounces often lead to lower highs, forming patterns like Head & Shoulders or broader distribution ranges.
Deeper retracement levels such as the 0.786 and 0.886 Fib tend to be where strong hands accumulate, especially when they align with:
Anchored VWAPs (fair value over time)
High-volume nodes (POC)
Higher-timeframe order blocks
Monthly or weekly levels
This is why the $250 zone stands out. It’s not just “another support”, it’s where multiple market participants agree on value, which increases the probability of a meaningful reaction.
On the flip side, psychological levels like $500 often attract late buyers and breakout traders during corrective rallies. When momentum fades into these areas, they frequently become ideal zones for short entries, especially if volume dries up or rejection wicks form.
Key takeaway:
Instead of chasing fast moves, focus on where value is likely to be defended or rejected. High-probability trades are built where structure, Fibonacci, volume, and VWAP all align.
In summary:
ZEC is offering two solid setups → one on the short side near $500, and one long near $250. Set alerts on both levels and wait for the reaction.
_________________________________
💬 If you found this helpful, drop a like and comment!

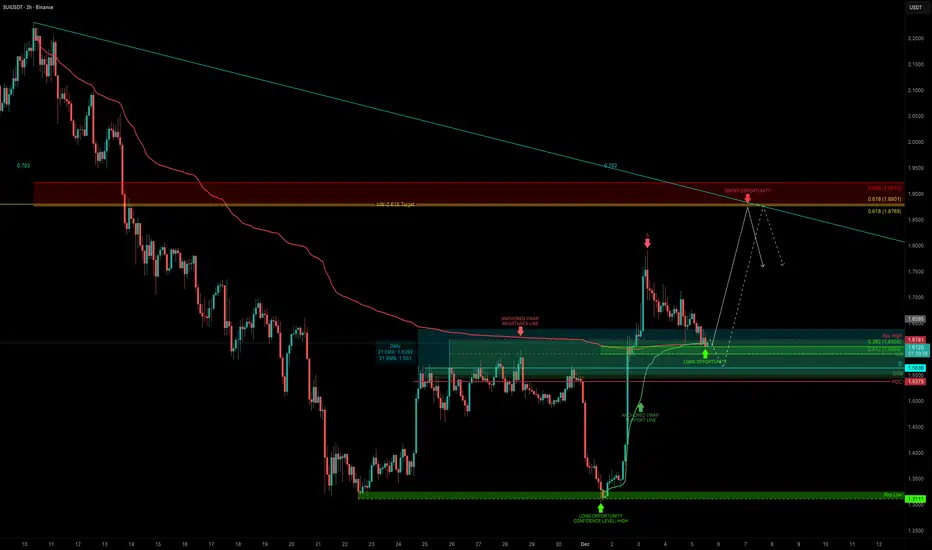
SUI: The Power of ConfluenceSUI just delivered one of the cleanest moves. After sweeping the liquidity low at $1.3111, price launched nearly +40% in under two days, ripping through a full 5-wave impulse and breaking market structure. Now that the fast move is done, the real question is:
Where’s the next high-probability setup?
To answer that, we break down the support/resistance zones, VWAP structure, Fibonacci levels, and market cap confluence that are now forming.
1. The Key Support Cluster at $1.60
To map the next setup, we first look for strong support. And right now, $1.60 is loaded with confluence:
Anchored VWAPs from both the swing low ($1.3039) and swing high ($2.231) meet at roughly $1.60
Fibonacci Retracement
The 0.382 retracement of the entire impulse sits exactly at $1.60. After fast moves, holding the 0.382 is typically what you want to see for bullish continuation.
Dynamic EMAs & SMAs: Daily 21 EMA → $1.64, Daily 21 SMA → $1.55.
These are dynamic tools, so they shift over time, but both are already closing in on the same zone.
Daily level at $1.5636
POC of the previous range at $1.5375.
Both overlap with the daily order block, adding confidence.
Monthly Anchored VWAP.
Currently around $1.5782, giving this area even more weight.
Market Cap Confluence
$1.60 ≈ 6B market cap
$1.87 ≈ 7B market cap
I like using market caps as macro support/resistance, and these levels line up beautifully. All in all, $1.55–$1.60 is shaping up as the main demand zone.
2. Upside Target → the 0.618 Fib
Using the retracement from the downward move
($2.231 → $1.3039), the 0.618 Fib sits at $1.8768.
This also lines up with the 7B market cap and previous resistance structure.
That makes it the main target for the next leg up.
3. Risk Management
An entry between $1.60-$1.55 with an SL below the POC / order block allows for:
R:R between 1:4 and 1:6 (depending on how you ladder)
Clear invalidation
Strong structural backing
Multiple layers of confluence
Summary
SUI swept a major low, completed a sharp impulse, and broke market structure. Now it’s retracing into what looks like a high-confluence long zone around $1.55–$1.60. If this support zone holds, the next target is $1.87, giving a clean and logical long setup with solid R:R.
🔍 Indicators used
Multi Timeframe 8x MA Support Resistance Zones → to identify support and resistance zones such as the daily 21 EMA/SMA.
➡️ Available for free. You can find it on my profile under “Scripts” and apply it directly to your charts for extra confluence when planning your trades.
_________________________________
💬 If you found this helpful, drop a like and comment!
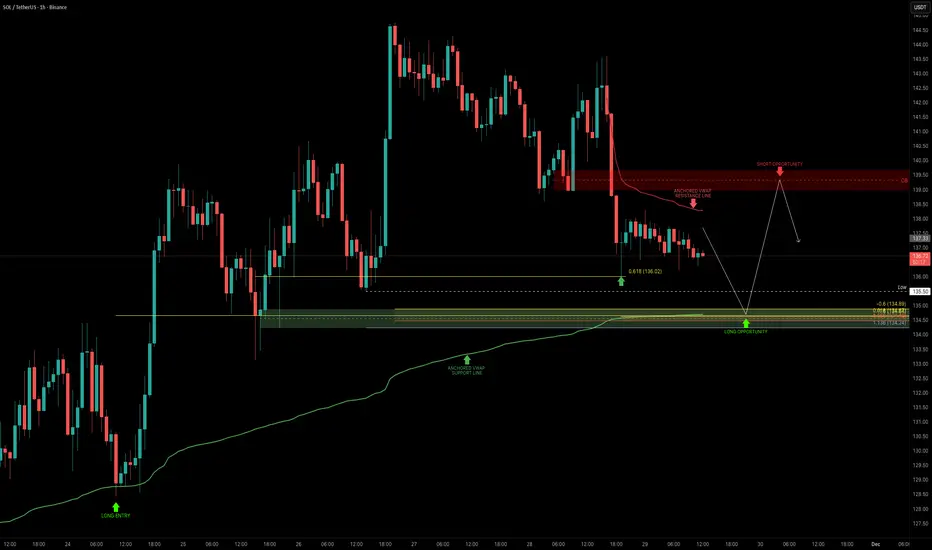
SOL — Fibonacci & Anchored VWAP ConfluenceSOL continues to be one of the most technically reliable assets, consistently respecting Fibonacci levels and key market structures. The zone between $135–$134 stands out as the next high-probability long opportunity, with multiple Fibonacci clusters lining up with the anchored VWAP from the swing low. The $134 level also aligns with the 75B market cap, adding an additional layer of confluence.
I’m looking for a long setup in this zone, targeting the $139–$140 order block for TP. This gives a clean 1:3 R:R, with the stop placed just below $133.
I’m currently developing a dynamic confluence indicator that highlights stacked support and resistance zones with high-probability reversal zones. The $139–$140 zone is currently showing a cluster of resistance, reinforcing it as the ideal TP target.
_________________________________
💬 If you found this helpful, drop a like and comment!
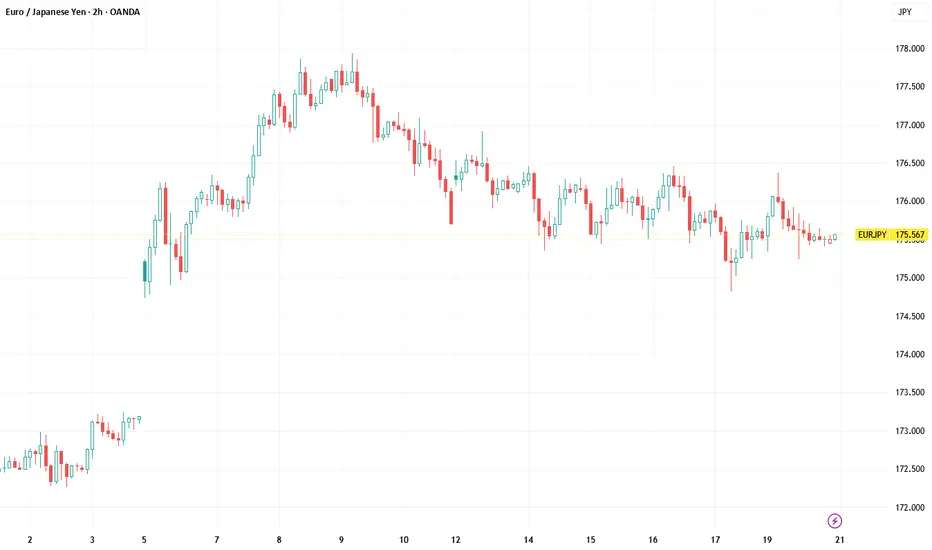
EURJPY ANALYSISAfter seeing the previous daily candle close bearish as a LH area for the 4hr structure we could expect price to continue lower into 176.250 area of support or into the moving average area on the daily timeframe..

EURJPY ANALYSIS AND CONFLUENCE After seeing the daily candle close as a doji above 177.500 we could confirm that the market is still very bullish and we could be expecting a new leg to the upside seeing that the 4hr retested the moving average and formed a short term resistance that we are looking for a break above before going long.....
PS. From the previous video i do apologize for the misleading because the analysis said short when it should have been long

EURJPY WEEKLY CONFLUENCEAfter seeing the previous week spike down into 178.750 key level and a sharp rejection from there , the daily also showing signs of bearish power we could see this pair push down for a few more pips especially with the 4hr structure making LL and LH and the price trading below the moving average

Fibonacci Beyond the ObviousFibonacci Beyond the Obvious
The Professional Approach — WerkTrader Edition 🎯
1️⃣ Introduction – More Than Just a Sequence
Fibonacci is not magic, myth, or a decorative tool for colorful charts.
It is a mathematical ratio that appears in nature, architecture, music – and yes, in markets.
If you only know Fibonacci as the 61.8 retracement, you understand the concept,
but not the depth.
A true analyst doesn’t use Fibonacci to draw lines –
he uses it to measure structure,
to see where the market stands in relation to itself.
2️⃣ The Principle of Self-Similarity
Markets are fractal.
They move in repeating proportions, regardless of timeframe.
A 38.2 pullback on the 15-minute chart can have the same character
as a 61.8 retracement on the daily.
Professionals call this Fractal Alignment –
multiple timeframes reacting to the same ratio,
and that’s exactly where the decisive moves occur.
3️⃣ Fibonacci Timing – The Invisible Factor
Most traders measure price, not time.
But Fibonacci also works horizontally.
13, 21, 34, 55 – not as price levels,
but as candle intervals between significant highs and lows.
These Fibonacci Time Projections reveal
when market cycles overlap –
often the moment before price reacts to a known zone.
Institutional models use this quietly,
while retail traders almost always overlook it.
4️⃣ Fibonacci in Orderflow
Fibonacci zones are not magical support lines –
they are points of liquidity interaction.
At 61.8 %, three groups often collide:
1️⃣ Retail shorts fading the retracement,
2️⃣ Smart-money algorithms collecting liquidity,
3️⃣ Position builders using the pullback for entry.
Fibonacci is not a signal – it’s a trigger area,
a place where energy releases.
5️⃣ Asymmetry and Precision
The famous ratio φ ≈ 1.618 is mathematically perfect,
but markets are not.
A professional observes the deviation from the ideal –
often just 1–2 %.
Those small over- or undershoots reveal who dominates:
reaction or manipulation.
This is called Fibonacci Deviation Bias –
a subtle detail that shows whether a zone was merely tested
or truly broken.
6️⃣ Cluster Theory – The Art of Overlap
A single level is coincidence.
But when multiple retracements or extensions
align within the same price area,
a cluster is formed.
This overlap of different swings is called Confluence.
The more Fibonacci relationships converge,
the stronger the reaction.
A professional doesn’t look for the “perfect number” –
he looks for the connection of proportions.
Mathematics confirms itself where ratios intersect.
7️⃣ Fibonacci & Harmonic Patterns – Geometry of Confirmation
Harmonic patterns are the advanced geometry of Fibonacci relationships.
They consist of several precisely measured retracements and extensions,
forming a geometric reversal structure –
like the Gartley, Bat, Butterfly, or Crab.
Each one is built on the same base ratios:
XA → AB = 61.8 %,
BC = 38.2–88.6 %,
CD = 127–161.8 %.
When these measurements meet at a single point,
they create the PRZ (Potential Reversal Zone) –
the mathematical intersection between order and chaos.
The more Fibonacci connections overlap,
the stronger the confirmation.
That’s not coincidence – that’s confluence in its purest form.
8️⃣ Fibonacci as a Language
Fibonacci is not a strategy – it’s a language of proportion.
It doesn’t tell you where to buy,
it tells you where to listen.
The market doesn’t speak in words,
it speaks in ratios.
Those who understand them see structure
where others see only lines.
9️⃣ Conclusion – The Silence of Numbers
Fibonacci is not a myth.
It is the quietest form of truth in the market.
Numbers themselves do not speak –
but they show you where the market reacts,
where mathematics meets psychology,
and where patience becomes power.
Fewer lines.
More meaning.
This is Fibonacci – beyond the obvious.
WerkTrader 🎯

EURJPY Long We stack confluence and exercise patients.
OANDA:EURJPY
Fundamental: Bullish (5/5) — supportive Euro with persistently soft yen; carry friendly.
Technical: Bullish (6/7) — Actionable — 3 EMA bull, RSI > 50, MACD > 0; ADX 22.92 confirms trend. Stop 1.5215 | TP 3.9560.
20-word view: Fundamentals and technicals align higher with rising trend strength. Favor pullback longs toward EMA cluster while ADX stays firm and positive DI leads.
SOL — From Panic to PrecisionLast week, we witnessed a sharp, market-wide crash, a chain reaction of liquidations that flushed out overleveraged long positions. While many altcoins saw 60–90% drawdowns, the majors held relatively firm.
Among them, SOL stood out as one of the most technically precise. Price perfectly tapped the 1.1 trend-based Fib extension, in confluence with the yearly level, the 21 monthly SMA and the 0.666 retracement, providing a high probability long setup.
After that bounce, SOL revisited the lows, approaching the yearly level near $170, which remains the key structural support for maintaining bullish momentum. The support zone between $175–$170 aligns with the 21 EMA/SMA on the monthly timeframe, which currently spans $158–$170 → forming a strong macro confluence cluster that’s critical to hold.
From there, price unfolded into a clean 5-wave impulsive structure, topping within a dense resistance zone between $208–$212, reinforced by:
mOpen at $208.68
21 EMA/SMA (Daily TF) between $211–$212
0.618 Fibonacci retracement at $211.43
This area offered the perfect low-risk short entry.
Currently, SOL appears to be forming an ABC corrective pattern, likely targeting a move back into the $190–$185 range to fill imbalances and complete wave C. As another key element, the yearly open at $189.31 sits mid-range between resistance and support → a critical pivot level. That’s the region I’ll be monitoring for long setups.
🔍 Indicators used
DriftLine — Pivot Open Zones → For identifying key yearly/monthly/weekly/daily opens that act as major S/R reference points
Multi Timeframe 8x MA Support Resistance Zones → to identify support and resistance zones such as the monthly 21 EMA/SMA.
➡️ Available for free. You can find it on my profile under “Scripts” and apply it directly to your charts for extra confluence when planning your trades.
_________________________________
💬 If you found this helpful, drop a like and comment!

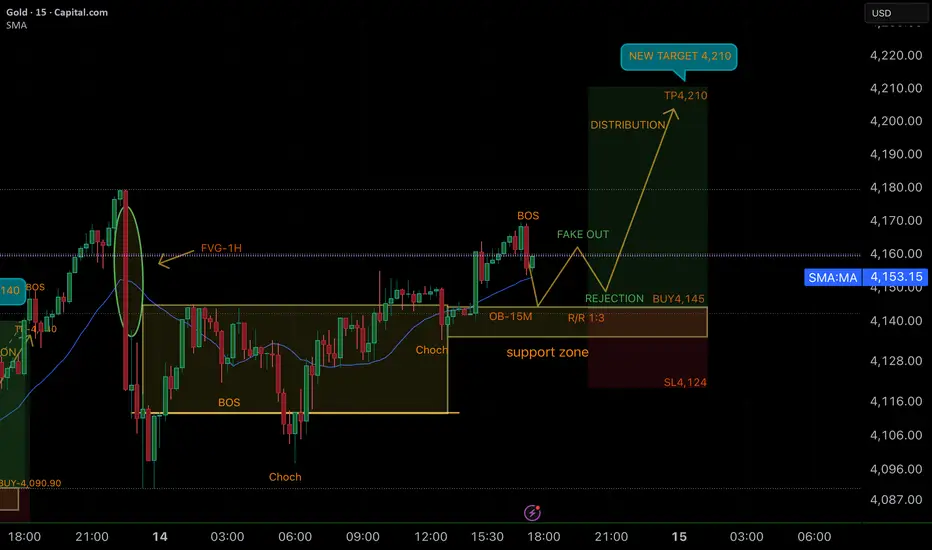
SMART MONEY CONCEPT (SMC)📊 Market Breakdown
1. Accumulation Phase:
Price consolidated and built liquidity inside a clear range, with multiple ChoCh signals showing the transition of market interest.
2. BOS (Break of Structure) as Confirmation:
You are waiting for the BOS to confirm bullish continuation. This step is crucial—it avoids premature entries and aligns with institutional flow.
3. OB-15M (Order Block):
The 15M Order Block remains the key demand zone. This is where liquidity is absorbed and where the entry setup will form.
4. Fake Out + Rejection:
After the BOS confirmation, you’re planning to enter on the rejection after the fake out. This ensures entry at the point of maximum efficiency.
5. Target & R/R:
• Entry Zone: 4,145 (upon rejection confirmation)
• Stop Loss: 4,124 (below support zone)
• Take Profit: 4,210
• Risk-to-Reward: 1:3 → excellent institutional setup.
🌟 Motivational Note
“Confirmation is the trader’s edge. 📊
We don’t jump in on emotions—we wait for the BOS, let the market reveal its hand, and only then execute with precision. 🎯
Patience + discipline = consistency. 🚀🔥”
GOOD LUCK TRADERS ;)
USDJPY Long with 5 stacks fundamental and 6 stacks TechnicalFX:USDJPY @ 152.33
We trade with confluence stacks. This trade offer 5 stacks of fundamental confluence and 6 stacks of technical confluence. The point is that we only trade when all the stars line up for a perfect trade. There really is no such thing as a perfect trade as news flows an can change on a time. But right now we have monster tailwinds behind us and thats why USDJPY in a long trade for us. SL 150.30 Take Profit 157.70

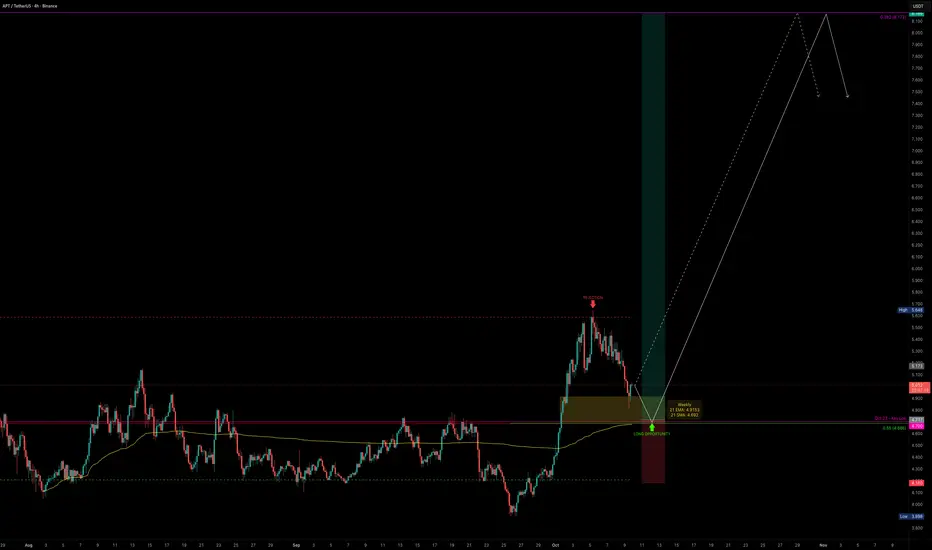
APT — 248 Days of Consolidation, Breakout PotentialAPT has been trading sideways for the past 248 days, building a massive base of consolidation. Things are starting to get interesting.
Recently, APT made its first real attempt to break above the yearly VWAP core (~$5.6) but got rejected, completing a 5-wave impulse right at this resistance zone. The rejection was no surprise: it lined up perfectly with the VAH of the 248-day trading range and the 4B market cap resistance at $5.69.
Now, after a strong impulse, we are in correction mode and this could set up the next major swing long opportunity.
🟢 Support Confluence Zone ($5.0–$4.5)
POC of 248-day range: $4.685
Anchored VWAP (from Aug low): sits right at the POC
Key Low (Oct 2023): $4.70
0.55 Fib retracement (of 5-wave impulse): $4.686
21 Daily EMA/SMA: $4.847 / $4.7
21 Weekly EMA/SMA: $4.915 / $4.69
200 4H EMA/SMA: $4.7 / $4.582
All confluences point to this being a critical support zone that bulls must defend.
🔴 Resistance Zone ($5.6–$5.7)
Yearly VWAP core (~$5.6)
VAH of 248-day range (~$5.6)
4B Market Cap resistance (~$5.69)
This zone remains the big wall to break. Once cleared with strong volume, upside potential opens significantly.
Freshly built (unpublished) Anchored VWAP Suite , which provides VWAP tracking:
Fair Value Trend Model :
Trade Setup
Long Entry: Ladder between $5.0–$4.5
Invalidation: Below VAL of range
Targets: $5.7 (major resistance), $7 (Fair Value), $8.172 (0.382 Fib)
Potential swing setup with R:R of 1:6+
Possible gain of +70% if structure holds and volume confirms breakout
Quick Take
APT is sitting at one of the most important support zones of the year. If this base holds, it sets up a high-probability swing long with great upside potential. All eyes are on whether bulls can reclaim momentum and finally break through the $5.7 wall.
🔍 Indicators used
Multi Timeframe 8x MA Support Resistance Zones → to identify support and resistance zones such as the weekly 21 EMA/SMA.
Fair Value Trend Model → Calculates a regression-based fair value curve
➡️ Available for free. You can find it on my profile under “Scripts” and apply it directly to your charts for extra confluence when planning your trades.
_________________________________
💬 If you found this helpful, drop a like and comment!
SUI — Critical $3 ZoneSince completing its 5-wave impulse on July 28, SUI has been in a corrective phase for the past two months. The structure remains clean, with invalidation zones well-defined.
Looking ahead, there’s potential for an ascending triangle formation but for that to play out, it’s crucial that SUI holds the $3 psychological level.
Support Zone ($3.11–$2.93)
0.618 Fib retracement: $3.115
0.702 Fib retracement: $2.934
60 Weekly EMA $2.93 / SMA $3.036
Potential ascending triangle lower support line
📌 This is the last key support zone for bullish momentum. Losing it would break structure, holding it keeps the bullish case alive.
Resistance Zone ($4.12–$4.59)
Yearly Open (yOpen): $4.122 → key level bulls must reclaim
Swing Highs: $4–$4.5
0.786 Fib retracement: $4.59
15B Market Cap: $4.2
This area is loaded with resistance confluence and will act as the major target zone for longs.
🟢 Long Setup
Entry Zone: Between current price and $2.9 → ladder down into support
Stop-Loss: Below 0.702 Fib retracement
Take Profits: TP1 → $3.49, TP2 → $3.89, TP3 → $4.12 (yOpen)
R:R: ~1:4+
Potential Gain: +35%
This is a make-or-break zone for SUI. The $3 level is stacked with support confluences and must hold to keep the bullish structure intact. If bulls reclaim the yearly open at $4.122, momentum could carry toward $4.6.
🔍 Indicators used
DriftLine — Pivot Open Zones → For identifying key yearly/monthly/weekly/daily opens that act as major S/R reference points
Multi Timeframe 8x MA Support Resistance Zones → to identify support and resistance zones such as the weekly 60 EMA/SMA.
Fair Value Trend Model → Calculates a regression-based fair value curve
➡️ Available for free. You can find it on my profile under “Scripts” and apply it directly to your charts for extra confluence when planning your trades.
_________________________________
💬 If you found this helpful, drop a like and comment!

BTC — Sunday Liquidity TrapAfter hitting the BIG resistance at $117,896 (0.618 Fib retracement), BTC rejected as anticipated and started its current downtrend. The anchored VWAP from the $117.9K high has been an excellent guide, acting as resistance → most recently at $113,800, where it provided a clean short entry.
Over the weekend, BTC has traded sideways. We just saw a small pump to clear the range highs and take out buy-side liquidity, a common setup before markets rotate lower to sweep sell-side liquidity.
Key Confluence Zone
The next level of interest sits around $108,250, where multiple factors align:
Monthly Open: $108,246.36
Daily Level: $108,246.35
0.618 Fib Retracement: $108,236.67
Liquidity cluster with many stop-losses residing here
If this zone fails to hold, the next downside interest lies at:
Key Low: $107,255 → possible SFP area
0.666 Fib Retracement: $106,975.52 → additional support
🟢 Long Trade Setup
Entry: Long around $108,250 (mOpen confluence zone)
Stop-Loss: Below 0.666 Fib retracement (~$106,975)
Take Profit: TP1 → $111K, if volume expands → trail stop for higher targets
R:R: ~1:2
Market Insight
Sunday pumps are notoriously unreliable, often designed to trap traders into late longs before a pullback wipes them out. This setup reflects exactly that dynamic.
Indicators used
DriftLine — Pivot Open Zones → For identifying key yearly/monthly/weekly/daily opens that act as major S/R reference points
➡️ Available for free. You can find it on my profile under “Scripts” and apply it directly to your charts for extra confluence when planning your trades.
_________________________________
💬 If you found this helpful, drop a like and comment!

LINK — Massive $20 Support Zone, Wave 5 Loading?I haven’t seen this much confluence stack in one place for LINK in a long time. The $20–$19 zone is absolutely packed with technical factors, making it a critical level to hold for bullish continuation.
🧩 Confluence at $20–$19
Golden Pocket: $20.19 (0.618) → $19.59 (0.666)
Yearly VWAP: $18.87
21 Weekly EMA/SMA: $19.68 / $18.39
Yearly Open: $20.02
0.666 Fib Speed Fan: aligned with $20 zone
1.0 Trend-Based Fib Extension: at $20 → completion of wave 4
Pitchfork Buy Zone: 0.702–0.75 levels right at $20
Midpoint of 1-Year Trading Range
Anchored VWAP (from $30.94 high, 287 days): $19.55
Daily Level: $19.66
Weekly Level: $19.28
Monthly Level: $19.27
Yearly Level: $19.51
🟢 Long Setup
We’ve already seen a bounce from $20, confirming demand at this zone.
Plan: Buy now and add on retracements if price dips back toward $20/$19.
Stop-Loss: Below 21 SMA weekly at $18.39
TP1 → $30 psychological resistance & prior key high
TP2 → $34.57 (0.618 Fib retracement)
This setup offers an R:R of 1:7+ with a possible yield of +70% if played toward TP2.
Structure Outlook
With this stacked confluence, it looks like wave 4 has completed and LINK could be ready for its next leg up. The $20 zone is make-or-break, and as long as it holds, the case for bullish continuation remains strong.
Indicators used
DriftLine — Pivot Open Zones → For identifying key yearly/monthly/weekly/daily opens that act as major S/R reference points
Multi Timeframe 8x MA Support Resistance Zones → to identify support and resistance zones such as the Weekly 21 EMA/SMA.
➡️ Available for free. You can find it on my profile under “Scripts” and apply it directly to your charts for extra confluence when planning your trades.
_________________________________
💬 If you found this helpful, drop a like and comment!

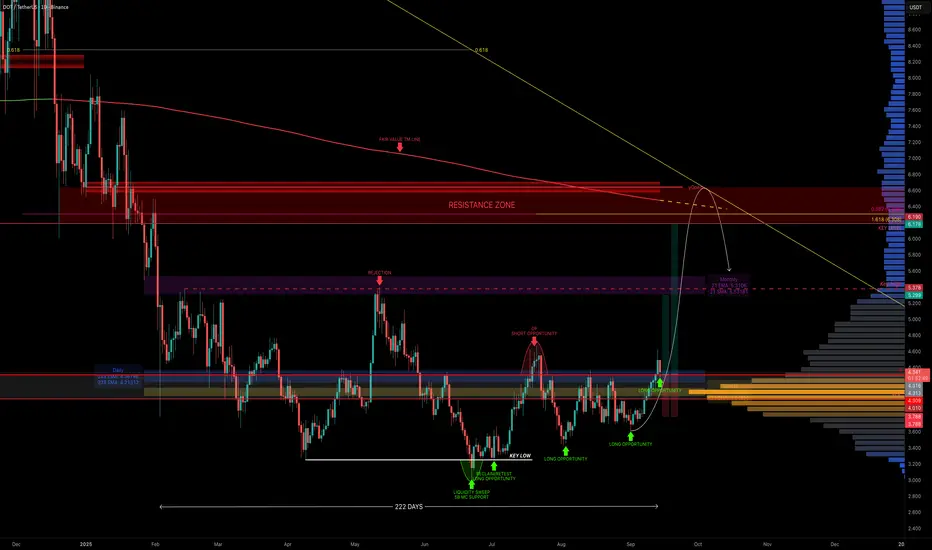
DOT — Key Levels Reclaimed, Breakout Ahead?DOT has been in sideways chop for 222 days, but things are finally getting interesting. Price is now sitting above the yearly level ($4.309), the daily 233 EMA/SMA, and the weekly 21 EMA/SMA. Even better, it reclaimed the POC of the entire 222-day range.
Why $4 Is So Important
Yearly level → $4.309
Daily 233 EMA → $4.37 / Daily 233 SMA → $4.21
Weekly 21 EMA → $4.15 / Weekly 21 SMA → $4.05
POC of 222-day range → $4
0.618 Fib retracement (current move) → $4
That’s a whole lot of support stacked at one zone.
Where It Gets Exciting (Targets)
First major target is the monthly 21 EMA/SMA ($5.3–$5.5), which also lines up with the range highs. That’s the first real test. The swing target zone sits around $6–$6.5, with multiple layers of confluence:
Key Level → ~$6
Fair Value Trend Model Line → ~$6.5
0.382 Fib retracement of the downtrend → ~$6.19
0.618 Fib speed fan → ~$6.2 (October projection)
1.618 trend-based Fib extension → $6.308
Market Cap Confluence: 10B market cap at $6.18
Yearly Open: $6.642 → the overall target and an additional layer of resistance
📌 This creates a solid resistance cluster between $6–$6.6, ideal for taking profits and potentially looking for shorts.
🟢 Long Trade Idea
Entry: Ladder longs from $4.36 down to $4
Stop: Below $4 (clear invalidation)
Take Profit: If $4 holds, DOT’s path is clear: first stop $5.3-$5.5, then $6.0–$6.6 as the macro target with the yearly open at $6.642 marking the final resistance.
Key Levels
Support → $4.36–$4
Resistance → $5.3–$5.5, then $6.2–$6.6 (10B market cap $6.18 + yearly open $6.642)
🔍 Indicators used
LuxAlgo — Liquidity Sentiment Profile (Auto-Anchored)
DriftLine — Pivot Open Zones → For identifying key yearly/monthly/weekly/daily opens that act as major S/R reference points
Multi Timeframe 8x MA Support Resistance Zones → to identify support and resistance zones such as the monthly 21 EMA/SMA.
Fair Value Trend Model → Calculates a regression-based fair value curve
➡️ Available for free. You can find it on my profile under “Scripts” and apply it directly to your charts for extra confluence when planning your trades.
_________________________________
💬 If you found this helpful, drop a like and comment!
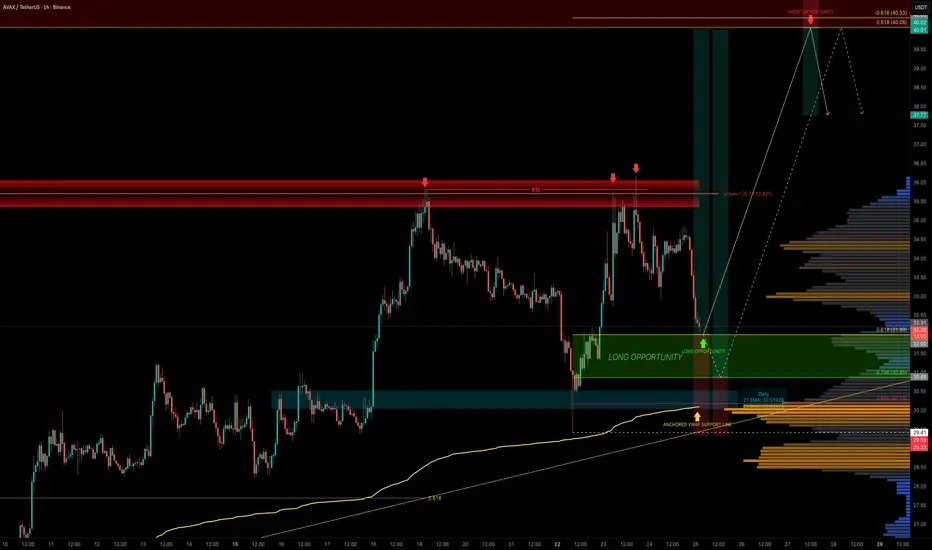
AVAX — Next Stop $40?AVAX has been one of the stronger high-cap performers recently, but the yearly open at $36 has proven to be a tough ceiling. Price has rejected this level three times already, each time offering short opportunities. This level also aligns with the 15B market cap, making it a key resistance zone.
Now, AVAX is retracing into a prime area for long setups, retracing part of the recent 5-wave impulse.
🟢 Long Entry Zone
0.618 Fib retracement: $32 → first bounce zone
0.786 Fib retracement: $30.85 → deeper entry opportunity
0.886 Fib retracement: $30 → highest confluence long entry
Invalidation: Below $29.41 (origin of the impulse)
Confluence at $30
The $30 level is the strongest support cluster, backed by multiple technical factors:
POC of this trading range
0.886 Fib retracement of the impulse
21 EMA/SMA (daily timeframe)
Anchored VWAP support
$30 psychological round number
0.618 Fib speed fan support
This makes laddering entries from $32 down to $30 the most optimal approach.
Targets
First Target: $36 yearly open → retest of major resistance (fourth attempt)
Main Target: $40 resistance cluster → 0.618 Fib retracement, negative -0.618 Fib extension
R:R: 1:3 up to 1:6 depending on entry
Educational Insight
When analysing trades, confluence is king. A single indicator may provide a signal, but when multiple tools align at the same level the probability of that zone holding increases significantly.
The $30 zone for AVAX is a great example of confluence stacking. This doesn’t guarantee success, but it gives traders a defined edge with a clear invalidation point. The same logic applies to resistance: at $40, multiple technical layers align, making it a high-probability take-profit zone.
Quick Take
AVAX is pulling back into a stacked support zone. With solid confluence at $30–$32, this zone sets up the fourth attempt at breaking the $36 yearly open resistance.
And as the saying goes in trading: the 4th touch often breaks. If it does, AVAX could quickly rally toward the $40 resistance cluster, where multiple confluences align.
Indicators used
DriftLine — Pivot Open Zones → For identifying key yearly/monthly/weekly/daily opens that act as major S/R reference points
Multi Timeframe 8x MA Support Resistance Zones → to identify support and resistance zones such as the Daily 21 EMA/SMA.
LuxAlgo — Liquidity Sentiment Profile (Auto-Anchored)
➡️ Available for free. You can find it on my profile under “Scripts” and apply it directly to your charts for extra confluence when planning your trades.
_________________________________
💬 If you found this helpful, drop a like and comment!
AVAX — 220-Day Range Broken, Next Stop $35?After 220 days of consolidation, AVAX has finally broken out of its trading range. The key resistance at $27 was cleared, and price quickly pushed into the $30 psychological level, where it faced rejection. Currently, AVAX is consolidating just below, around $29.
So, what’s next? Now all eyes are on the retest to confirm $27 as the new launchpad.
Support Confluence (Long Entry Zone)
3M/Quarterly level: $27.71 → major support
0.382 Fib retracement: $27.65 (low $23.87 → $30)
0.5 Fib retracement: $26.93 → perfectly aligned with $27 zone
Swing High: $27.38 → could be retested
4H 21 EMA: $27.71
4H 21 SMA: $27.41
Weekly VWAP: $27.41
Fair Value Gap (FVG): imbalances in this zone
📌 With all these layers of confluence, the $27.7–$27.4 zone is the ideal long entry area.
Resistance Confluence (Take Profit Zone)
0.5 Fib retracement of the entire downtrend: $35.22
15B Market Cap resistance: $35.5
Yearly Open: $35.7 → major target
3M/Quarterly level: $35.71
TPO resistance cluster: $35.22–$37.28
📌 Together, these levels form a stacked resistance zone at $35–$37, making it both the ideal take-profit area and a potential short setup.
Zoomed-Out View:
TPO Chart Reference:
🟢 Long Trade Setup
Entry Zone: $28.0 → $27.4 (DCA best approach)
Stop-Loss: Below $26 (to be adjusted after reversal confirmation)
Take Profit: $35
Potential Gain: +25%
R:R: 1:4+
Technical Insight
After 220 days of sideways compression, the breakout above $27 marks a shift in market structure.
A retest of this level would validate it as new support and provide a high-probability swing long setup.
The $35–$37 zone, reinforced by the yearly open at $35.7, stands out as the major resistance cluster, making it both the ideal profit target and a potential reversal area.
Key Levels to Watch
Support Zone: $28–$27
Resistance Zone: $35–$37
🔍 Indicators used
DriftLine — Pivot Open Zones → For identifying key yearly/monthly/weekly/daily opens that act as major S/R reference points
Multi Timeframe 8x MA Support Resistance Zones → to identify support and resistance zones such as the 4H 21 EMA/SMA.
➡️ Available for free. You can find it on my profile under “Scripts” and apply it directly to your charts for extra confluence when planning your trades.
_________________________________
💬 If you found this helpful, drop a like and comment!

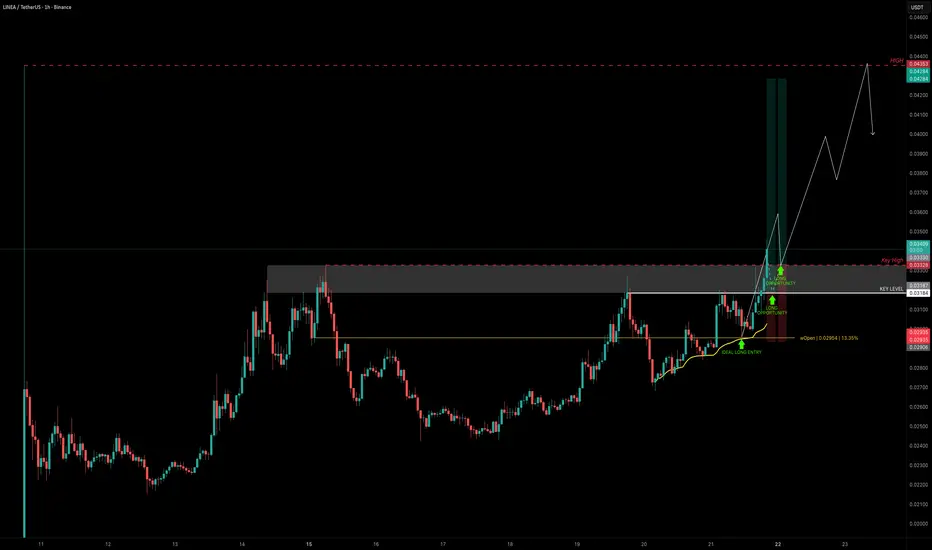
LINEA — $0.033 Key Break Could Unlock Big UpsideLINEA is starting to look interesting. Currently trading around $0.032 (~500M market cap), this level acts as resistance that needs to be broken for bullish continuation.
Earlier today, we already had a clean long setup from $0.03 support, in confluence with the weekly open ($0.02954) and anchored VWAP (yellow line), which held and gave a solid bounce.
Next Long Setup Idea
Entry 1: Watch for a breakout above the key high at $0.03328, then retest for confirmation.
Entry 2: Alternatively, a hold above $0.032 could offer a safer re-entry.
Stop-Loss: Below $0.03 support for now.
Targets
TP1: $0.036
TP2: $0.04
TP3: $0.043
Final Target: $0.065 (aligns with 1B market cap resistance)
This setup could yield:
+30% gain if exited around $0.043
+100% potential if momentum drives price into the $0.065 zone
Quick Take
A breakout and retest of $0.03328 would open the path toward the $0.036–$0.043 zone. If momentum continues, the 1B market cap resistance at $0.065 becomes a realistic macro target.
🔍 Indicators used
DriftLine — Pivot Open Zones → For identifying key yearly/monthly/weekly/daily opens that act as major S/R reference points
➡️ Available for free. You can find it on my profile under “Scripts” and apply it directly to your charts for extra confluence when planning your trades.
_________________________________
💬 If you found this helpful, drop a like and comment!
AEVO — 230 Days of Accumulation, Breakout AheadAEVO has been consolidating for the past 230 days in what looks like a Wyckoff accumulation between the 100M–150M market cap range. AEVO is now on the verge of breaking its long-term bear trend.
🟢 Long Setup Idea
Entry Zone: $0.13–$0.12
Stop-Loss: Below $0.11
Target: ~$0.35
Key Resistance Levels
Yearly Dynamic VWAP → $0.1384 → current resistance / key S/R zone
Anchored VWAP (Dec 7, 2024 high at $0.6549) → ~$0.17 → key resistance in confluence with the key highs → A clean break above this = bullish
150M Market Cap → $0.164 → major breakout level
Once cleared, significant upside potential opens up.
Higher Timeframe Targets
$0.35 Zone → Primary long target (POC of the 2024 trading range, yearly Open at $0.3614, 0.5 Fib retracement of the downtrend at $0.359)
$0.43 Zone → 0.618 Fib retracement of the downtrend, in confluence with the 400M market cap
$0.50 Zone → Anchored VWAP resistance + psychological level
$0.53 Zone → 0.786 Fib retracement
$0.55 Zone → 500M market cap resistance
Key Levels
Support → $0.12–$0.13
Resistance → $0.1606–$0.17 → $0.35 → $0.43–$0.55
🔍 Indicators used
DriftLine — Pivot Open Zones → For identifying key yearly/monthly/weekly/daily opens that act as major S/R reference points
➡️ Available for free. You can find it on my profile under “Scripts” and apply it directly to your charts for extra confluence when planning your trades.
_________________________________
💬 If you found this helpful, drop a like and comment!

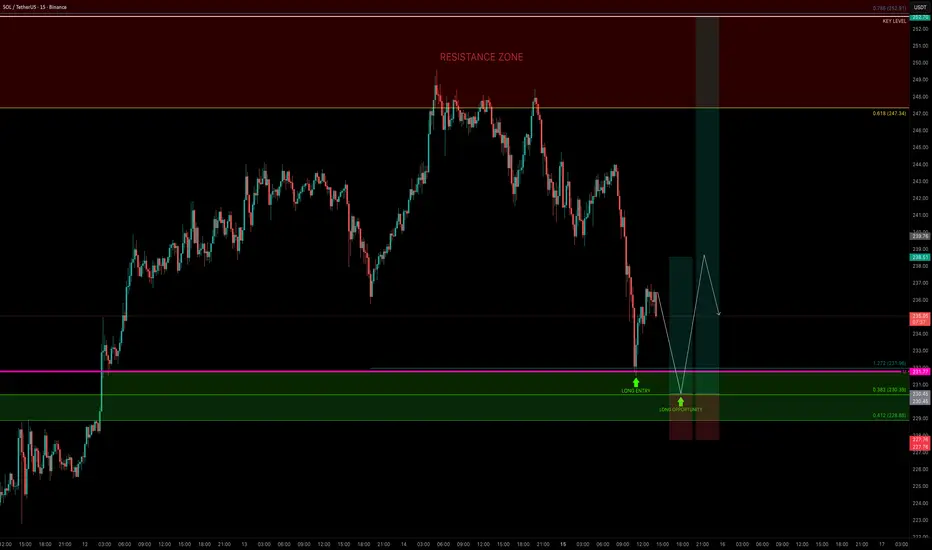
SOL — Bulls Need to Defend $230 for ContinuationSOL had a strong bullish week, almost tapping the $250 psychological level before rejecting down into the monthly level at $231.77, where price found support and bounced. This level also aligned with the 1.272 Fib extension ($231.96), making it a valid long opportunity.
🟢 Next Long Opportunity
The 0.382 Fib retracement ($230.39) of the move from the $199.32 low is the next key level to watch.
A retest here would:
Sweep liquidity from the current low
Offer a low-risk entry
Help fill some imbalances
📌 Overall, $230 is the level that must hold for bullish continuation.
Targets
TP1: $238 → R:R ~1:3
TP2: $252.91 (0.786 Fib retracement) → R:R ~1:8+ if momentum continues
Risk Management
Stop-Loss: Below $229 (clear invalidation)
Risk: Only 1% on this trade setup
Quick Take
If $230 holds, SOL could set up for another leg higher. This zone offers a clean, low-risk, high-reward long setup with clearly defined invalidation and attractive targets.
DRIFT — No More Drifting, Breakout ImminentDRIFT has been trading sideways in a 226-day range, capped by resistance at $0.75. The POC of this entire range sits at $0.6, and price is currently trading above it at $0.62.
Volume spikes within the range show solid participation, and the structure is starting to resemble a Head & Shoulders formation with a neckline at $0.75 that needs to break.
Bullish Confluence (Support Zone)
Trading above:
21 Daily EMA ($0.593) / SMA ($0.592)
21 Weekly EMA ($0.577) / SMA ($0.549)
200 Daily EMA ($0.5828) / SMA ($0.5483)
Monthly Open → $0.5888
0.618 Fib retracement of current move → $0.5987 (long trigger)
Clear invalidation: below weekly 21 SMA ($0.549) / daily 200 SMA ($0.5483)
Resistance Confluence (Target Zone $1.3–$1.38)
nPOC of the end 2024 / early 2025 trading range → $1.3
0.786 Fib retracement → $1.2935
0.382 Fib retracement of entire downtrend → $1.3056
0.618 Fib retracement of smaller wave → $1.3677
Yearly Open → $1.3664
500M Market Cap → $1.38
📌 This creates a resistance cluster between $1.3–$1.38, an ideal take-profit zone and potential short opportunity.
🟢 Long Setup Idea
Entry: $0.62–$0.60 (ladder in near confluence with Fib + support levels)
Stop: Below $0.55 (weekly 21 SMA/ daily 200 SMA invalidation)
Targets:
TP1: $1
TP2: $1.3
Potential Gain: +115%
Quick Take
If $0.75 breaks, DRIFT could move quickly toward $1.3–$1.38, a zone stacked with resistance and confluences, the perfect place to secure profits/look for a short setup.
Key Levels
Support: $0.62–$0.60 (Fib + POC + EMAs)
Resistance: $0.75 neckline, then $1.3–$1.38 (confluence cluster)
🔍 Indicators used
LuxAlgo — Liquidity Sentiment Profile (Auto-Anchored)
DriftLine — Pivot Open Zones → For identifying key yearly/monthly/weekly/daily opens that act as major S/R reference points
Multi Timeframe 8x MA Support Resistance Zones → to identify support and resistance zones such as the weekly 21 EMA/SMA.
Fair Value Trend Model → Calculates a regression-based fair value curve
➡️ Available for free. You can find it on my profile under “Scripts” and apply it directly to your charts for extra confluence when planning your trades.
_________________________________
💬 If you found this helpful, drop a like and comment!
