Worrisome Future - Weekly Internal - AFHHello Fellow Successful Traders,
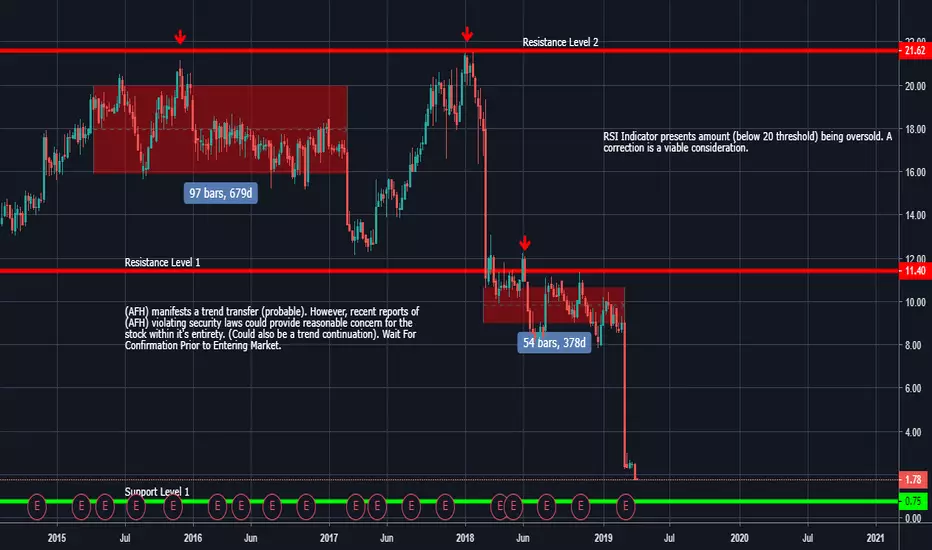
The stock (AFH) appears to be manifesting some alarming (PA) price levels, as we progress further into 2019. There is a probable (positive) swing to the upside within the next few days, but be considerate of volatile markets.
Resistance Level 2 - (21.50 - 21.75) 25 cent interval
Resistance Level 1 - (11.25 - 11.55) 30 cent interval
Key Price Zone - (Entire PA ATM)
Support Level 1 - (0.60 - 0.85) 25 cent interval
Furthermore, the stock itself appears to be immensely volatile indicating a request for greater confirmation prior to entering the market.
Not Investment Advice. For Educational and Analytical Purposes Only. (Be Aware and Stick To Your Trading Plan)***
-LionGate
Consistency
USDCAD to the Earths core?WHATS UP EVERYBODY!
Happy Wednesday traders (:
Heres a fresh markup on USD/CAD. Currently live in this trade and definitely wanted to update my Tradingview family on what Im seeing with this pair.
Hope this helps at least 1 person out! Leave a like and comment if it did!
Also follow me on the GRAM FOR MORE! (:
IG: @issdrake


2 BTC to 20 BTC Trading Challenge - Day 1 (2 BTC)“Maybe this is a game that can be beat.” -Knish in the movie Rounders
I learned how to trade by watching others make decisions in real time. The countless hours of studying theory / different indicators only went so far. As soon as I was ready to implement a strategy I felt like a deer in the headlights.
What helped me more than anything else was watching established traders wrestle with the intricacies that I found so confusing - in real time . Being a Monday morning quarterback is a cakewalk by comparison.
It’s always been very easy for me to look at a chart in hindsight and point to what should have been done and why. However, being able to do that in real time is where the boys become men. Being able to do that in real time while having money on the line is where men become pros.
In this vein I have always done my best to be as thorough with my thought processes as possible while analysing the Bitcoin chart on a daily basis. I have also done my best to be fully transparent with my positions and decision making.
Now I have decided to take it to the next level by starting the 2 BTC to 20 BTC Trading Challenge!
I intend to return 1,000% through trading on margin over the next six months (or less). The reason that I believe that is realistic is because I have done it before and I have done it exclusively trading crypto in the 2018 bear market (March to August).
My motivation for making this challenge public is rather straightforward:
First of all I know that I would not have ever become a profitable trader without getting the luxury of watching others trade in real time. Furthermore, I know that many got completely rekt throughout this bear market and some may be feeling very discouraged at this point.
This challenge is intended to be proof-of-work, not only of my abilities but of Tyler Jenks’ Consensio and of technical analysis as a whole. If I can implement an objective strategy and return 1,000% in less than 6 months then you can do it too!
I share my entire trading strategy and process (completely for free) so there really is nothing stopping you other than yourself. The strategy and process are very objective and therefore very repeatable. Very little discretion is required once one understands Consensio (will take much longer than you expect).
In my experience one of the main factors that holds back new traders is swinging for the fences with every trade. Trying to find that one position that is going to lead to life changing money. That is a loser mentality and it is impossible to consistently win with that thought process.
Focus on batting average, do not focus on hitting home runs. If you are able to patiently grind it out on your leather ass, à la Knish in Rounders, then this might be a game you can beat!
If you are like myself then you are probably thinking something along the lines of:
“this sounds way too good to be true.”
If that is your conclusion then you are mostly right. I do not intend to share this information free of charge after the challenge is complete.
I intend for this to be a jumping off point for a private group and / or website. I am giving this all away to gain a following. Once I do then I will be moving my operation elsewhere and looking for opportunities to capitalize.
So if you are reading this and the challenge is not finished then you are in luck! Take full advantage of this opportunity and commit to learning how to consistently beat every market whether it be bull, bear, flat, parabolic crypto, stocks, commodities or forex!
Starting today I have a 2 BTC bankroll and I am not in any positions. I will make a daily post, or as close to it as I possibly can, to share the results of every single trade in real time. The Bitcoin Daily Update will remain and the Trading Challenge will be little more than a ledger of my positions and results.

A Potential long NZDUSD awaits...Looking for price to retrace bearish until 0.66018 ( 0.5 fib level) before potentially opening up for a bullish continuation. Last week we saw price move very bullish until the 0.66856 zone where price found resistance and looks like its gaining momentum ( retracing) before completing the move at the 0.67779 zone.
Do not rush to enter, always wait for price confirmation a bullish reversal candlestick pattern. If you are more conservative you may wait for price to move bullish then retrace before you enter.
SL - 0.65333 ( At the red line) . I Risk no more than 1% per trade.
Happy Trading!

Possible Trade on GME? What do you guys think?GME broke out of a beautiful symmetrical triangle. I can buy on the break above the upper supply area. However, it has recently been downgraded to a zacks rank of 4 (sell). There is however a possibility of a buy out which would result in significant move to the upside. Also, zacks analysts do not expect GME to meet earnings estimates which is not too far away. I will go long in my paper trading account to learn from such a situation.

Buy ALDR on bullish closeALDR was recently upgraded by zacks to a rank of 2 (buy). ALDR is in the healthcare sector which has been doing well over the past 6 months. It is currently making a nice move up with higher highs and higher lows ( Ascending triangle). There may be a couple more days of consolidation so I will wait for a bullish confirmation with some strong volume to support the move. There is some overhead resistance to look out for ( I have highlighted this are in red ). The risk reward ratio on this trade is gorgeous. Almost 1 to 4 . I will take some profits at 1 to 2 and let it ride the rest of the way while continuously tightening my stop loss.


PAYC steady uptrendVery steady and loyal pattern! this one knows how to make gains, steady and consistency is key. Every now and then your allowed a cheat meal or a drink but the progress is strong on this one this is in it's prime!


NANO XRB (raiblocks) - Takes a Lickin' and Keeps on Tickin'Ok... so this is more about my deep love for Nano then it is about this chart.
I'm still a novice with Elliot Wave projections and/or Elliot Waves in general...
and this is prolly way off from what is to come, but what the heck.
Don't taze me bro!
I think NANO is the Jerry Garcia of cryptos. You can never count it out. Like Jerry who might seem to be having a bad night, but then plays a solo so profound you start crying. You could never count Jerry out. He had a way of rallying on rough nights. And the same goes for nano.
It got it's ass kicked by the Bit Grail hack... but comes on back like it always does.
I got into it on Dec.11 when it was #74 on coinmarketcap, with 100,000,000 market cap, was still called Raiblocks, and for me was $1.06/0.00005999 satoshi.
It has been my best performing alt coin in pure profit. Even more then the litecoin I scored at $80 before it went vertical.
Even today, after it's struggles... the $200 of btc profit I threw at it is worth $2,716. No other coin I hodl has performed as well or as fast.
I discovered it during a coin market cap bloodbath day, where everything was in the red and many coins bleeding percentages over 20%.
All of them!
And there was Raiblocks, all in the green, up 28%, and with an extremely steady diagonal 7 day growth line,
and showing nowhere near the volatility that you could see in all the other 7 day windows.
So I checked it out, and was impressed by the tech and the community, At the time there was like ZERO youtube shilling on it.
It was the great unknown sleeper.
Between Dec. 12 and Jan. 6th... it moon shot up to $36.00... over 30x gain for me. It climbed up to #22 on coin market cap,
with a Market Cap of over 3 Billion.
When it calmed down, it was holding pretty steady around $20 when the the whole market tanked.
And then to top it off, the Bit Grail fiasco knocked it down to approx $8 bucks.
But since then it has regained some momentum, hanging out around $15 to $16... and I expect it to continue to climb.
When it goes down... I just know it will come back up... usually sooner then later.
I could go on about the tech... but you can find that many other places now. I just wanted to give a shout out to a coin I truly believe in.
I actually LOVE this coin, and it remains my fave of them all.
If you've never really looked into it, or thought it was a Pump 'n Dump or whatever... give it a thorough vetting.
I think it's still a bargain at $15. One of the things I like... it's circulating supply is the TOTAL supply. 133,248,289.
That's all there is, and all there ever will be. It has more room to stretch then all those coins like Cardano or Tron with 25 or 65 BILLION already in circulation and more waiting in the shoot!
Thanks for reading all this if you did. Again... not sure about my chart... but I DID want to share my love for raiblocks/NANO.
Cheers!

Top 3 Most Consistent CoinsDuring the past couple of month, the crypto market has been going through two major phases.
The first phase, that took place during December 2017, was a strong uptrend amongst most coins, substantial growth, and almost a non-stop rise.
The second phase, that took place During January 2017, was a consolidation phase, where most coins have been correcting down strongly or consolidating.
But there are coins with a better performance, that have shown great stability and consistency during both phases. While most coins were suffering they proved to be the most stable in comparison to the rest cryptocurrencies.
And the winners are:
0X
EOS
NEO

AUD/USD POSSIBLE LONG BASED ON DAILY ANALYSIS. 10:34 am - AUD/USD 1HOUR CURRENTLY SITTING ON 50ema AND RANGING IN A 'BULLISH' FLAG PATTERN.
ENTER LONG UPON BREAK OF CHANNEL.
Daily 123 Gr4d candlestix .
1st Target Gr4d the close above '2'
right now looking for confirmation on 1hr & 4hr timeframe for a Cgr4d within the Flag/Channel.

DELT heading to overbought sidein my opinion once $DELT hits its overbought signals it is due for a reversal

PLML headed for a fallsitting close to the resistance and most likely will not break it and fall back to low 4's

Why do you trade? Trading Goals and motivations (trade plan)Why do you trade? Consider writing down your personal trading goals.
The following are my personal Trading Goals & Motivations (taken from my trade plan).
Goals - Consistency
1. Focus on the process and let the results happen
2. Think in probabilities and whether I followed my plan. (Not right or wrong)
3. Master the ability to sit on my hands
4. Demand constant improvement
5. Follow the rules of my trade plan, ALWAYS.
6. Master the mental game
Goals - Financial
1. Fund and trade full account
2. Replicate my current income through trading (short term plan)
3. Once (1) is accomplished, maintain and build wealth (long term plan)
4. Have the freedom to quit my job if I so choose
Motivations
1. BE SUCCESSFUL = Achieve repeatable, consistent trading, reach goals,
2. Live the life I want. Flexibility, lifestyle, comfort, schedule, travel
3. Enjoy the journey
4. Continue to learn and get education


AUDCAD W Bullish BAT PATTERN @ 0.9270Hi guys,
Here we have a bullish BAT PATTERN on the Aussie-Canadian Dollar coming in at around 0.9270. This is a long-term trade so I'll be making sure I take into account my position size in order to manage my risk effectively. The reason why I love BAT patterns is that they give such good risk-reward which is obviously key to trading successfully.
Stops will as per usual go below the X leg and targets will be at the 31.8% and 61.8% retracements.
THANK YOU FOR YOUR SUPPORT!
Trade Numbers:
Risk: 270 pips x 2 = 540 pips
Reward #1: 350 pips. R:R = 1:1.3
Reward #2: 550 pips. R:R = 1:2.1
Plan your trade... Trade your plan.

NZDUSD 30 Bullish BAT PATTERN @ 0.6788Hi guys,
I thought I would share a pattern I am most fond of, the BAT pattern . I admire this setup because it mainly follows the overall trend and takes into account major support and resistance levels. As a strong believer in economics and harmonics, I believe this pattern gives 2 things which most traders strive for: 1) Good risk-to-reward and 2) Good win percentage %.
Back to the trade idea, it is a bullish BAT pattern @ 0.6788 in which i would have a buy limit in place and stop loss will be placed BELOW the X leg which we use as good support in this case. Targets will be at the 38.2% and 61.8% fibonacci levels. IF/WHEN first targets are met, half of the position would be closed for profit and stop loss for the second half of the position will be moved to break-even, ensuring a risk-free trade.
Thank you for your support.
Trade Numbers:
Risk: 17 pips x 2 = 34 pips
Reward #1: 22 pips. R:R = 1:1.25
Reward #2: 35 pips. R:R = 1:2
Plan your trade... Trade your plan.

GBPJPY 15 Bearish CYPHER PATTERN @ 157.64Hi Guys,
This is a bearish CYPHER pattern @ 157.64 and stop loss will be placed above the X leg which we use as good resistance in this case. TARGETS ON THIS TRADE WILL BE DIFFERENT TO USUAL AS I VIEW THIS AS A DOWN-TRENDING PAIR, THEREFORE TARGETS WILL BE AT SUPPORT/RESISTANCE LEVELS. IF/WHEN first targets are met, half of the position would be closed for profit and stop loss for the second half of the position will be moved to break-even, ensuring a risk-free trade.
Thank you for your support.
Trade Numbers:
Risk: 57 x 2 = 114 pips
Reward #1: 57 pips. R:R = 1:1
Reward #2: 115 pips. R:R = 1:2
Plan your trade... Trade your plan.

EURTRY D Bearish GARTLEY PATTERN @ 3.4470Hi Guys,
This is a bearish GARTLEY Pattern completing at 3.4500 but I will be front-running my orders to make sure I get filled on this trade. The EURTRY has been in an uptrend for a long time now but it hit a level of resistance in back-to-back months late last year. I am expecting that the same level of resistance will hold making for a good sell trade for harmonic confluence.
The stop loss will be placed tightly above above the X leg as this pair has been in an uptrend forever which is used as good resistance in this case. Targets will be at the 38.2% and 61.8% fibonacci levels. IF/WHEN first targets are met, half of the position would be closed for profit and stop loss for the second half of the position will be moved to break-even, ensuring a risk-free trade.
Thank you for your support.
Trade Numbers:
Risk: 1000 pips x 2 = 2000 pips
Reward #1: 1700 pips. R:R = 1:1.70
Reward #2: 2750 pips. R:R = 1:2.75
Plan your trade... Trade your plan.

CADJPY 60 Bearish CYPHER PATTERN @ 84.75Hi Guys,
This is a bearish CYPHER pattern @ 74.10 and stop loss will be placed above the X leg which is used as good resistance in this case. Targets will be at the 38.2% and 61.8% fibonacci levels. IF/WHEN first targets are met, half of the position would be closed for profit and stop loss for the second half of the position will be moved to break-even, ensuring a risk-free trade.
Thank you for your support.
Trade Numbers:
Risk: 65 pips x 2 = 130 pips
Reward #1: 67 pips. R:R = 1:1
Reward #2: 108 pips. R:R = 1:1.65
Plan your trade... Trade your plan.

EURUSD W Bearish GARTLEY PATTERN @ 1.1600Hi guys,
I actually studied the Gartley pattern from a book named "Trade What You See" by Pesavento. It uses the Gartley pattern in conjunction with the famous AB=CD pattern giving us a nice trading range maybe to "dollar-cost-average" into a trade, reducing overall risk.
Back to the trade idea, it is a bearish GARTLEY pattern @ 1.1600 in which i would have a sell limit in place and stop loss will be placed above the X leg which we use as good resistance in this case. Targets will be at the 38.2% and 61.8% fibonacci levels. IF/WHEN first targets are met, half of the position would be closed for profit and stop loss for the second half of the position will be moved to break-even, ensuring a risk-free trade.
Thank you for your support.
Trade Numbers:
Risk: 335 pips x 2 = 670 pips
Reward #1: 420 pips. R:R = 1:1.25
Reward #2: 680 pips. R:R = 1:2
Plan your trade... Trade your plan.
