BTCUSD is heading towards 94K for a retest...
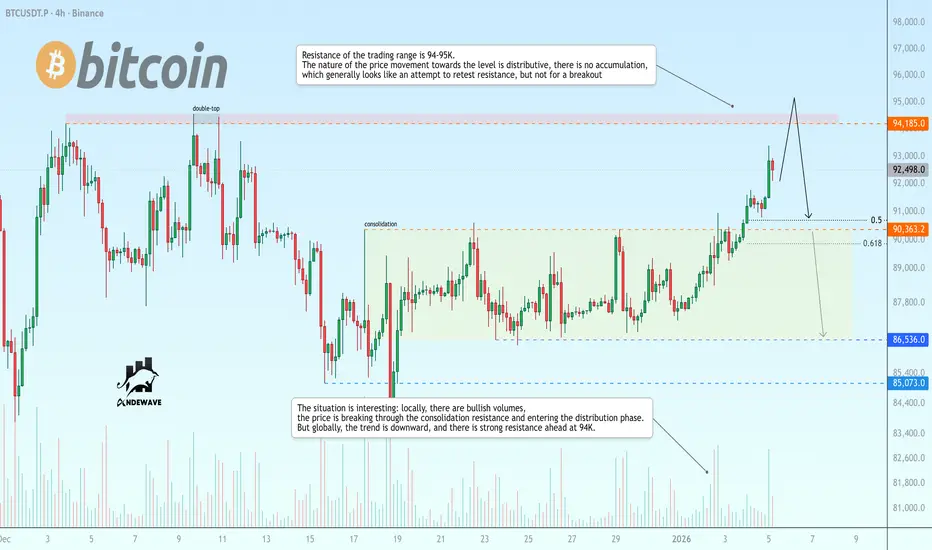
The situation is interesting: locally, there are bullish volumes, the price is breaking through the consolidation resistance and entering the distribution phase. However, globally, the trend is downward, and there is strong resistance ahead at 94K.
Resistance of the trading range is 94-95K. The nature of the price movement towards the level is distributive, there is no accumulation, which generally looks like an attempt to retest resistance, but not for a breakout. Bears may provoke a pullback from 94K.
Scenario: Retest of 94200, a false breakout and the formation of a reversal pattern below 94K could signal a possible pullback and decline to 90K - 86K.
Contains image
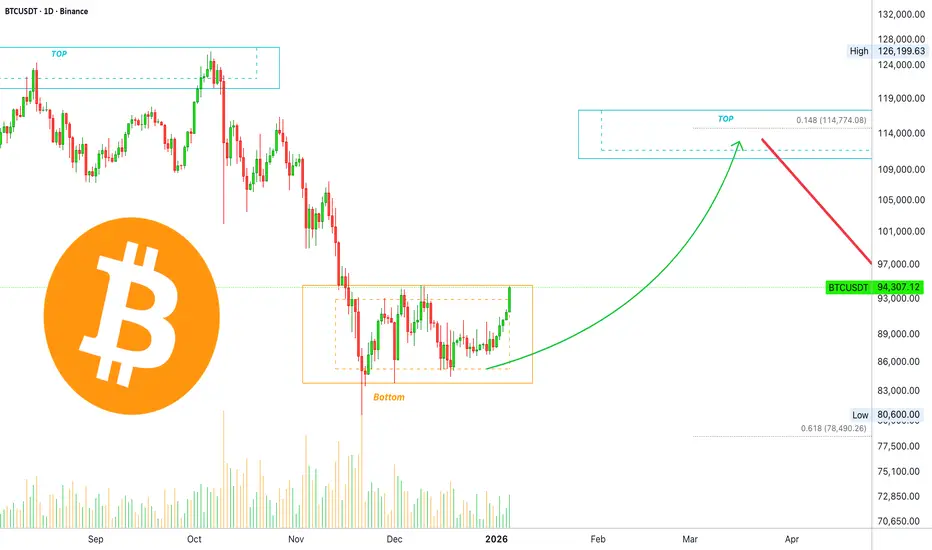
Bitcoin recovers, set to move back above $100,000Bitcoin just hit the highest price since the bearish breakdown, we have a local uptrend, a technical confirmation of the relief rally and recovery.
First, we used the chart signals to predict a reversal and relief rally. Now, it is confirmed based on Bitcoin's price action. We have higher highs and higher lows since 21-November. This fully reveals that we are headed higher in the coming weeks. All the altcoins are also recovering and/or moving forward for a while now.
In the last 24 hours, $216.2M worth of SHORT positions have been liquidated, vs only $11.7M worth of LONGs. This clearly reveals an overwhelming bearish bias and sentiment on Bitcoin and the altcoins market.
What happens when the sentiment changes from bearish to bullish? What happens when the market realizes that we are headed up?
I'll tell you, a massive bullish run.
Namaste.
Lingrid | GOLD Trend Continuation After Corrective PhaseOANDA:XAUUSD remains within a well-defined upward channel after completing a healthy corrective move from the recent higher high. Price has respected the 4,300 support zone, printing a higher low directly on the rising trendline — a key signal that bullish structure is still intact.
This area acts as a technical demand zone, combining support and prior consolidation, making it a high-probability zone for continuation. As long as price holds above 4,350, buyers are expected to defend the structure and push price back toward 4,510 initially, with a potential extension into the higher resistance zone.
➡️ Primary scenario: support holds → continuation toward 4,510
⚠️ Invalidation: decisive breakdown below 4,350 shifts bias to deeper correction
If this idea resonates with you or you have your own opinion, traders, hit the comments. I’m excited to read your thoughts!

BCHUSDT retests flat support on bullish trend BCHUSDT previously broke through resistance at 631.2 and formed a new trading range. After rising, the price entered a consolidation phase and may test support at 632-630 before rising again.
There is volume in the market, but it is beginning to fade. The signs are mixed, most likely due to consolidation. Ahead is the 632-630 support zone.
Scenario: capturing liquidity hidden below 632.0 and a false breakout (return to the long zone) may signal continued growth within the bullish trend.

Gold - Control vs Patience… Who Wins Next?Gold hasn’t done anything crazy lately, and that’s exactly the point.
Zooming out, the structure is still bullish. Every dip so far has been met with buyers, and the market keeps printing higher highs and higher lows.
Right now, price is sitting inside what I like to call a decision zone. This is where the market usually pauses, shakes out impatient traders, and shows its real intention.
As long as we’re holding above this green zone, bulls are still in control. This looks more like a pause or reload than a reversal.
That said, if price loses this area and starts accepting below it, then the story changes... and a deeper correction would be on the table.
What do you think? Will Gold reload and continue higher, or is this where control shifts? 🤔
⚠️ Disclaimer: This is not financial advice. Always do your own research and manage risk properly.
📚 Stick to your trading plan regarding entries, risk, and management.
Good luck! 🍀
All Strategies Are Good; If Managed Properly!
~Richard Nasr

Gold 30-Min — Volume sell Reversal Triggered⚡Base : Hanzo Trading Alpha Algorithm
The algorithm calculates volatility displacement vs liquidity recovery, identifying where probability meets imbalance.
It trades only where precision, volume, and manipulation intersect —only logic.
✈️ Technical Reasons
/ Direction — SHORT / Reversal 4450 Area
☄️Bearish rejection confirmed through sharp candle body.
☄️Lower-high forming beneath resistance supply region.
☄️Volume decreasing confirms exhaustion in price rally.
☄️Sellers regained imbalance with heavy top rejection.
☄️Algorithm detects fading demand and shift to control.
⚙️ Hanzo Alpha Trading Protocol
The Alpha Candle defines the day’s real control zone — the first battle of momentum.
From this origin, the Volume Window reveals where the next precision strike begins.
⚙️ Hanzo Volume Window / Map
Window tracked from 10:30 — mapping true market behavior.
POC alignment exposes institutional bias and breakout potential zones.
⚙️ Hanzo Delta Window / Pulse
Delta window monitors real buying vs. selling power behind each move.
Tracks volume aggression to expose who controls the candle — buyers or sellers.
When Delta aligns with Volume Map, momentum becomes undeniable.

GOLD 4H CHART ROUTE MAP UPDATE & TRADING PLAN FOR THE WEEKHey Everyone,
Please see our 4h chart route map and trading plan for the week ahead.
We are now seeing price play between two weighted levels with a gap above at 4378 and a gap below at 4295. We will need to see ema5 cross and lock on either weighted level to determine the next range.
We will see levels tested side by side until one of the weighted levels break and lock to confirm direction for the next range.
We will keep the above in mind when taking buys from dips. Our updated levels and weighted levels will allow us to track the movement down and then catch bounces up.
We will continue to buy dips using our support levels taking 20 to 40 pips. As stated before each of our level structures give 20 to 40 pip bounces, which is enough for a nice entry and exit. If you back test the levels we shared every week for the past 24 months, you can see how effectively they were used to trade with or against short/mid term swings and trends.
The swing range give bigger bounces then our weighted levels that's the difference between weighted levels and swing ranges.
BULLISH TARGET
4378
EMA5 CROSS AND LOCK ABOVE 4378 WILL OPEN THE FOLLOWING BULLISH TARGET
4466
EMA5 CROSS AND LOCK ABOVE 4466 WILL OPEN THE FOLLOWING BULLISH TARGET
4545
EMA5 CROSS AND LOCK ABOVE 4545 WILL OPEN THE FOLLOWING BULLISH TARGET
4609
EMA5 CROSS AND LOCK ABOVE 4609 WILL OPEN THE FOLLOWING BULLISH TARGET
4675
BEARISH TARGET
4295
EMA5 CROSS AND LOCK BELOW 4295 WILL OPEN THE SWING RANGE
4236
4173
EMA5 CROSS AND LOCK BELOW 4173 WILL OPEN THE SECONDARY SWING RANGE
4095
4040
As always, we will keep you all updated with regular updates throughout the week and how we manage the active ideas and setups. Thank you all for your likes, comments and follows, we really appreciate it!
Mr Gold

GBPUSD - Right Into Resistance… Again!GBPUSD is now trading at a very important intersection.
Price is pressing right into the upper red trendline, while also sitting inside the green resistance zone. This is not a random area... it’s a level that has already rejected price multiple times in the past.
From a bigger-picture perspective, the structure remains overall bearish, with price still respecting the descending channel. The recent push higher looks more like a corrective move rather than a true trend reversal.
As long as this trendline + resistance intersection holds, my focus stays clear:
I’ll be looking for trend-following shorts, preferably after lower-timeframe confirmation and signs of bearish control.
Only a strong and clean break above this zone would force a reassessment. Until then, sellers still have the edge.
⚠️ Disclaimer: This is not financial advice. Always do your own research and manage risk properly.
📚 Stick to your trading plan regarding entries, risk, and management.
Good luck! 🍀
All Strategies Are Good; If Managed Properly!
~Richard Nasr

THE KOG REPORT - UpdateEnd of day update from us here at KOG:
Yesterday we took something on the short but due to it being late session and the end of day report we suggested we would wait for the price to either reject or break above. We did mention we were a bit too high to long and a retracement was needed into that 4430-35 region which we got and then continued with the move above the defence which is where we're we have now completed our Excalibur target.
We're now sitting at a strong resistance level above at 4490-95 with support again the bias level 4450. The mean is being dragged up here but the danger is one bearish candle can change the structure pre-event Friday. So although we'll look higher, and we'll look for pull backs to remain above 4435 until the indi's suggest otherwise.
Anything in now should be protected and managed so there is no risk here.
From Camelot this morning:
Price: 4454
RED BOXES:
Break above 4455 for 4468✅, 4485✅ and 4502 in extension of the move
Break below 4435 for 4428, 4424, 4416 and 4410 in extension of the move
As always, trade safe.
KOG

THE KOG REPORT - UpdateEnd of day update from us here at KOG:
A good start to the year and week with the gap on open breaking our bias level and completing the red box targets. We also managed to achieve the red box defence where earlier we got the RIP for a bonus reverse trade.
Now we have resistance at the red box which needs to be monitored for a 4H close, otherwise, we'll stick with the idea and look for a possible retracement here into the 4430-20 region initially.
With this gap below and the stretch in play, we're too high and it's too risky to attempt going long, so there is no option but to wait for the pullback or, to attempt the short from resistance levels.
Key levels here:
4455 Resistance with 4460 in extension
4440 support with 4435 in extension
As always, trade safe.
KOG

XRP - From Support to Momentum Shift!Let’s break this one down step by step.
On the left chart, (Weekly chart) XRP just rejected a very strong weekly support zone around $1.75 – $1.90. This level has been rejected multiple times in the past, and once again, buyers stepped in!
Now shifting to the right chart , (Daily chart) this is where things get interesting.
After months of downside pressure, momentum officially flipped from bearish to bullish. XRP managed to:
• Break above the falling red channel
• Take out the last major daily high marked in blue
That’s a classic sign of a momentum shift, not just a random bounce.
At the moment, price is correcting, which is healthy after such a move.
As long as this correction remains controlled, my focus is simple:
I’ll be looking for longs, targeting the supply zone marked in green above.
If structure continues to hold, dips are no longer something to fear... they’re something to watch closely.
Is this the start of a larger XRP rotation… or just the first step? 🤔
⚠️ Disclaimer: This is not financial advice. Always do your own research and manage risk properly.
📚 Stick to your trading plan regarding entries, risk, and management.
Good luck! 🍀
All Strategies Are Good; If Managed Properly!
~Richard Nasr

Gold 30-Min — Volume Buy & sell Reversal Triggered⚡Base : Hanzo Trading Alpha Algorithm
The algorithm calculates volatility displacement vs liquidity recovery, identifying where probability meets imbalance.
It trades only where precision, volume, and manipulation intersect —only logic.
✈️ Technical Reasons
/ Direction — LONG / Reversal 156.200 Area
☄️Bullish momentum confirmed through strong candle body.
☄️Structure shifted with higher-low near key demand base.
☄️Volume expanding confirms order-flow alignment upward.
☄️Buyers reclaimed imbalance with sustained clean break.
☄️Algorithm detects rising momentum under low liquidity.
✈️ Technical Reasons
/ Direction — SHORT / Reversal 156.800 Area
☄️Bearish rejection confirmed through sharp candle body.
☄️Lower-high forming beneath resistance supply region.
☄️Volume decreasing confirms exhaustion in price rally.
☄️Sellers regained imbalance with heavy top rejection.
☄️Algorithm detects fading demand and shift to control.
⚙️ Hanzo Alpha Trading Protocol
The Alpha Candle defines the day’s real control zone — the first battle of momentum.
From this origin, the Volume Window reveals where the next precision strike begins.
⚙️ Hanzo Volume Window / Map
Window tracked from 10:30 — mapping true market behavior.
POC alignment exposes institutional bias and breakout potential zones.
⚙️ Hanzo Delta Window / Pulse
Delta window monitors real buying vs. selling power behind each move.
Tracks volume aggression to expose who controls the candle — buyers or sellers.
When Delta aligns with Volume Map, momentum becomes undeniable.

SLP to the mooooon 50% gain toward 0.0013$hi
soon the BINANCE:SLPUSDT will breakout the descending channel to the upside and explosion will come true i can see at least 50% gain toward 0.0013$ for the price

The one thing that destroys tradersEmotional inflation is a measurable drag on trading performance, particularly in crypto where momentum cycles are short, liquidity is thin, and feedback loops are fast. After a trader strings together strong wins, confidence often expands faster than process. The trader begins to treat recent outcomes as a new baseline for risk. This leads to size increases, earlier entries, or skipping structural confirmation because the mind assumes the market will continue to cooperate. It feels logical in the moment, but it is not rooted in market behavior. The market eventually tests this inflated confidence through liquidity sweeps, compressed volatility, or reclaiming defensive structure. The result is capital giveback, distorted expectations, and emotional volatility that exceeds price volatility.
The cost of emotional inflation is not that it creates bad trades. The cost is that it removes the conditions that made your best trades possible. When confidence accelerates exposure before the market proves continuation through structure and liquidity, you are no longer trading opportunity. You are trading assumption. Crypto punishes assumption faster than most markets because liquidity leaves quickly, bid depth changes abruptly, and breakout traders provide easy fuel for counter moves.
Inflation becomes visible in three repeatable behaviors: increasing size during expansion phases instead of compression phases, entering at the first touch of a level instead of after a structural transition, and treating recent wins as proof of future market cooperation. These behaviors are not personality flaws. They are pattern loops that can be corrected with objective rules and sequencing.
To counter emotional inflation, you need guardrails that do not depend on feelings. The first guardrail is a fixed sizing model tied to volatility conditions, not P&L conditions. Size should increase only when volatility tightens, liquidity aligns cleanly, and structure confirms control. In expansion phases, size must stay anchored to predefined limits because invalidation distance widens when liquidity thins. This keeps risk mathematically stable while confidence psychologically fluctuates.
The second guardrail is daily narrative rebuilding. Bias is constructed from the higher timeframe story, not the previous trade’s outcome. If the weekly and daily structure have not changed, your job is to wait for liquidity incentives and micro-structural permission before expanding exposure. A trader who rebuilds bias every session stays psychologically neutral when the market is structurally neutral.
The third guardrail is retest discipline. A retest is not a candle. It is acceptance. The retest validates participation, reduces invalidation distance, and reveals whether the market internalized the structural break or sweep. Entering before the retest is entering during the liquidity hunt. Entering after the retest is entering after participation is proven. This is where professionals position, not because they are late, but because they are validated. Retests compress emotional cycles because they remove the need to hope a level will hold.
The fourth guardrail is execution quality scoring.
Track trades by sequence: liquidity taken first, structure broken second, displacement confirmed third, retest respected fourth. Grade your execution on fill precision, conditional sizing, and narrative alignment. This shifts confidence from results to behavior, which compounds careers instead of compressing them.
A journal becomes a solution only when it measures variables that lead to intervention, not reflection. Measure session volatility, invalidation distance, average R:R delivered, liquidity incentives present, and whether the entry occurred inside premium or discount relative to equilibrium. This reveals inflation risks before they hit your equity curve.
Emotional inflation loses its power when you treat streaks as feedback, not permission. The best funded crypto traders do not compound because they avoid risk. They compound because they only expand risk when the market contracts volatility, aligns liquidity, and confirms structure. Confidence should drive preparation, not replace it.
Calibration compounds. Inflation decays. Careers are built by traders who stay calibrated longer than they stay confident temporarily.

BTC Breakout in Play Retest Zone Will Define ContinuationAs highlighted in our previous BTC update, price was approaching a structural decision point and the breakout has now been confirmed.
BTCUSDT has now broken above the upper trendline of the bearish structure , signaling a short-term shift in market behavior after prolonged downside pressure.
A sustained break and acceptance above the immediate resistance will confirm bullish stability, with a natural retest expected toward the breakout zone and the immediate support zone.
If this retest is successful and price holds above reclaimed structure, upside continuation remains favored toward the projected targets marked on the chart. Failure to maintain acceptance above this zone would invalidate the breakout scenario and shift focus back toward lower support.

Gold doesn’t hate you. Gold just loves… your liquidity.If you’ve ever felt like XAUUSD has a personal grudge against you — price spikes the moment you enter, sweeps your SL perfectly, then runs strongly in your predicted direction right after you exit — take a breath. Pause for a second.
The gold market doesn’t move based on emotions.
It moves based on liquidity — the fuel behind every major move .
1. Retail traders trade price. Institutions trade orderflow.
You look at the chart to find a perfect entry.
Institutions look at the chart to find where the most SL and pending orders are stacked.
To them, it’s not a “resistance zone” — it’s a liquidity pool.
When retail SL gets triggered, it turns into market orders.
And those market orders become the free matching engine for big players to enter without excessive slippage.
You think you’re protecting your risk with SL.
The market thinks you’re placing free orders for them to fill their positions.
2. Gold loves clean levels because SL sits at clean levels.
Liquidity sweep zones usually share the same traits:
- Recent highs/lows everyone can see
- Support/resistance that looks clean and easy to draw
- Attractive round numbers like 2,700 – 2,650 – 2,600…
These areas are liquidity magnets, not breakout signals.
3. “Sweep then run” is a process, not an exception.
A major gold move typically has 2 phases:
- Liquidity grab (SL sweep, pending activation)
- Expansion (the real trend begins)
Most traders lose because they confuse phase 1 with phase 2.
Retail sees a spike → fear trend break.
Institutions see a spike → mission accomplished, liquidity collected, positions filled.
4. The market doesn’t need you to be wrong — it only needs you forced out.
Gold doesn’t need to prove your analysis was bad.
It just needs enough volatility to make you:
- Hit SL
- Or close manually out of panic
Either way, the market gets the liquidity you left behind.
5. Trading maturity = not turning yourself into liquidity.
You don’t need to remove SL. You just need to:
- Place SL where the structure is truly invalidated, not where liquidity is obvious
- Enter after liquidity is swept, not before
- Keep margin to reposition during pullbacks
- Understand: being right isn’t enough — you must be right at the right time.

Bitcoin Reversal Structure Confirmed? $94K Is the Key LevelBitcoin is printing a high-confidence bullish reversal structure in the form of an Adam & Eve pattern, signaling a clear shift in market behavior after the recent corrective phase. The $94K level remains the critical neckline and a major resistance area, where price reaction will determine confirmation. A sustained breakout and acceptance above $94K would validate the setup and open the path toward the projected $110K target.
Until confirmation is achieved, attention should remain on the immediate demand zone, as holding this level is essential to maintain the bullish reversal thesis.

Lingrid | GBPJPY Momentum Continuation Trade OpportunityFX:GBPJPY remains firmly inside a well-defined upward channel, with price holding above both the ascending trendline and the former consolidation zone. The recent pullback formed a higher low, confirming trend strength and continuation intent.
Momentum is rebuilding after consolidation, and price is now positioned for a push toward the 213.8 resistance zone, which aligns with the upper channel boundary. As long as price stays above the 211.4 support area, the bullish scenario remains intact.
➡️ Primary scenario: higher low holds → continuation toward 213.8
⚠️ Invalidation: sustained break below 211.4 would weaken the bullish structure
If this idea resonates with you or you have your own opinion, traders, hit the comments. I’m excited to read your thoughts!

ICP Holds Key Weekly Demand Recovery Scenario in FocusICPUSDT is trading at a long-term accumulation zone after an extended corrective cycle within a descending channel. Price is currently reacting from the lower boundary of this structure, an area that has historically acted as strong demand.
As long as price holds above this accumulation region, a recovery move toward the main supply zone around the mid-range becomes increasingly likely. A successful breakout and acceptance above that level would open the path for a broader upside expansion toward the external supply zone highlighted on the chart.
Failure to defend the accumulation zone, however, would invalidate the recovery thesis and expose ICP to further downside continuation.

OKB - Quiet Accumulation Before the Next Move?OKB has been through a long corrective phase, grinding lower inside a descending channel.
What stands out now is context.
Price is sitting on a major demand zone, a level that previously sparked strong upside momentum.
Since tapping this area, sellers have clearly slowed down, and price has started to compress rather than continue lower. That’s usually the first sign that selling pressure is getting absorbed.
At the same time, OKB is now pushing back toward the key structure above. This is the line in the sand.
As long as we’re holding above demand, I’m not interested in chasing shorts down here.
🏹For bulls to truly take over , we’ll need a clean break and acceptance above the orange structure zone. That’s when momentum shifts from defensive to offensive.
Until then, we wait :)
⚠️ Disclaimer: This is not financial advice. Always do your own research and manage risk properly.
📚 Stick to your trading plan regarding entries, risk, and management.
Good luck! 🍀
All Strategies Are Good; If Managed Properly!
~Richard Nasr

BTC/USD Analysis: Bullish Breakout Confirmation($99K Called)The technical structure for BTC has shifted decisively. The key descending trendline, which previously contained price action, has now been conclusively broken to the upside.
This breakout has been followed by a successful retest of the trendline as new support. Critically, this retest was accompanied by significant buy-side volume, confirming genuine investor conviction and a transfer of ownership at higher levels.
With this bullish confirmation in place, the focus shifts to the major support zone between $88K and $90K. As long as this foundational support holds, the path of least resistance is now higher.
The completed breakout pattern projects a measured move toward an initial upside target of $99K. Price action is now consolidating energy for the next leg upward.
DISCLAIMER: ((trade based on your own decision))
<<press like👍 if you enjoy💚


CHFJPY-TREND REVERSALCHFJPY IS seems to be reversing its trend to bearish as it has showed significant sign using technical and fundamental analysis.
