$ETH (DAILY): WAVE 5 to $5800+ likely NEXT?CRYPTOCAP:ETH has been stuck in this PIVOT ZONE around the $4,000 crucial SUPPORT/RESISTANCE level, and the whole #Altcoin world has been stuck with it.
We have just had another close below, but still above the $3,880 minor support (Fib 0.382 retracement level). If ETH can stay above $3.9K, that would be a HIGHER LOW after a minor HIGHER HIGH recently (rejected by the 50 MA), thus signaling a BULLISH MARKET STRUCTURE flip.
That’s the most likely scenario in my mind — I’ve been saying for a while that a WAVE 5 should be next, targeting $5,860.
In case of a flash crash (which I consider rather unlikely), I have my BUY LIMIT order ready between $3,330 and $3,551.
This sideways chop is coming to an end, surely — prepare for a bigger move in whichever direction.
200 MA at $3,320 — a BULL market coin, so the upside is much more likely.
👽💙
Contains image

XAUXAUStraight from perplexity - Potential for a Return to $4,200
Gold prices have fluctuated but repeatedly tested the $4,200 level, and the consensus among many experts is that, despite recent corrections, gold could readily revisit or sustain levels near $4,200, depending on global economic events, monetary policy (especially Fed rate decisions), inflation, and geopolitical uncertainties.

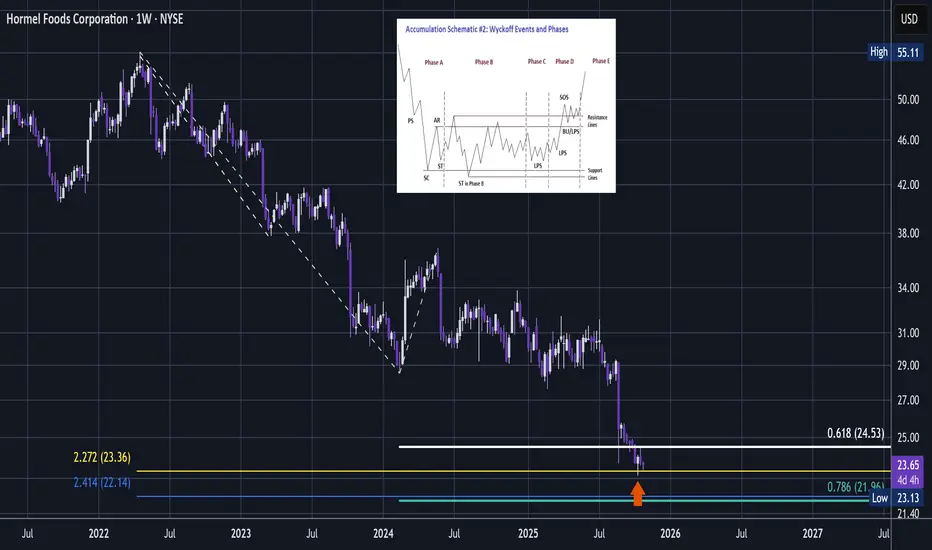
HRL - Deep Defensive Technical BuyHormel Foods is next for my deep buy system.
This one is a great defensive buy.
For TradingView, be aware that I am not specifically focused on defensive stocks. Rather it is certain defensive stocks that are arriving to deep technical opportunity.
In the pandemic crash it hardly blinked!
It has best dividend yield for this sector -4.85%
So if you're looking for a stock to buy in prime HTF technical position that can be resilient in a market crash then this might be a great choice.
Its not the highest volatility but it it has a very strong historical record.
Its hitting the distributive 2.272 GW and also a weak 1:0.618 GW - the weakness signals potential upside momentum if it bottoms here.
Nice LTF slightly lower low can be the Wyckoff SC > ST (arrow).
The only detail lacking is a strong support - so this setup is not 100% ideal, but its not too far off.
So, this is effectively a prime buy, but since there is no support - it must hold and will require some close monitoring until it moves up.
I bought a chunk here.
AI write up:
"Hormel Foods Corporation (NYSE: HRL) is best classified as a defensive stock, anchored in the consumer staples sector. Its portfolio includes enduring brands like SPAM, Jennie-O, and Skippy, which cater to consistent consumer demand regardless of economic cycles. This defensive positioning is reinforced by Hormel’s stable dividend history and relatively low beta, making it a common pick for income-focused and risk-averse investors.
📊 Core Financial Highlights – Q3 Fiscal 2025:
- Net Sales: $3.03 billion, with organic growth up 6% year-over-year, driven by strong retail volume increases, especially in turkey and shelf-stable meats like SPAM.
- Operating Income: $240 million, with adjusted operating income at $254 million. Operating margin stood at 7.9%, slightly below historical norms, reflecting cost pressures.
- EPS: Diluted earnings per share came in at $0.33, or $0.35 adjusted. The company projects Q4 EPS between $0.38–$0.40.
- Valuation: Trailing P/E ratio is 17.3, forward P/E is 16.01, and PEG ratio is elevated at 5.17, suggesting slower growth relative to valuation.
- Balance Sheet: Hormel maintains a solid financial foundation with a market cap of ~$13 billion and enterprise value of ~$15.3 billion. Institutional ownership is moderate at 43.45%, and insider ownership remains low.
⚠️ Lowlights and Risk Factors:
- Profitability Pressure: Rising commodity costs have compressed margins, despite volume growth. Hormel’s Transform and Modernize initiative (90+ projects) aims to offset inflationary headwinds, but execution risk remains.
- Growth Constraints: While organic sales are rising, the PEG ratio signals limited earnings acceleration, potentially capping upside for growth-oriented investors.
🛡 Bankruptcy Risk: Hormel’s risk of bankruptcy is extremely low. The company has no history of financial distress, maintains strong cash flows, and operates in a recession-resilient sector. Its conservative capital structure and consistent dividend payments further reinforce its financial stability.
"Hormel Foods (HRL) currently pays an annual dividend of $1.16 per share, distributed quarterly at $0.29 per share. The next payment is scheduled for November 17, 2025, to shareholders of record as of October 14.
📈 Dividend Yield & Payout:
- Dividend Yield: 4.81%–4.89%, significantly above the consumer defensive sector average of ~2.85%
- Payout Ratio: ~84.7%, indicating a high portion of earnings is returned to shareholders
- Dividend Growth: Hormel has increased its dividend for 59 consecutive years, maintaining its Dividend King status
This high yield and long growth streak make HRL attractive for income-focused investors, though the elevated payout ratio suggests limited room for aggressive increases without earnings growth."
This analysis is shared for educational purposes only and does not constitute financial advice. Please conduct your own research before making any trading decisions.
Bitcoin is crazy volatile as rates get cutBTC reacted by selling off while the news of a 25bps interest rate cut was being released. Despite the bullish news, the market still sold; however price is still respecting the range and did not produce a lower low. These moments are designed it inflict pain and flush holders out of the market. Have strong risk management and don't risk what you are not willing to lose.

EURUSD FRGNT Daily Forecast - Q4 | W44 | D29| Y25 |📅 Q4 | W44 | D29| Y25 |
📊 EURUSD FRGNT Daily Forecast
🔍 Analysis Approach:
I’m applying Smart Money Concepts, focusing on:
Identifying Points of Interest on the Higher Time Frames (HTFs) 🕰️
Using those POIs to define a clear trading range 📐
Refining those zones on Lower Time Frames (LTFs) 🔎
Waiting for a Break of Structure (BoS) for confirmation ✅
This method allows me to stay precise, disciplined, and aligned with the market narrative, rather than chasing price.
💡 My Motto:
"Capital management, discipline, and consistency in your trading edge."
A positive risk-to-reward ratio, paired with a high win rate, is the backbone of any solid trading plan 📈🔐
⚠️ Losses?
They’re part of the mathematical game of trading 🎲
They don’t define you — they’re necessary, they happen, and we move forward 📊➡️
🙏 I appreciate you taking the time to review my Daily Forecast.
Stay sharp, stay consistent, and protect your capital
— FRNGT 🚀
OANDA:EURUSD

$XPL (4-HOUR): DECISION TIME now, ZERO or HERO from here?AMEX:XPL has got an interesting combination of chart patterns waiting to resolve — a FALLING WEDGE (breakout point around $0.37, confluence with the yellow 50 MA) and a BEARISH PENNANT, which has already broken to the downside with a retest.
The breakdown is targeting $0. This is quite rare, but in the past, I’ve seen two or three coins that had a bearish pattern breaking down toward zero — and they ended up being rug pulls. Lol.
Probably not in this case, but this is crypto — never say never.
All in all, bearish outlook, a DOWNTREND, and a clear negative Elliott Wave count showing a wave target at (you guessed it) nearly zero again — independently of the pennant.
For a bullish reversal, we definitely need to see stronger volume — it’s been pathetic so far — and a FALLING WEDGE breakout, followed by a reclaim of the $0.40–$0.42 support/resistance zone.
Kicking myself for investing so early in this #Plasma thing ($1.1 average price). Still not a dead project at all — but the charts are looking awful for now.
💙👽

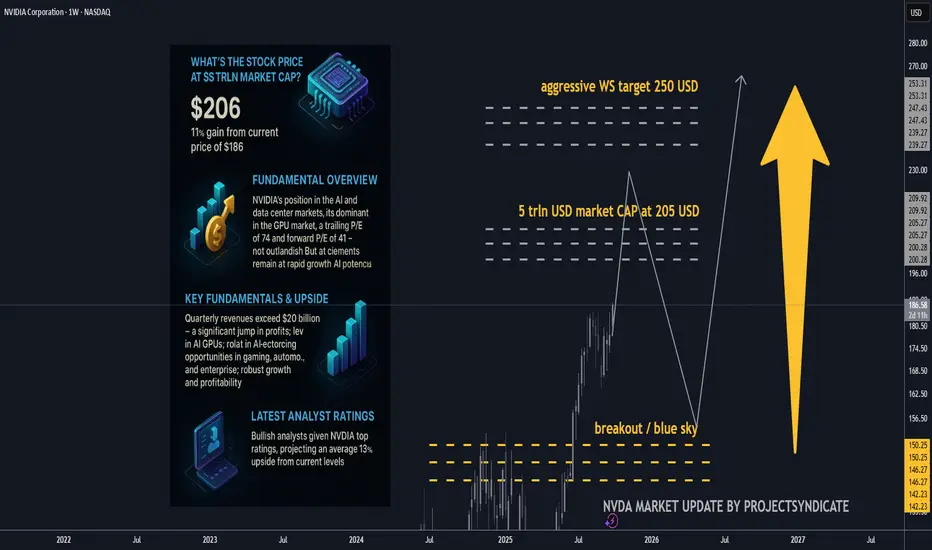
NVDA 5 trln USD market cap up next? Key fundamentals and upside.Is $5T reasonable for NVDA?
• Mechanically, yes: The market only needs ~10% near-term appreciation from today’s levels to print $5T. That’s within one strong quarter or a guidance beat.
• Fundamentally, the math works if (a) FY26–27 revenue tracks the guide/Street trajectory (TTM already $165B with Q3 guide $54B), (b) non-GAAP GMs hover low-to-mid-70s, and (c) opex discipline holds. Under those, forward EPS path supports ~35× at $5T, a premium but not outlandish for a category-defining compute platform.
• Free-cash optionality: With ~$48B net cash and massive FCF, NVDA can keep funding buybacks (already $60B fresh authorization) and capacity, smoothing cycles.
________________________________________
• Stock price at $5T market cap: ≈ $205.8 per share (on ~24.3B shares).
• Gain needed from $186.6: +$19.2 (~+10.3%).
The quick math (market cap ⇒ price)
• Shares outstanding (basic): ~24.3 B (as of Aug 22, 2025, per 10-Q).
• Stock @ $5T market cap: $5,000,000,000,000 ÷ 24.3B ≈ $205.8/share.
• From today’s price $186.6: needs +$19.2 or ~+10.3%.
That also implies P/E (TTM) at $5T of roughly ~56× (using TTM EPS ~3.68). Today’s trailing P/E is ~50–53× depending on feed.
________________________________________
Core fundamentals snapshot 🧩
Latest quarter (Q2 FY26, reported Aug 27, 2025)
• Revenue: $46.7B (+56% y/y; +6% q/q).
• Data Center revenue: $41.1B (+56% y/y).
• GAAP gross margin: 72.4%; non-GAAP 72.7%; Q3 guide ~73.3–73.5%.
• GAAP EPS: $1.08 (non-GAAP: $1.05; excl. $180M inventory release: $1.04).
TTM scale & profitability
• Revenue (TTM): ~$165.2B.
• Net income (TTM): ~$86.6B.
• Diluted EPS (TTM): ~$3.5–3.7.
• Cash & marketable securities: $56.8B; debt: ~$8.5–10.6B ⇒ net cash ≈ $48B.
Capital returns
• $24.3B returned in 1H FY26; new $60B buyback authorization (no expiration). Remaining buyback capacity ~$71B as of Aug 26.
________________________________________
Valuation read (today vs. $5T)
Using widely watched metrics:
• P/E (TTM): ~50–53× today; at $5T it rises to ~56× (assuming flat TTM EPS).
• Forward P/E: Street FY27 EPS ≈ $5.91 → ~31–33× today; ~35× at $5T — still below many AI hyper-growth narratives that trade at 40–50× forward when growth visibility is high.
• EV/EBITDA (TTM): EV ≈ market cap – net cash. Today EV ~$4.45T; EBITDA TTM ≈ $98–103B ⇒ EV/EBITDA ~43–45×; at $5T EV/EBITDA drifts to ~48–50×.
• P/S (TTM): ~27× today (at $4.5T) and ~30× at $5T on $165.2B TTM revenue.
• FCF yield: TTM FCF range $60.9–72.0B ⇒ ~1.35–1.60% today; ~1.22–1.44% at $5T.
Takeaway: $5T doesn’t require a heroic repricing — it’s ~10% above spot and implies ~35× forward earnings if consensus holds. That’s rich vs. the S&P (~22.5× forward) but arguably reasonable given NVDA’s growth, margins, and quasi-platform status in AI compute.
________________________________________
What must be true to justify $5T (and beyond) ✅
1. AI capex “supercycle” persists/expands. Citi now models $490B hyperscaler AI capex in 2026 (up from $420B) and trillions through 2029–30. A sustained 40–50% NVDA wallet share across compute+networking underwrites revenue momentum and margin sustainment.
2. Annual product cadence holds. Blackwell today → Rubin in 2026 with higher power & bandwidth, widening the perf gap vs. AMD MI450 — supports pricing power and mix.
3. Margins stay “mid-70s” non-GAAP. Company guides ~73.3–73.5% near term; sustaining 70%+ through transitions offsets any unit price compression.
4. Networking, software & systems scale. NVLink/Spectrum, NVL systems and CUDA/Enterprise subscriptions deepen the moat and smooth cyclicality; attach expands TAM (improves EV/EBITDA vs. pure-GPU lens).
5. China/export workarounds do not derail mix. Q2 had no H20 China sales; guidance and commentary frame this as manageable with non-China demand and limited H20 redirection.
________________________________________
A contrarian check (where the model could break) 🧨
• Power & grid bottlenecks. Even bulls (Citi) note AI buildouts imply tens of GW of incremental power; slippage in datacenter electrification can defer GPU racks, elongating deployments (and revenue recognition).
• Debt-funded AI spend. Rising share of AI DC capex is being levered (Oracle’s $18B bonds; neoclouds borrowing against NVDA GPUs). If credit windows tighten, orders could wobble.
• Customer consolidation & vertical ASICs. Hyperscalers iterating custom silicon could cap NVDA’s mix/price in some workloads; edge inference may fragment.
• China policy volatility. Export rules already forced product pivots; rebounds are uncertain and not fully in NVDA’s control.
• Multiple risk. At ~50× TTM and >40× EV/EBITDA, any growth decel (unit or pricing) can de-rate the multiple faster than earnings make up the gap.
Bottom line of the bear case: If AI capex normalizes faster (say +10–15% CAGR instead of +25–35%), forward EPS still grows, but the stock would likely need multiple compression (toward ~25–30× forward), making $5T less sticky near-term.
________________________________________
Street positioning (latest bullish calls) 📣
• KeyBanc: $250 (Overweight) — Rubin cycle deepens moat → ~+34% implied upside.
• Barclays: $240 (Overweight) — AI infra wave; higher multiple to 35×. ~+29% upside.
• Bank of America: $235 (Buy). ~+26% upside.
• Bernstein: $225 (Outperform). ~+21% upside.
• Citi: $210 (Buy) — reiterates annual cadence & rising AI capex.
• Morgan Stanley: $206–210 (Overweight). ~+11–13% upside; 33× CY25 EPS framework.
• Consensus: Avg 12-mo PT ~$211, ~+13% from here.
________________________________________
________________________________________
Extra color you can trade on 🎯
• Where bulls may be too conservative:
o Networking/NVLink attach could outgrow GPUs as Blackwell/Rubin systems standardize on NVIDIA fabric, defending blended margins longer.
o Software monetization (CUDA ecosystem, NIMs, enterprise inference toolchains) is still under-modeled in many sell-side DCFs.
• Where bulls may be too aggressive:
o China rebound timing & magnitude.
o Power/real-estate constraints delaying deployments into 2026.
o Credit-driven AI capex — watch for any signs of tightening in private credit / neocloud financing that uses GPUs as collateral.
________________________________________
________________________________________
Sources: NVIDIA IR & 10-Q; Yahoo Finance stats; StockAnalysis (TTM financials); company Q2 FY26 press release and CFO commentary; recent analyst notes from KeyBanc, Citi, Barclays, BofA, Morgan Stanley; financial media coverage (WSJ/FT).
CAD-CHF Short From Supply Area! Sell!
Hello,Traders!
CADCHF Price has reacted from a horizontal supply area, showing early signs of distribution. A short-term retracement is expected as liquidity below the recent swing lows gets targeted. Time Frame 2H.
Sell!
Comment and subscribe to help us grow!
Check out other forecasts below too!
Disclosure: I am part of Trade Nation's Influencer program and receive a monthly fee for using their TradingView charts in my analysis.

GBPAUD RISKY LONG|
✅GBPAUD Price created a triple-bottom formation at discount levels, signaling strong bullish rejection from demand. Expect a short-term rally targeting liquidity above the recent highs. Time Frame 2H.
LONG🚀
✅Like and subscribe to never miss a new idea!✅

EURAUD WILL GROW|LONG|
✅EURAUD Price tapped into the demand zone and showed a bullish reaction, confirming short-term accumulation. Expect continuation higher toward the next liquidity pocket near the target zone. Time Frame 2H.
LONG🚀
✅Like and subscribe to never miss a new idea!✅

EUR-GBP Free Signal! Sell!
Hello,Traders!
EURGBP formed a clean double-top structure at premium pricing and broke below the neckline with momentum, signaling bearish intent. The move targets a key imbalance zone below.
-------------------
Stop Loss: 0.8818
Take Profit: 0.8783
Entry: 0.8804
Time Frame: 1H
-------------------
Sell!
Comment and subscribe to help us grow!
Check out other forecasts below too!
Disclosure: I am part of Trade Nation's Influencer program and receive a monthly fee for using their TradingView charts in my analysis.

$ASTER (8-HOUR): STRUGGLING hard, weak ON-CHAIN metricsSEED_WANDERIN_JIMZIP900:ASTER has really been struggling hard for the last 4 weeks now, in a steady DOWNTREND, and some of its on-chain metrics have been looking atrocious.
One example is the TOTAL VALUE LOCKED (TVL), which basically shows commitment to the project. The numbers have been declining since the 10/10 collapse — nearly $2.5B then, and only $1.7B locked now. The token value has declined considerably, but there’s been no growth in TVL, which has a lot to do with the decline in confidence after it turned out their numbers were cooked.
#ASTER revenue and fees are usually well below $2M a day. #Buybacks next, I know — but after those, I would expect a period of “sell-the-news” type action. Open interest numbers also show no growth, just stagnation.
As for the main chart I use for this coin — the 8-HOUR — a BULLISH OBV DIVERGENCE and diminishing volumes are showing early signs of a reversal, but they’re too weak after the last two swing-high rejections off the GOLDEN POCKET (a DOUBLE TOP has formed locally).
The yellow 50 MA is acting as dynamic descending resistance around $1.17. I’m staying neutral-bearish until a HIGHER HIGH above the pocket is established.
This could easily be a WAVE 4 up (negative EW count) before another impulsive move to the downside.
👽💙

Bitcoin Market update!Quick overview on the BTC market right now.
As we rotate down to test the internal range lows, will we get a nice nifty short opportunity or will it be a straight flush down. Lets see ..

XAUUSD Double Top Breakdown and Bearish Flag in PlayGold has completed a double top reversal, hitting its measured target before forming a bearish flag under the key supply zone.
As price remains capped below $4,050–$4,200, bearish momentum could continue toward the $3,700 region, aligning with the flag target.
We should watch the $4,020 POI zone closely any retest and rejection from that area could confirm continuation to the downside.
💬 Share your thoughts below and don’t forget to like & share if this analysis adds value!

$USINTR -Fed Delivers Rate Cut (October/2025)ECONOMICS:USINTR
October/2025
source: Federal Reserve
- The Federal Reserve lowered the federal funds rate by 25 bps to a target range of 3.75%–4.00% at its October 2025 meeting, in line with market expectations.
The move followed a similar cut in September,
bringing borrowing costs to their lowest level since 2022.
Policymakers cited increasing downside risks to employment in recent months while inflation has moved up since earlier in the year and remains somewhat elevated.
The Fed said it will continue to monitor the implications of incoming information for the economic outlook and would be prepared to adjust the stance of monetary policy as appropriate if risks emerge that could impede the attainment of its goals.
In addition, the central bank decided to conclude the reduction of its aggregate securities holdings on December 1.

RENDERWith the AI narrative gaining renewed traction and the broader crypto market expanding, $RENDER is consolidating within a descending channel pattern. A breakout from this structure could present a potential 500% upside from current levels, driven by sector momentum.

$TON (WEEKLY): BEARISH PENNANT breakdown, super OVERSOLDMassive news for the CRYPTOCAP:TON ecosystem as Pavel Durov unveiled #COCOON. Let me start by saying that there are some massive red flags with this blockchain.
Huge monthly unlocks began earlier this month (see attached info): 36.59 million tokens were released on 12 OCT, marking the first of 36 monthly unlocks scheduled over the next 36 months — roughly $80M worth. The next batch is due 11 NOV, two weeks from now.
Another red flag is TON’s general performance this cycle — it has heavily underperformed compared to CRYPTOCAP:ETH , #DeFi tokens, and basically every major category. See the attached graphic in the comments (on X).
Further, on-chain metrics — especially revenues and fees — are disappointing. You’d expect more adoption considering Telegram has nearly a billion users. Nope — the blockchain still struggles to generate meaningful revenue.
Finally, on the weekly chart, CRYPTOCAP:TON remains in a steady downtrend this cycle, with a bearish pennant breakdown in place.
It’s very oversold (RSI ≈ 20) and does show a bullish OBV divergence, though.
The COCOON collaboration does sound exciting, and I’ll research it further — but there are still too many red flags surrounding this layer 1.
Definitely not aping in yet. The charts have to convince me first, not Durov — so, not yet.
💙👽

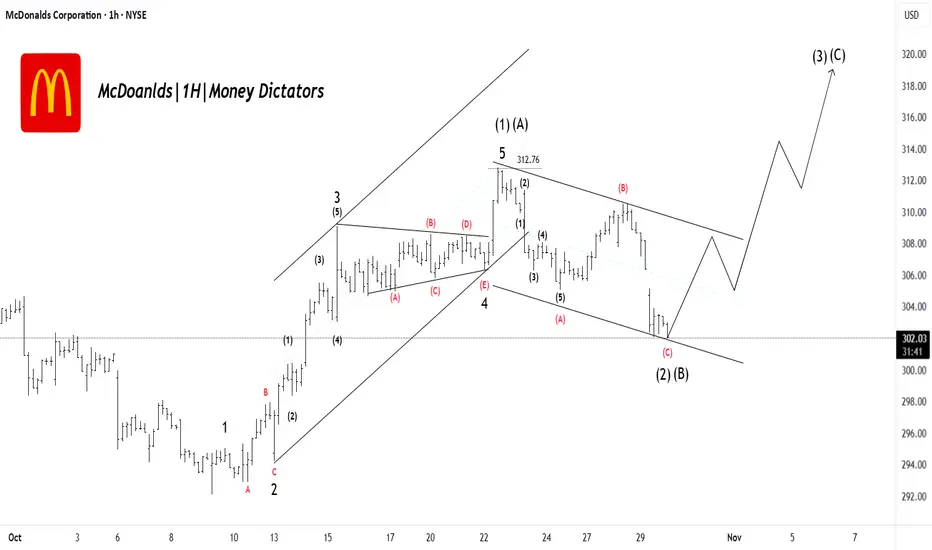
MCD Bulls Loading: Major Wave (3) Move ComingMcDonald’s has completed a clean 5-wave push to the upside, finishing Wave (1)/(A) near the recent high. After that, price entered a corrective channel forming an A-B-C pullback, which now looks close to completing as Wave (2)/(B). The drop is losing momentum near support, suggesting sellers are running out of strength. Once this correction finishes, the chart expects a sharp bullish move into Wave (3)/(C), targeting higher levels above recent highs. In simple terms: correction almost done → strong upside continuation likely.
Stay tuned!
@Money_Dictators
Thank you :)
HSC+SH EUTo accomodate any attempt to reach pre ois high or weekly
Half session confirmation LDN 2nd moving 24 pips, flexed SL 2 pips to give trade breathing space in case atte.pted to reach Weekly high, aligns with DXY movement (reversing against strong holding support line) that might hold for one last time :)

EU Session Low supportlineDXY is hitting resistance line within PL 99.00, entry was delayed a bit, compensated with flexed SL

DAX: Strong Growth Ahead! Long!
My dear friends,
Today we will analyse DAX together☺️
The recent price action suggests a shift in mid-term momentum. A break above the current local range around 24,117.49 will confirm the new direction upwards with the target being the next key level of 24,172.12 and a reconvened placement of a stop-loss beyond the range.
❤️Sending you lots of Love and Hugs❤️

GBP/USD Correction Almost Done: Bulls LoadingGBP/USD has already completed a big corrective structure from the previous high and is now moving inside a complex W-X-Y pattern. The current drop is forming the final C-wave of Wave Y, which suggests the bearish move is close to finishing. Price is likely to dip slightly lower near the support zone before finding buyers again. Once this final leg completes, the chart expects a strong bullish reversal to the upside. In simple terms, one more small drop to finish the correction, then GBP/USD should bounce and start a new uptrend.
Stay tuned!
@Money_Dictators
Thank you :)

SILVER: Will Go Up! Long!
My dear friends,
Today we will analyse SILVER together☺️
The in-trend continuation seems likely as the current long-term trend appears to be strong, and price is holding above a key level of 48.271 So a bullish continuation seems plausible, targeting the next high. We should enter on confirmation, and place a stop-loss beyond the recent swing level.
❤️Sending you lots of Love and Hugs❤️
