GBP/AUD BEST PLACE TO SELL FROM|SHORT
Hello, Friends!
GBP-AUD uptrend evident from the last 1W green candle makes short trades more risky, but the current set-up targeting 2.017 area still presents a good opportunity for us to sell the pair because the resistance line is nearby and the BB upper band is close which indicates the overbought state of the GBP/AUD pair.
Disclosure: I am part of Trade Nation's Influencer program and receive a monthly fee for using their TradingView charts in my analysis.
✅LIKE AND COMMENT MY IDEAS✅
Contains image

EUR/JPY BULLS ARE STRONG HERE|LONG
Hello, Friends!
It makes sense for us to go long on EUR/JPY right now from the support line below with the target of 180.945 because of the confluence of the two strong factors which are the general uptrend on the previous 1W candle and the oversold situation on the lower TF determined by it’s proximity to the lower BB band.
Disclosure: I am part of Trade Nation's Influencer program and receive a monthly fee for using their TradingView charts in my analysis.
✅LIKE AND COMMENT MY IDEAS✅

EU HnLEntry was delayed for two hours to allow EU to react to the support level and allow DXY to hit the fresh NYH resistance level, Overall Bias for DXY is still bearish, DXY is bound to go down and retest 100 before heading up. lets see how this will play

GU SH+PL Mirrored tradeMirroring GU with EU trade with one hour apart, doubling down on DXY reversal up, entry was delayed for a couple of pips due to network error though :(

Lingrid | GBPUSD Potential Short Above PDH ResistanceFX:GBPUSD is approaching the 1.3132 resistance zone again, aligning with the trendline and previous-day highs. Price is still trading inside the consolidation block but remains capped beneath both the PDH level and the broader resistance band — a structure that typically precedes a bearish rotation. With the upward trendline already broken and retested from below, sellers now have a technical advantage.
If intraday momentum stays weak, the market is likely to roll over toward 1.3070 the support area. Only a clean breakout above 1.3132 would neutralize this setup and shift the bias toward a corrective upswing.
➡️ Primary scenario: rejection holds → move toward 1.3070.
⚠️ Risk scenario: breakout above 1.3132 shifts bias toward a bullish corrective phase.
If this idea resonates with you or you have your own opinion, traders, hit the comments. I’m excited to read your thoughts!

CHFJPY: Overbought Market & Pullback 🇨🇭🇯🇵
CHFJPY finally leaves some reversal clues.
I see a confirmed breakout of a daily support with
a high momentum bearish candle.
I think that a correction will continue and the price
will drop at least to 192.75 level
❤️Please, support my work with like, thank you!❤️
I am part of Trade Nation's Influencer program and receive a monthly fee for using their TradingView charts in my analysis.

EURUSD at a Critical Turning Point!EURUSD Analysis – tuseday, November 25
Welcome traders! 👋
I’m glad to have you here — we’re all learning and growing together in this amazing trading journey.
Let’s dive into today’s analysis on EURUSD 👇
As mentioned in the previous analysis, EURUSD remains bearish on the weekly timeframe.
However, on the daily timeframe, price is currently in a decision stage:
If the price breaks the range from above, the bullish trend may continue.
If the price breaks the range from below, market structure will shift back to a stronger bearish trend.
On the 4H timeframe, the market is very choppy, showing consolidation with no clear directional strength.
If price breaks a weak high, bullish continuation becomes likely.
Given this structure, I am watching two main scenarios for today:
Scenario 1 (bullish continuation)
Price sweeps sell-side liquidity below, aligned with the Asia session low.
Price taps into the POI (demand zone).
From the POI, price moves upward toward the OBS, breaking the internal weak high.
After breaking structure, bullish continuation becomes valid.
Scenario 2 (bullish continuation from above)
Price sweeps Asia session high liquidity.
It then taps into the OBS, creating a reaction.
From the OBS, price moves downward toward the POI.
After balancing price and taking liquidity, price pushes upward again and breaks the weak high, continuing bullish.
Important Notes
⚠️ The market is not 100% predictable — always wait for confirmation before taking any entry.
⚠️ Risk management is essential, especially during uncertain, choppy phases.
📌 If you have any questions, drop a comment below.
📘 Educational Note:
This analysis is for educational purposes only. Always follow your trading plan, confirm setups with your strategy, and manage risk carefully.
🚀 Empowering traders through clarity, confidence & clean charts.
Follow 👉 parisa_tl for more SMC setups and weekly insights 💙
#EURUSD #Forex #ForexAnalysis #PriceAction #SmartMoneyConcepts #SMC #Liquidity #OrderBlock #Breakout #FXTrading #ForexTrader #MarketStructure #DayTrading #SwingTrading #TechnicalAnalysis #TraderLife #TradingView #FXMarket #ForexSetups #ForexSignals

ONGC is on good place , keep eyesONGC is on good place , sector is also good . Keep an eye on this stock

PNUT$PNUT looks like it can break out within the next 40 days. The structure is tight, accumulation is clear, and the setup supports a potential 500 percent move to the upside once momentum kicks in. This chart is heating up fast.

MINAIDX:MINA has a great risk to reward setup and the structure is tightening fast. A breakout within the next 60 days is very realistic, and the measured move points to a potential 1500 percent target from the current price. This is a high conviction accumulation zone.

ZKNYSE:ZK looks like it has formed a potential bottom and the structure is stabilizing. From the current price, the setup supports a potential 200 percent move once momentum shifts and the breakout confirms. This is a strong accumulation zone.

EUR/USD – Trade UpdateI have entered a long (buy) position on EUR/USD after an Inducement and a confirmed rejection. This setup now shows a strong entry signal, increasing the probability of a successful trade.

America’s Financial Influence1. The U.S. Dollar as the World’s Reserve Currency
At the heart of America’s financial power is the U.S. dollar, which serves as the world’s primary reserve currency. More than 55–60% of global foreign exchange reserves are held in dollars. This dominance gives the U.S. an unparalleled advantage: countries around the world use the dollar for trade, savings, debt issuance, and investment.
Most global commodities—such as oil, natural gas, gold, soybeans, and metals—are priced in dollars. This means nations must hold dollars to buy essential goods. The global banking system, including SWIFT and major correspondent banks, also relies heavily on dollar settlement.
Because demand for dollars is continuous, the U.S. can borrow cheaply. American government debt (U.S. Treasury bonds) is considered the safest asset in global finance. At times of crisis—whether financial, political, or military—investors flock to U.S. bonds, reinforcing America’s safe-haven status.
2. U.S. Capital Markets: The Deepest and Most Liquid in the World
Another core component of America’s financial influence is its capital markets, which are the largest, most liquid, and most advanced globally. The New York Stock Exchange (NYSE) and Nasdaq dominate global equity trading.
Trillions of dollars from global investors flow into American markets due to:
Transparency and regulatory oversight
High liquidity
Strong corporate governance
Rule of law and investor protections
Foreign governments, sovereign wealth funds, pension funds, and institutions invest heavily in U.S. equities, bonds, and real estate. This constant inflow strengthens the dollar and gives the U.S. significant leverage over global capital movements.
3. The Federal Reserve: The World’s Central Bank
The Federal Reserve (Fed) plays a powerful global role. Its monetary policy decisions—including interest rate changes, liquidity injections, and quantitative easing—affect global exchange rates, capital flows, and economic cycles.
When the Fed raises interest rates, capital tends to flow out of emerging markets into the U.S., strengthening the dollar and creating financial pressure abroad. When it lowers rates, global liquidity increases, supporting investment in riskier markets.
During crises, the Fed often acts as a global lender of last resort by providing dollar swap lines to major central banks. This stabilizes international markets and reinforces the dollar’s dominance.
4. U.S. Financial Institutions and Technology Giants
American banks, investment firms, and technology companies shape global financial behavior. Institutions like:
JP Morgan Chase
Goldman Sachs
Morgan Stanley
Citigroup
BlackRock
Visa & Mastercard
have extensive global networks. These institutions influence capital allocation, cross-border lending, and financial standards worldwide.
Additionally, U.S. tech giants—such as Google, Apple, Microsoft, Amazon, and Meta—control large portions of global digital infrastructure. Their financial weight and strategic investments further entrench America’s economic influence.
5. Global Institutions Built Under U.S. Leadership
Following World War II, the U.S. took a leading role in establishing the global financial architecture. Key institutions such as the:
International Monetary Fund (IMF)
World Bank
World Trade Organization (WTO)
Bank for International Settlements (BIS)
were structured with significant American influence. The U.S. holds the largest voting power in the IMF and World Bank, shaping loan conditions, policy guidelines, and development priorities.
These institutions promote norms that align with U.S. economic philosophies—free markets, open trade, and capital mobility—extending American influence far beyond its borders.
6. Military Strength and Geopolitical Power
Economic influence is closely connected to military power. The U.S. maintains the world’s most advanced military, securing global trade routes and ensuring confidence in the stability of international commerce.
Key strategic advantages include:
Control of maritime chokepoints through military partnerships
Intelligence and cybersecurity capabilities
A network of global alliances (NATO, Japan, South Korea, Australia, etc.)
Stable global trade ensures consistent demand for the dollar and allows the U.S. to project both financial and diplomatic influence.
7. American Multinational Corporations and Soft Power
American brands—such as Coca-Cola, McDonald’s, Nike, Apple, Boeing, Tesla—operate in nearly every country.
Their success brings:
Global capital back into U.S. markets
Influence over global consumer behavior
Strength to the U.S. corporate bond and equity markets
Soft power—through movies, media, education, and culture—also enhances America’s attractiveness to global investors.
8. U.S. Sanctions and the Power of the Dollar System
Because the dollar dominates global payments, the U.S. can impose powerful economic sanctions. Countries, banks, and companies that violate U.S. guidelines can be denied access to the dollar system, essentially disconnecting them from global trade.
This gives America significant geopolitical leverage. Sanctions on Iran, Russia, and various corporations demonstrate how economic pressure can shape international behavior.
No other nation currently has the same level of financial coercive power.
9. Innovation and Leadership in Finance
America leads in:
Venture capital
Fintech innovation
Blockchain development
Artificial intelligence in finance
High-frequency trading
Global credit rating agencies (S&P, Moody’s, Fitch)
These innovations attract entrepreneurs and investors from around the world, reinforcing the centrality of U.S. financial systems.
10. Challenges to American Financial Dominance
While America maintains strong influence, some challenges are emerging:
China’s growing economic power
Efforts toward de-dollarization
Expansion of BRICS currency mechanisms
Growth of digital currencies and blockchain alternatives
Geopolitical tensions and shifts in global alliances
However, none of these currently match the scale, trust, liquidity, or institutional strength of the U.S. financial system.
Conclusion
America’s financial influence is the product of a powerful combination: the dominance of the U.S. dollar, vast capital markets, the global authority of the Federal Reserve, deep geopolitical networks, influential corporations, military strength, and a long-standing reputation for economic stability. Even as global dynamics shift and new powers emerge, the United States remains the central pillar of global finance. Its currency, institutions, innovation ecosystem, and strategic advantages ensure that American influence continues to shape economic decisions, trade flows, investment patterns, and geopolitical outcomes across the world.

Reserve Currency Dominance in Global Trade1. What Is a Reserve Currency?
A reserve currency is a foreign currency held in significant quantities by central banks and financial institutions. It is used for:
International trade invoicing
Cross-border payments
Foreign exchange interventions
Investment in global assets
Storing national wealth
To serve as a reserve currency, it must be stable, widely accepted, highly liquid, and backed by strong institutions.
2. Why Some Currencies Become Dominant
A dominant reserve currency does not emerge overnight. It is built through decades of economic, political, and financial advantages. Historically, currencies like the British pound during the 19th century and the U.S. dollar after World War II gained dominance because:
A. Economic Size and Influence
The issuing country must be a major economic power.
The U.S. economy is one of the world’s largest.
Its deep financial markets attract global investors.
When an economy is big, its currency naturally becomes widely used because global businesses want access to that market.
B. Trust and Stability
Reserve currency users expect:
Stable inflation
Strong legal systems
Predictable governments
Transparent financial institutions
Countries hesitate to store reserves in a currency if the issuing government is unstable or unpredictable.
C. Deep and Liquid Financial Markets
Liquidity means assets can be bought or sold easily.
U.S. Treasury bonds are considered the safest and most liquid assets on Earth.
This makes the dollar extremely convenient for global central banks and funds.
D. Network Effects
The more people use a currency, the more others are forced to use it.
It becomes a self-reinforcing cycle:
“Everyone uses the dollar because everyone else uses the dollar.”
3. The Dollar’s Dominance in Global Trade
The U.S. dollar accounts for:
Around 60% of global forex reserves
Nearly 90% of forex transactions
More than 50% of global trade invoicing
Even countries that don’t trade with the U.S. often settle in dollars. For example:
Oil, metals, and agricultural commodities are mostly priced in dollars.
Many international loans and bonds are issued in dollars.
This dominance creates a uniform standard in global transactions and reduces exchange rate risks.
4. How Reserve Currency Dominance Shapes Global Trade
A. Trade Pricing and Invoicing Power
When most global goods are priced in a single currency, it simplifies international trade.
Businesses avoid complex exchange-rate conversions and hedge only against dollar fluctuations.
For example:
India buys crude oil from Saudi Arabia in dollars, not rupees.
Japan buys Brazilian iron ore in dollars, not yen.
This standardization reduces friction in supply chains.
B. Lower Borrowing Costs for the Dominant Currency Country
Because demand for the reserve currency is high, the issuing country can borrow at lower costs.
The U.S. government benefits enormously from this:
Foreign countries buy trillions of dollars in U.S. bonds.
This demand keeps U.S. interest rates lower than they otherwise would be.
Some economists call this the “exorbitant privilege.”
C. Increased Global Influence
Countries that depend on the dollar become sensitive to U.S. policies.
For example:
U.S. sanctions become far more effective because they limit access to the global financial system dominated by the dollar.
Reserve currency dominance therefore increases geopolitical power.
D. Exchange Rate Spillovers
When the dollar strengthens:
Global importers face higher costs
Emerging markets see increased currency volatility
Countries with dollar-denominated debt struggle
Dollar cycles heavily influence global commodity prices and capital flows.
5. Benefits for the Issuing Country
A. Global Demand for Its Assets
Other countries must hold dollar assets (bonds, stocks, etc.) to participate in global trade.
This inflow of foreign capital boosts:
U.S. financial markets
Investment
Corporate growth
B. Ability to Run Larger Deficits
The U.S. can print dollars and borrow cheaply.
This allows:
Higher government spending
Larger trade deficits
A strong consumer economy
Countries with non-reserve currencies don’t enjoy such flexibility.
C. Strong Geopolitical Leverage
The U.S. can limit access to:
SWIFT
Dollar clearing banks
U.S.-based financial institutions
This gives it unmatched diplomatic influence.
6. Challenges and Risks of Reserve Currency Dominance
A. Global Dependence on a Single Currency
Overreliance on the dollar exposes the world to U.S. economic cycles.
A strong dollar can cause:
Global recessions
Debt crises in emerging markets
Commodity price spikes
B. Vulnerability to U.S. Policies
Countries trading in dollars become exposed to:
U.S. interest rate changes (Federal Reserve policy)
Political sanctions
Dollar liquidity shortages
C. Internal Weakness in the Dominant Country
A country with a reserve currency might experience:
Overvalued currency
Loss of export competitiveness
Higher trade deficits
This is sometimes called the Triffin Dilemma.
D. Shift in Global Power Balance
As emerging economies grow, the dominance of a single currency may decline.
China’s yuan, Europe’s euro, or even digital currencies could dilute dollar power in the future.
7. Possible Contenders to Replace or Challenge the Dollar
A. The Euro
Strengths:
Large economic base
Strong institutions
Weaknesses:
Fragmented political structure
Debt issues in some member states
B. The Chinese Yuan
Strengths:
World’s second-largest economy
Rising global influence
Weaknesses:
Capital controls
Limited convertibility
Concerns over regulatory transparency
C. Digital Currencies and CBDCs
Central bank digital currencies (CBDCs) could change settlement systems.
However, widespread trust and adoption are still uncertain.
8. The Future of Reserve Currency Dominance
While the dollar remains dominant, global trends suggest:
Gradual diversification of reserves
Increased regional currencies in trade
Rise of digital settlement networks
Efforts by China and Middle East economies to reduce dollar dependence
But a complete shift away from the dollar is unlikely in the near future because:
No alternative matches its liquidity and trust.
Global markets remain heavily dollar-centric.
Any transition, if it occurs, will be slow and multi-polar.
Conclusion
Reserve currency dominance is a powerful global economic force that shapes international trade, investment flows, geopolitical strategies, and financial stability. The U.S. dollar currently holds an unmatched position due to its liquidity, trust, broad acceptance, and the strength of U.S. institutions. Although challenges such as de-dollarization, digital currencies, and the rise of other economies exist, the dollar’s dominance is supported by decades of structural advantages. Understanding this dynamic is essential for countries, investors, businesses, and policymakers participating in an increasingly interconnected global system.

Introduction to Central Bank Digital Currency Systems (CBDCS)What is a CBDC?
A CBDC is a digital version of a country's official currency issued and controlled by its central bank. Unlike cryptocurrencies such as Bitcoin, which operate on decentralized networks without government oversight, CBDCs are fully regulated, centralized, and legally recognized tender. They combine the stability of government-backed money with the speed and convenience of digital payment systems.
CBDCs should not be confused with existing digital banking transactions. Today, when individuals transfer money online, the transaction represents a claim on commercial banks. A CBDC represents a direct claim on the central bank, just like cash, making it risk-free, sovereign money.
Why Are CBDCs Emerging Now?
Multiple forces are driving the global interest in CBDCs:
1. Declining Cash Usage
In many countries, the use of cash for everyday transactions has sharply dropped due to digital wallets, UPI-like systems, and online commerce. CBDCs offer a state-backed digital alternative to preserve national currency sovereignty.
2. Rise of Private Cryptocurrencies and Stablecoins
Cryptocurrencies introduced programmable money and borderless payment possibilities. Governments fear that widespread adoption of private digital currencies could weaken monetary control. CBDCs provide a regulated alternative with comparable digital capabilities.
3. Need for Faster, More Efficient Payment Systems
Cross-border transfers remain expensive and slow. CBDCs can make payments cheaper, instantaneous, and more transparent.
4. Financial Inclusion
CBDCs can reach unbanked populations by offering digital wallets that do not require traditional bank accounts.
5. Enhanced Monetary Policy Tools
CBDCs allow central banks to manage liquidity and money supply more precisely, potentially even enabling direct stimulus to citizens.
Types of CBDCs
CBDCs are generally categorized into two forms:
1. Retail (General Purpose) CBDCs
These are designed for use by the public—consumers, merchants, and businesses.
They function similarly to digital cash and can be used for daily transactions, remittances, and savings.
Key features:
Accessible to all citizens
Held in digital wallets
Used for everyday payments
May or may not require bank accounts
2. Wholesale CBDCs
These are restricted for financial institutions, used in interbank transfers and settlements.
Key features:
Enhances efficiency of clearing and settlement
Improves liquidity management
Reduces counterparty and settlement risks
While retail CBDCs affect the broader economy and people’s daily lives, wholesale CBDCs focus more on improving institutional financial systems.
Core Components of a CBDC System
A Central Bank Digital Currency System relies on several foundational elements to maintain security, efficiency, and reliability:
1. Digital Ledger Technology (DLT)
CBDCs may operate on blockchain or traditional centralized databases. Not all CBDCs are blockchain-based, but DLT offers benefits like transparency, immutability, and programmability.
2. Digital Wallet Infrastructure
Users store and transact CBDCs using secure mobile or hardware wallets. Wallets may be custodial (managed by banks) or non-custodial (self-managed by users).
3. Identity and KYC Frameworks
CBDCs incorporate strong identity verification to prevent fraud, money laundering, and illicit transactions. Digital IDs, biometrics, and multi-factor authentication play an essential role.
4. Cybersecurity Architecture
Ensuring protection against hacking, data breaches, and systemic digital threats is fundamental. Resilience must match or exceed existing banking infrastructure.
5. Offline Transaction Capability
Many CBDC designs include offline payment features to allow transactions without internet access—crucial for rural regions or during network outages.
Advantages of CBDCs
CBDCs offer numerous economic and social benefits:
1. Reduced Transaction Costs
Digital payments through CBDCs eliminate intermediaries, lowering fees for individuals and businesses.
2. Faster Cross-Border Transactions
CBDCs can revolutionize international payments by enabling instantaneous and cost-efficient transfers.
3. Increased Financial Inclusion
People without bank accounts can access CBDCs through mobile wallets, making financial systems more inclusive.
4. Enhanced Transparency and Reduced Fraud
CBDC transaction trails can help reduce corruption, black markets, and tax evasion while still preserving controlled privacy.
5. Improved Monetary Policy Implementation
CBDCs give central banks new tools, including direct digital stimulus or programmable interest rates.
6. Resilience in Payment Systems
CBDCs provide backup infrastructure during failures in traditional banking or payment networks.
Challenges and Risks
Despite their potential, CBDCs present several issues that policymakers must address:
1. Privacy Concerns
One of the biggest public concerns is that government oversight of digital transactions may infringe on personal privacy. Balancing transparency and anonymity is a major design challenge.
2. Banking Sector Disruption
If consumers shift funds from banks to CBDC wallets, banks may face liquidity shortages, impacting their ability to lend. This risk may require limits on CBDC holdings.
3. Cybersecurity Threats
A successful cyberattack on a CBDC platform could have catastrophic consequences. Thus, robust digital protection is essential.
4. Implementation Costs
Developing, maintaining, and upgrading CBDC systems require significant financial and technological investment.
5. Interoperability Issues
Global coordination is needed to ensure CBDCs from different countries can interact smoothly for cross-border transactions.
Global Developments in CBDCs
Many countries are actively researching or implementing CBDCs:
China’s e-CNY is the most advanced large-scale CBDC, already used by millions.
India’s Digital Rupee (e₹) is under pilot testing for both retail and wholesale use.
The Bahamas’ Sand Dollar was one of the first fully launched CBDCs.
The European Union is exploring a Digital Euro.
The U.S. Federal Reserve continues researching but has not committed to implementation.
More than 100+ countries are currently investigating CBDCs, highlighting global momentum.
The Future of CBDC Systems
CBDCs are poised to reshape the global financial architecture. Over the next decade, digital currencies may become the primary medium for domestic payments, while cross-border CBDC corridors could make international finance faster and more efficient. Their integration with programmable smart contracts could also unlock new possibilities, such as automated tax collection, real-time subsidies, and highly secure corporate transactions.
However, the future adoption rate will depend on how well central banks address privacy, security, and economic risks. CBDCs must deliver convenience and trust without compromising individual freedoms or financial stability.

Are Derivatives Powerful in the Global Trade Market?1. What Are Derivatives?
A derivative is a financial contract whose value is derived from an underlying asset. This asset could be:
Commodities like crude oil, gold, wheat, natural gas
Currencies such as USD, EUR, JPY
Equity indices like Nifty 50, S&P 500
Interest rates such as LIBOR or government bond yields
Credit instruments like corporate bonds
The most common derivatives include:
Futures
Options
Swaps
Forward contracts
In the global trade market, derivatives’ primary purpose is risk transfer, although they are also used for speculation and arbitrage.
2. The Global Influence of Derivatives
Risk Management Backbone of Global Trade
Global trade is full of uncertainties—currency fluctuations, commodity price volatility, geopolitical tensions, supply chain disruptions, and interest rate changes. Derivatives serve as insurance-like tools that allow participants to lock in future prices, hedge risks, or stabilize cash flows.
For example:
An airline company hedges jet fuel futures to protect against rising crude prices.
An importer hedges currency risk using forex forwards to avoid losses if the dollar rises.
Exporters use options to protect against weakening foreign currencies.
Without derivatives, global trade would be significantly more dangerous and unpredictable.
3. Derivatives and Commodity Markets
Commodity derivatives such as oil futures, agricultural futures, and metal contracts are essential in global trade.
Why are commodity derivatives powerful?
Price Discovery
Derivatives markets reflect real-time global supply and demand conditions. Oil prices, for example, are heavily influenced by futures traded on major exchanges.
Stabilizing Prices for Producers and Consumers
Farmers hedge crop prices to secure income; manufacturers lock in raw material prices to control costs.
Enhancing Global Trade Flows
Multinational companies plan procurement and distribution based on futures price signals.
Reducing Market Manipulation
Transparent derivative markets help in curbing cartel behavior and monopolistic pricing.
Thus, commodity derivatives are one of the strongest tools that keep global trade systems efficient and predictable.
4. Currency Derivatives – The Engine of Cross-Border Commerce
In global trade, currency fluctuations can make or break profitability. A stable currency environment is a dream, but not the reality. Hence, forex derivatives are widely used.
How currency derivatives empower global trade?
Hedging exchange rate risks
Importers/exporters use forwards, futures, and options to secure exchange rates.
Supporting multinational operations
Corporations manage exposure across dozens of currencies simultaneously.
Providing liquidity to global markets
Forex derivatives markets are the largest in the world, with trillions traded daily.
Enhancing financial stability
Countries with export-driven economies rely on currency derivatives to prevent economic shocks.
Currency derivatives act as the hidden shield that protects companies and nations from unpredictable foreign exchange swings.
5. Interest Rate Derivatives – The Heart of Financial Stability
Because interest rates influence the cost of borrowing globally, interest rate swaps and futures form the backbone of global financial markets.
Their key powers include:
Helping governments manage debt.
Allowing banks to hedge interest rate exposure.
Enabling corporations to stabilize borrowing costs.
Ensuring smoother global credit flow.
Without interest rate derivatives, global financing would be far riskier, costlier, and more unstable.
6. Derivatives as Speculative and Profit-Making Instruments
While derivatives are risk-management tools, their power also comes from:
Speculation
Traders take positions on future market movements to earn profits. This:
Increases market liquidity
Enhances price discovery
Draws global capital into trade markets
However, speculation can also increase volatility if unchecked.
Arbitrage Opportunities
Derivatives allow traders to exploit price differences in different markets:
Spot vs futures
Domestic vs international exchanges
Currency arbitrage
Commodity pricing discrepancies
Arbitrage ensures that global markets remain efficient and interconnected.
7. How Derivatives Strengthen Global Market Efficiency
Derivatives contribute to global trade in several powerful ways:
A. Increased Liquidity
Markets with high liquidity:
Reduce transaction costs
Facilitate smoother trade
Attract global investors
Improve pricing accuracy
Derivative markets like CME, ICE, NSE, LME, and SGX provide massive liquidity to commodities, currencies, and equities.
B. Better Price Stability
Derivatives reduce sharp price swings, especially in commodities and currencies. This is essential for long-term contracts and procurement.
C. Improved Risk Sharing
Derivatives distribute risks across participants:
Hedgers transfer risk
Speculators accept risk
Arbitrageurs eliminate inefficiencies
This creates a smooth ecosystem for global trade.
D. Facilitation of Global Investments
Investors use derivatives to:
Hedge portfolio risks
Gain exposure to foreign markets
Manage geopolitical risks
This flow of capital boosts global trade volumes.
8. Challenges and Risks of Derivatives
Even though derivatives are powerful, they also have downsides:
1. High leverage risk
Small price movements can cause large profits or losses.
2. Systemic risk
Excessive derivatives trading contributed to crises such as:
2008 Global Financial Crisis
LTCM collapse
Oil futures flash crashes
3. Complexity
Sophisticated instruments like credit default swaps (CDS) are difficult to understand.
4. Counterparty risk
Failure of one party can create a chain reaction.
Despite these risks, regulatory reforms and clearinghouses have made derivative markets safer and more transparent.
9. The Future of Derivatives in Global Trade
Derivatives are becoming more powerful due to:
Digital platforms and electronic trading
AI-driven risk models
Expansion of global markets (India, China, ASEAN)
Growth in commodity and currency volatility
Rise of ESG and carbon credit derivatives
The next decade will see derivatives become even more integrated with global supply chains, energy markets, and financial systems.
Conclusion
Yes, derivatives are extremely powerful in the global trade market. They are not merely financial instruments but essential tools that support world commerce by:
Managing risks
Stabilizing prices
Enhancing liquidity
Improving efficiency
Supporting international investments
Strengthening financial stability
From farmers to oil companies, from banks to governments, derivatives underpin decisions and strategies across the global trade ecosystem. Without them, global markets would be less predictable, less efficient, and far more vulnerable to shocks.
Competitive Currency Wars1. What Are Competitive Currency Wars?
A currency war begins when one country deliberately devalues its currency to make its exports cheaper and imports more expensive. This leads to:
Higher export competitiveness
Increased domestic production
Potential rise in GDP
Shift of trade deficits toward trade surpluses
However, once one major trading nation devalues its currency, others often follow suit to protect their trade position. This spiral of competitive devaluations becomes a “race to the bottom”, destabilizing capital flows and weakening global financial stability.
Currency wars are rarely declared openly. They typically unfold through monetary policy, interest rate cuts, quantitative easing, or direct market intervention.
2. Why Countries Engage in Currency Wars
A. To Boost Exports
A weak currency makes domestic products cheaper for foreign buyers. Export-driven economies—like Japan, China, and South Korea—often use currency policy to support global sales.
B. To Reduce Trade Deficits
Countries facing large trade deficits (like the U.S. historically) often accuse trading partners of manipulating exchange rates.
C. To Encourage Domestic Industrial Growth
Lower currency value attracts manufacturing demand, protects domestic industries, and supports job creation.
D. To Stimulate Inflation
If an economy is facing deflation (falling prices), a weaker currency increases import prices, pushing inflation into the system.
E. To Manage Debt Burden
A weaker currency reduces the real value of domestic debt, making repayment easier.
3. Key Tools Used in Currency Wars
Countries deploy several policy mechanisms to weaken or control exchange rates:
1. Monetary Policy (Interest Rates)
Lower interest rates reduce returns on investments in that currency, leading to capital outflow and depreciation. Central banks often use rate cuts to support domestic credit growth and weaken currency value.
2. Quantitative Easing (QE)
Central banks inject liquidity by buying government and corporate bonds. More money in circulation generally lowers currency value.
The U.S. Federal Reserve used QE heavily after the 2008 crisis.
Japan’s “Abenomics” relied on aggressive QE to weaken the yen.
3. Direct Currency Market Intervention
Central banks buy or sell foreign currency reserves to influence the local exchange rate.
Example: The People’s Bank of China has historically bought dollars to keep the yuan weaker.
4. Capital Controls
Governments may restrict money inflows or outflows to protect their currency from appreciation or depreciation.
5. Trade Tariffs and Economic Policies
Though not direct currency tools, such measures often accompany or provoke currency wars.
4. Historical Examples of Currency Wars
A. The Great Depression (1930s)
Countries abandoned the gold standard and devalued their currencies to gain export advantages. This period is often called the first modern currency war.
B. The Asian Financial Crisis (1997–98)
Thailand, Indonesia, and South Korea saw massive currency depreciations. Competitive moves followed as neighboring economies attempted to maintain trade competitiveness.
C. The U.S. vs China (2000s–2010s)
China was accused of keeping the yuan artificially low to boost exports. Tensions peaked around 2010–2015, intensifying global currency debates.
D. Post-2008 Global Financial Crisis
Massive global QE programs triggered competitive devaluations:
U.S. dollar weakened due to QE
Japan pushed yen down via Abenomics
Emerging markets reacted to defend their own currencies
This period is considered a modern example of global currency war dynamics.
5. How Currency Wars Affect the Global Economy
Competitive currency wars may offer short-term growth benefits to some nations, but they carry significant risks. Their impacts spread across:
A. Trade Balances
A weaker currency increases exports and reduces imports, but if multiple countries devalue simultaneously, the net effect becomes negligible. This leads to global trade instability.
B. Global Investment Flows
Currency uncertainty discourages foreign investment. Investors prefer stable currencies and predictable returns; currency wars increase volatility.
C. Inflation and Purchasing Power
Devalued currency raises import prices, leading to inflation. While mild inflation can stimulate growth, uncontrolled inflation reduces public purchasing power.
D. Commodity Prices
Commodities like oil, gold, and metals are dollar-denominated. If major currencies weaken:
Commodity prices rise in local currency
Import-dependent nations face higher costs
E. Stock Markets and Bonds
Currency weakening often boosts domestic stock markets as export-driven companies benefit. However, government bond markets may suffer due to capital outflows.
F. Geopolitical Tensions
Accusations of currency manipulation can escalate into:
Trade wars
Tariff battles
Diplomatic standoffs
For example, U.S.–China tensions over exchange rates influenced global trade policy for years.
6. Benefits of Currency Wars (Short-Term)
1. Export Boost
Helps domestic manufacturers stay competitive.
2. Economic Growth
Weaker currency can ignite growth during stagnation.
3. Job Creation
Export-dependent industries grow employment.
4. Debt Management
Real debt burden reduces with depreciation.
7. Risks and Long-Term Costs of Currency Wars
1. Global Instability
Currency wars destabilize global financial markets.
2. Retaliatory Devaluations
One country's move triggers others, amplifying volatility.
3. Imported Inflation
Higher prices for imported goods hurt consumers.
4. Financial Market Distortions
Capital flight, volatile stock markets, unstable bond yields.
5. Loss of Investor Confidence
If investors expect sustained devaluation, they withdraw capital.
6. Trade Conflicts
Countries may impose tariffs or sanctions, damaging global trade.
8. Are We in a Currency War Today?
In recent years, global economic conditions—such as rising U.S. interest rates, geopolitical tensions, inflation cycles, and post-pandemic stimulus—have created conditions resembling a currency war environment. Central banks are aggressively adjusting policies, and exchange-rate competition is visible among major economies like the U.S., China, Japan, and Europe.
9. Conclusion
Competitive currency wars represent a complex interplay of economics, politics, and global finance. While currency devaluation can offer short-term advantages such as export growth and inflation management, the long-term consequences often outweigh the benefits. Currency wars can ignite international tensions, distort global markets, and create instability for investors, consumers, and policymakers alike.
In a deeply interconnected world, sustainable economic growth depends more on cooperation than competitive devaluations. Countries must balance domestic priorities with global responsibilities, as excessive currency competition can ultimately harm all players in the global economic system.

De-Dollarization and Currency Wars1. Understanding De-Dollarization
What Is De-Dollarization?
De-dollarization refers to the global movement to reduce reliance on the U.S. dollar in international trade, investments, foreign reserves, and global transactions. It includes:
Trading commodities in local currencies
Building reserve pools using alternative currencies
Developing rival payment systems
Creating digital or regional currency blocs
This shift is driven by both economic necessity and geopolitical strategy.
2. Why Is De-Dollarization Happening?
While the U.S. dollar remains extremely powerful, several factors are pushing countries—especially emerging economies—to explore alternatives.
(a) Geopolitical Pressures and Sanctions
U.S. sanctions have targeted countries like Russia, Iran, and Venezuela. These nations view the dollar as a vulnerability, because their access to global finance can be blocked.
This has motivated them to:
Use yuan, ruble, or local currencies for trade
Build alternative payment routes
Increase gold reserves
(b) Rising Economic Power of Asia
China’s economic rise is a major catalyst. With its massive manufacturing and consumption base, China can negotiate trade in yuan. Initiatives like the Belt and Road also push partner nations toward the yuan.
(c) Diversifying Risk
The dollar’s strength can hurt emerging markets. For example:
When the dollar rises, global borrowing costs increase
Developing countries suffer currency depreciation
Trade deficits worsen
To protect themselves, nations diversify into euros, gold, or local currencies.
(d) Digital Currencies and Technology
The growth of:
Central Bank Digital Currencies (CBDCs)
Blockchain settlement systems
Instant cross-border payment networks
…allows countries to bypass traditional dollar-based financial pipes.
(e) The U.S. Debt Burden
The U.S. carries huge national debt. Some nations fear long-term currency devaluation or inflation, encouraging them to reduce their dollar exposure.
3. Methods of De-Dollarization
Countries use multiple strategies to reduce dollar dependence.
(a) Bilateral Trade in Local Currencies
Examples include:
India–Russia trade in INR
China–Brazil trade in CNY
Gulf nations exploring yuan-based oil trade
(b) Increasing Gold Reserves
Central banks worldwide have been buying gold aggressively as a non-dollar store of value.
(c) Regional Currency Blocs
Initiatives like:
BRICS currency basket
Gulf digital currencies
Asian currency corridors
…aim to create shared alternatives.
(d) Payment System Alternatives
To bypass SWIFT, countries develop systems like:
China’s CIPS
Russia’s SPFS
India’s RuPay and UPI-based cross-border links
(e) Digital Settlements for Trade
CBDCs allow nations to settle trade instantly without using dollars.
4. What Are Currency Wars?
Currency wars occur when countries deliberately influence their exchange rates to gain a competitive advantage in global trade.
A currency war typically involves:
Devaluing local currency to boost exports
Printing more money (quantitative easing)
Lowering interest rates
Using tariffs or capital controls
Strategic buying/selling of foreign currencies
Currency wars create global tension and can destabilize markets.
5. Why Do Currency Wars Happen?
(a) Boost Export Competitiveness
A weaker currency makes exports cheaper. Export-driven economies like China, Japan, and South Korea have historically used currency policies to support growth.
(b) Counter Inflation or Recession
Central banks may adjust currency values to manage domestic crises.
(c) Respond to Competitor Moves
If one country lowers its currency value, others may retaliate to protect their trade advantage.
(d) Geopolitical Rivalries
Nations may use currency strategies as part of broader political conflicts.
6. How De-Dollarization Leads to Currency Wars
Though separate concepts, de-dollarization and currency wars interact in powerful ways.
(a) Diversification Creates Volatility
As countries move out of dollars into other currencies, fluctuations increase. This can trigger competitive devaluations.
(b) New Currency Blocs Compete for Influence
For example:
Dollar vs. Yuan
Dollar vs. Euro
BRICS vs. G7 systems
Such competition can escalate into currency conflicts.
(c) Trade in Local Currencies Reduces Dollar Liquidity
This weakens dollar dominance, prompting the U.S. to defend its currency through monetary tightening.
(d) Interest Rate Wars
Countries may raise or cut rates to control capital flows. This can set off a chain reaction across economies.
7. Impacts of De-Dollarization on the Global Market
(a) More Currency Options for Trade
Countries gain flexibility in trade agreements.
(b) Reduced Dollar Monopoly
While the dollar remains strong, alternatives weaken its monopoly.
(c) Growth of Regional Economic Blocs
Asia, the Middle East, and BRICS strengthen through local-currency arrangements.
(d) Decline of U.S. Financial Influence
U.S. sanctions and policies become less effective as countries establish independent systems.
(e) Increased Use of Gold and Digital Currencies
Both are emerging as major global reserves.
8. Impacts of Currency Wars
Currency wars create instability in global markets.
Positive Effects (for some nations)
Boosts exports
Attracts foreign investment
Increases competitiveness
Negative Effects (for the world)
Higher inflation
Volatile foreign exchange markets
Trade conflicts
Uncertainty in commodity prices
Global recession risk
Emerging economies are especially vulnerable, as they face rapid capital outflows when major currencies fluctuate sharply.
9. The Future: Will the Dollar Lose Its Dominance?
The dollar is still extremely powerful because:
Most global reserves are in dollars
Oil is mainly priced in dollars
U.S. markets are deep and liquid
Investors trust U.S. institutions
However, the trend toward de-dollarization is real, and over time:
The world may shift from “dollar dominance” to “multi-currency coexistence”
Trade may use baskets of currencies
Digital currencies may reduce dependence on any single currency
BRICS and Asian regions may emerge with stronger financial systems
The dollar will not disappear, but its share of global influence will gradually decline.
Conclusion
De-dollarization and currency wars are two powerful forces reshaping the global economic order. While de-dollarization seeks to diversify the global financial system away from the dollar, currency wars reflect nations’ battles to gain economic advantage through strategic currency manipulation. Together, they represent a shift from a unipolar, dollar-centric world toward a more multipolar, competitive, and technologically driven financial landscape. The transition will not be smooth, but it signals a new era where global power will increasingly depend on currency strategies, digital innovation, and regional cooperation.

Hbar potential of explosion 20% toward 0.2150$Hi the support and resistances on the chart are based on the previous data and weekly candlesticks if BINANCE:HBARUSDT holds this last support the potential of 20% gain is logical toward 0.2150$

30% gain for Pump is logicalhi
the support and resistances on the chart are based on the previous data and weekly candlesticks if BYBIT:PUMPUSDT holds this last support the potential of 30% gain is logical toward 0.005555$

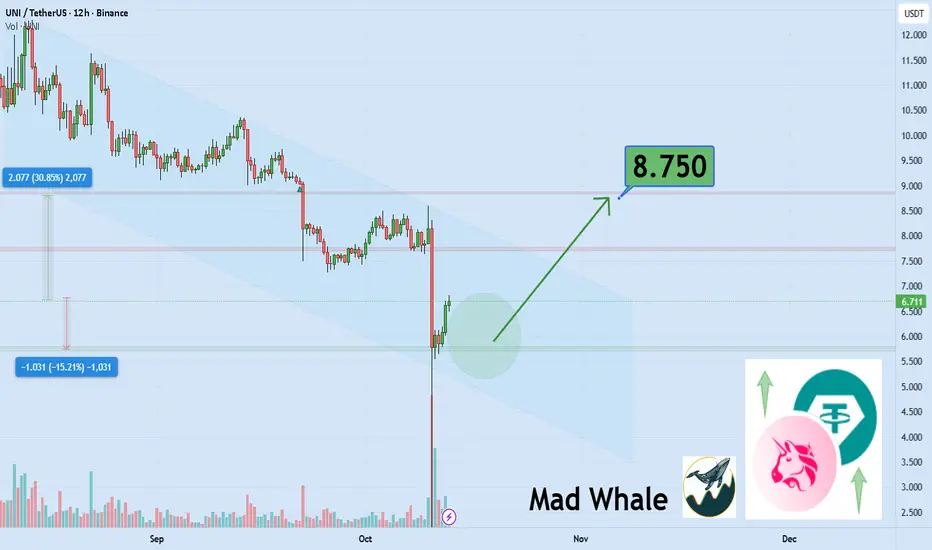
support area for Uni explosion of at least 30% gain to 8.75$hi
the support and resistances on the chart are based on the previous data and weekly candlesticks if BINANCE:UNIUSDT holds this last support the potential of 30% gain is logical toward 8.75$
Currency Peg Rates and Their Role in the Global Market1. What Are Currency Pegs?
A currency peg is an agreement by a government or central bank to maintain its currency at a fixed exchange rate relative to another currency. Common anchors include:
US Dollar (USD) – most dominant
Euro (EUR) – used by countries in Europe or those influenced by EU trade
A basket of currencies – used by nations wanting diversified stability
Examples include:
Hong Kong dollar peg to USD
Saudi riyal peg to USD
Danish krone peg to Euro
In a pegged system, the central bank must intervene in the forex market—buying or selling foreign reserves—to maintain the peg.
2. Why Countries Use Currency Pegs
A. To Promote Trade Stability
Trade depends heavily on predictable currency values. When a country pegs its currency to that of a major trading partner, exporters and importers face fewer exchange-rate risks. This stability helps:
Boost long-term trade agreements
Encourage foreign direct investment (FDI)
Reduce transaction costs
For example, Gulf countries selling oil in USD benefit from a USD peg since their export revenues stay stable.
B. To Control Inflation
Countries with historically volatile monetary systems use pegs to “import stability” from stronger economies. Pegging to a disciplined currency forces domestic monetary policy to align with the anchor country’s stability. This helps:
Reduce hyperinflation
Maintain price stability
Build investor trust
Argentina, for instance, used a USD peg in the 1990s to curb runaway inflation.
C. To Attract Foreign Investment
Foreign investors prefer stable exchange rates. Pegs give clarity and reduce forex risk, which is appealing for:
Portfolio investors
Foreign companies setting up factories
Global banks
Stable currencies reduce uncertainty and encourage long-term investment.
D. To Protect Small or Open Economies
Small economies with limited export diversity or unstable political environments benefit greatly from a fixed currency. Pegs help maintain:
Financial order
Market confidence
Predictable business conditions
This is why many island nations and resource-dependent economies use fixed exchange rates.
3. How Currency Pegs Work in the Global Market
A. Central Bank Intervention
To maintain the peg, the central bank must buy or sell foreign reserves.
If the domestic currency weakens, the central bank sells foreign reserves to support it.
If it strengthens, the central bank buys foreign currency to prevent appreciation.
This mechanism keeps the domestic currency within a defined band.
B. The Role of Foreign Exchange Reserves
Countries with pegs must maintain large forex reserves. These reserves act as a buffer to defend the peg during market volatility.
China, Saudi Arabia, and Hong Kong maintain significant reserves for this reason.
C. Impact on Global Capital Flows
Pegs influence how money moves across borders. A stable peg can attract capital inflows, while a weak or unsustainable peg can trigger:
Speculative attacks
Rapid capital outflows
Market panic
The 1997 Asian Financial Crisis is a classic example where unsustainable fixed rates caused speculative attacks.
4. Advantages of Currency Pegs in the Global Market
A. Stability for Trade and Investment
Currency pegs reduce exchange-rate volatility, supporting international trade and long-term contracts.
B. Confidence Building
Investors and trading partners trust economies whose currencies behave predictably.
C. Lower Inflation
Pegs can anchor domestic prices to those of more stable economies.
D. Strategic Trade Advantages
Countries can peg at undervalued levels to maintain export competitiveness. China historically used a partially managed peg for this purpose.
5. Challenges and Risks Associated with Currency Pegs
A. Loss of Monetary Policy Independence
The biggest drawback is that a country cannot freely decide its interest rates. It must follow the monetary policy of the anchor country to maintain the peg.
This can be problematic during domestic recessions or inflationary pressures.
B. Requirement of Large Forex Reserves
Defending a peg requires massive reserves, which is costly. Without sufficient reserves, the peg becomes vulnerable.
C. Vulnerability to Speculative Attacks
If traders believe a peg is unsustainable, they can short the currency. This can collapse the peg, as seen in:
Thailand (1997)
Mexico (1994)
Argentina (2001)
D. Economic Distortions
A peg can create artificial stability. If the currency is pegged too high or too low, it can misrepresent true economic conditions, leading to:
Trade imbalances
Over-reliance on imports
Asset bubbles
6. Currency Pegs and Global Economic Events
A. During Oil Price Shocks
Oil-exporting countries with USD pegs remain stable because oil is traded globally in dollars. Pegs help smooth revenue fluctuations.
B. During Financial Crises
Some countries break their pegs during crises to regain monetary control, while others defend their pegs to maintain confidence.
C. During Global Inflation Waves
When the anchor currency experiences inflation (e.g., USD inflation cycles), countries pegged to it import inflation as well. This can create stress on domestic economies.
7. How Pegs Influence Global Trade Dynamics
Currency pegs can make countries more competitive in global markets. For example:
If a currency is pegged at a lower level, exports become cheaper.
If pegged too high, imports become cheaper but exports suffer.
This can trigger global reactions, including tariff threats or currency war accusations.
8. The Future of Currency Pegs
Even as digital currencies and floating rates dominate modern finance, currency pegs continue to play a vital role. Many countries rely on them for stability, while some use hybrid systems:
Managed float with a peg band
Basket-based pegging
Pegged but adjustable systems
With growing geopolitical tensions, shifts in trade alliances, and rising interest-rate cycles, pegs will remain influential tools in shaping global markets.
Conclusion
Currency peg rates are powerful tools that shape global economic behaviour. By tying a currency to a stable or strategically chosen anchor, countries can enhance trade stability, control inflation, and attract investment. However, they also face challenges such as loss of monetary independence, speculative risks, and heavy reliance on foreign reserves.
In the global market, currency pegs are both stabilizers and potential sources of volatility—depending on how well they are maintained. Their importance will continue as countries navigate an increasingly interconnected and uncertain economic environment.
Resource Commodity Supercycle in the Global Market1. What Is a Commodity Supercycle?
A commodity supercycle refers to a prolonged period—usually lasting 20–30 years—where prices of essential resources such as energy, metals, and agricultural goods experience sustained growth. Unlike short-term price spikes caused by temporary supply issues, supercycles emerge from deep structural shifts in the global economy.
A supercycle typically forms when:
A massive demand increase arises from industrialization or technological transformation.
Supply takes years to catch up due to long project lead times, lack of investment, or logistic constraints.
Prices remain elevated for years, pushing producers to expand capacity.
The end of a supercycle occurs when new supply finally exceeds demand or global economic growth slows.
2. Historical Commodity Supercycles
Analysts typically recognize four major supercycles in the last 150 years:
1. The Late 1800s Industrialization Boom
Fueled by:
U.S. and European industrial expansion
Rapid railway development
Urbanization and manufacturing growth
This cycle saw rising demand for steel, coal, copper, and agricultural products.
2. Post-World War II Reconstruction (1940s–1960s)
Countries devastated by war needed enormous resources to rebuild:
Europe’s reconstruction under the Marshall Plan
Japan’s industrial revival
Oil, metals, and food commodities experienced long-term price strength.
3. The Oil Supercycle (1970s–1980s)
Triggered by:
OPEC oil embargo in 1973
Geopolitical conflicts in the Middle East
Oil prices surged, reshaping global energy markets and pushing investment into oil exploration.
4. The China-Driven Supercycle (2000–2014)
The most powerful modern supercycle was driven by:
China’s entry into the WTO
Massive infrastructure, manufacturing, and housing expansion
Urbanization of over 300 million people
Demand for iron ore, copper, aluminum, coal, and crude oil skyrocketed.
This cycle slowed around 2014 as China shifted from infrastructure-led growth to services and technology.
3. Why Supercycles Matter in Today’s Global Market
A. They Shape Global Inflation
High commodity prices raise:
Manufacturing costs
Transportation expenses
Food prices
This can create global inflation waves, affecting interest rates and monetary policy.
B. They Influence Currency Markets
Countries that export commodities (e.g., Australia, Brazil, Canada, Russia) see stronger currencies during supercycles. Import-dependent countries face currency pressure and trade deficits.
C. They Impact Corporate Profits and Investment
Industries like:
Mining
Energy
Infrastructure
Fertilizer and agriculture
experience earnings booms, leading to stock market rallies.
D. They Shift Geopolitical Power
Nations rich in resources gain strategic leverage. For example:
Middle Eastern countries influence global oil supply decisions
African countries become key suppliers of metals needed for modern technology
4. Drivers Behind Modern Resource Commodity Supercycles
A. Urbanization and Infrastructure Growth
Large emerging economies such as India, Indonesia, Vietnam, and African nations are expanding rapidly. This increases demand for:
Steel
Cement
Copper
Coal
Crude oil
B. The Green Energy Transition
A powerful emerging driver is the global push for clean energy. Technologies such as electric vehicles (EVs), solar power, wind turbines, and grid batteries require huge quantities of metals like:
Lithium
Nickel
Cobalt
Graphite
Rare earth elements
Copper
Copper alone is essential for wiring, EV motors, and renewable energy grids. Demand may double over the next 20 years, making it a central metal in the next supercycle.
C. Supply Constraints and Underinvestment
For nearly a decade after 2014, mining and oil companies faced:
Low prices
Investor pressure to reduce debt
Capital discipline
As a result:
New oil fields were not developed
Few mega-mines came online
Exploration budgets were cut
Thus, supply is tight just when demand is rising, feeding a potential supercycle.
D. Geopolitical Conflicts
Issues such as:
Russia–Ukraine war
U.S.–China trade tensions
Middle East conflicts
Shipping disruptions (Red Sea, Panama Canal)
increase risks and disrupt supply chains, pushing prices up.
E. Monetary and Fiscal Stimulus
Large government spending on infrastructure, clean energy, and defence increases demand for raw materials. Meanwhile, inflation reduces purchasing power and encourages investment in commodities as a hedge.
5. Types of Commodities Affected in a Supercycle
1. Energy Commodities
Crude oil
Natural gas
Coal
Demand rises with industrial growth, transportation, and manufacturing.
2. Metals
Base metals: copper, aluminum, nickel, zinc
Precious metals: gold, silver
Battery metals: lithium, cobalt, rare earths
Metals are central to construction, electronics, EVs, renewable energy, and defence.
3. Agricultural Commodities
Wheat
Corn
Soybeans
Sugar
Edible oils
Agri supercycles are triggered by population growth, climate disruptions, and biofuel demand.
4. Soft Commodities
Cotton
Coffee
Cocoa
They respond to supply shocks from weather, pests, and geopolitical disruptions.
6. Signs That a New Commodity Supercycle May Be Emerging
Economists and market analysts look at structural indicators, including:
A. Rising Long-Term Demand
India’s growth, rising consumption in Africa, and global electrification indicate sustained demand for metals and energy.
B. Years of Underinvestment in Extraction
Supply gaps in oil and metals show that companies need a decade to catch up, creating prolonged price pressures.
C. Green Technology Boom
EV adoption, solar and wind installations, and smart grids require unprecedented quantities of metals.
D. Geopolitical Realignments
Countries are seeking secure supply chains through:
“Friendshoring”
“Resource nationalism”
Strategic reserves
These moves can raise prices across the board.
E. Climate-Driven Agricultural Volatility
Extreme weather events increase uncertainty in food supply, potentially driving long-term price trends.
7. Impact of a Commodity Supercycle on Global Stakeholders
A. For Investors
A supercycle can create multi-year opportunities in:
Mining and metal stocks
Oil and gas companies
Renewable energy miners (lithium, REEs)
Agriculture and fertilizer companies
B. For Countries
Resource-rich countries benefit through higher export revenues and stronger currencies.
Import-dependent countries face inflation and trade deficits.
C. For Businesses
Costs rise for manufacturers, construction firms, and energy-intensive industries.
D. For Consumers
Inflation affects:
Fuel prices
Food costs
Housing and infrastructure prices
Conclusion
A resource commodity supercycle is a powerful force that reshapes global markets, economies, and investment landscapes. Driven by structural megatrends—urbanization, green energy transition, supply shortages, and geopolitical shifts—today’s global economy may be entering a new and long-lasting supercycle. Understanding its mechanics helps investors, policymakers, and businesses position themselves strategically for the next decade.