SPY Set To Grow! BUY!
My dear subscribers,
My technical analysis for SPY is below:
The price is coiling around a solid key level - 659.05
Bias - Bullish
Technical Indicators: Pivot Points Low anticipates a potential price reversal.
Super trend shows a clear buy, giving a perfect indicators' convergence.
Goal - 669.74
About Used Indicators:
By the very nature of the supertrend indicator, it offers firm support and resistance levels for traders to enter and exit trades. Additionally, it also provides signals for setting stop losses
Disclosure: I am part of Trade Nation's Influencer program and receive a monthly fee for using their TradingView charts in my analysis.
———————————
WISH YOU ALL LUCK
Contains image

NZDUSD My Opinion! SELL!
My dear friends,
My technical analysis for NZDUSD is below:
The market is trading on 0.5611 pivot level.
Bias - Bearish
Technical Indicators: Both Super Trend & Pivot HL indicate a highly probable Bearish continuation.
Target - 0.5598
Recommended Stop Loss - 0.5619
About Used Indicators:
A pivot point is a technical analysis indicator, or calculations, used to determine the overall trend of the market over different time frames.
Disclosure: I am part of Trade Nation's Influencer program and receive a monthly fee for using their TradingView charts in my analysis.
———————————
WISH YOU ALL LUCK

BTC HAMMER REVERSAL (1D) - UPTREND LIKELYWe see a hammer reversal candlestick pattern on the 1D BTC chart (Nov. 23, 2025). This reversal coincidentally occurred at the 1.272 fib level, the 1 is anchored at the 2021 high (69,000) and the 0 is anchored at the Nov. 2022 low (FTX black swan).
I expect a reversal here. Keep an eye out on the charts!

KSE-100 Index | 23 NOV 2025 | 1D TF | The Chart Alchemist KSE-100 Index | 23 NOV 2025 | 1D TF | The Chart Alchemist
Trend Overview: The index recently broke out of a large trading range, previously forming a converging triangle pattern.
Current Movement: Although the index is bullish, it’s advancing slowly and not showing the strong bullish legs seen before.
Targets: The immediate target is 167,600 points.
Support Level: Nearest support is at 161,100 points.
Market Behavior: The index experiences deep pullbacks after each bullish leg, indicating a potential need for fundamental catalysts to boost momentum.
Reaccumulation Zone: The index might be in a reaccumulation phase, with institutional investors building positions for a potential strong breakout.
Advisory: While the index provides a general guideline, it’s crucial to focus on individual stocks for trading decisions.

Nifty Daily Weekly nice trading RAngeNifty Weekly MAjor TRading Zone along with Expected major Resistence along with Support
enough time to focus with trades for nxt 2 weeks with multiple moves
Selected CE n PE as mentioned are quite challenging

Elaborate Roadmap for Gold & Silver Miners.Gold & Silver Miners.
1) Take your morning coffee
2) Take a few moments to absorb all the annotations on chart
We are possibly in a mid-late 1960s type of environment.
Yeah, you might not like what it means for gold & silver miners... initially. But it gets better later.

DOGE It will grow soon...So if you pay attention to the DOGE chart you can see that the price has formed a Ascending wedge which means it is expected to price move as equal as the measured price movement.( AB=CD )
NOTE: wait for break of the WEDGE .
Best regards CobraVanguard.💚

Gold Teprature is almost 1064 Digrees 23 Nov 2025Gold Teprature is almost 1064 Digrees 23 Nov 2025
Hemmm
The Last week of november,
nov,dec will be voltile market , yearly Closing.
Struggling Struggling Struggling
Fight bitween bullish fvg day and th ebearish fvg that is most recent,
i will go with the most recent fvg,
the respected candle farmed inside Bearish FVG,
nearest target is is previus Swing low,
Previus Week Close Below Equalibrium.
potancial targets is PWL. Weekly Swing Low, and more.
Probalities,
allah o aalam

TradeCityPro | BNB Pressure Point: Trendline vs. Market Mood👋 Welcome to TradeCity Pro!
In this analysis, I want to review the BNB coin for you, one of the most popular and well-known cryptocurrency exchanges, whose native token has a $115.97 billion market cap and is currently ranked 5th on CoinMarketCap.
⏳ 4-Hour Timeframe
On the 4-hour timeframe, BNB is in a downtrend, and its latest bearish wave started after breaking below the $900 zone, continuing down to the $808 level.
✨ There is also a curved descending trendline on BNB’s chart, which has now become very steep, and the price has reached this trendline.
⭐ If this trendline breaks, the correction could deepen, allowing the price to move toward higher zones.
But if BNB gets rejected from this trendline, the downward movement will continue.
✔️ The next short trigger we have is the break of the $808 level.
This is a very important support zone, and if it breaks, the price could fall toward the $747 level.
📊 Buying volume has been very low during this corrective phase, which shows the strength of the sellers. Therefore, a rejection from the trendline or a break below $808 can confirm the start of a new bearish wave.
💥 From a momentum perspective, the RSI is also making a small upward correction similar to the price.
The 19.83 level is the key RSI support.
📝 Final Thoughts
Stay calm, trade wisely, and let's capture the market's best opportunities!
This analysis reflects our opinions and is not financial advice.
Share your thoughts in the comments, and don’t forget to share this analysis with your friends! ❤️

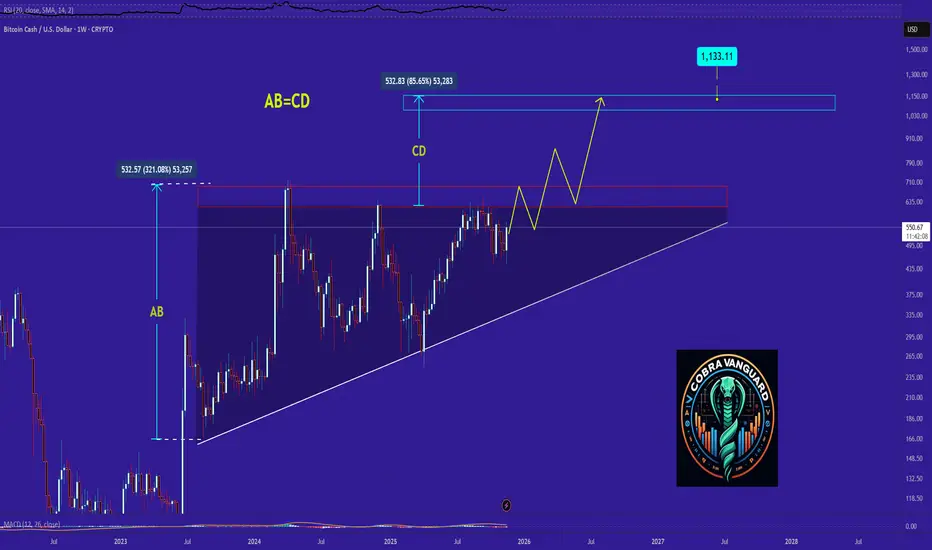
BCH - Time to buy again!BCH’s price on the 1-hour timeframe is forming an ascending triangle pattern.
If this pattern breaks to the upside, there’s hope that the AB leg will equal the CD leg, potentially pushing the price up to around $1100.
However, since crypto often disappoints expectations, it might let us down once again—so stay cautious.
mF International (NASDAQ: $MFI) Volatile After $500M PIPE DealmF International Limited (NASDAQ: NASDAQ:MFI ) saw sharp price swings after announcing a massive $500 million private placement (PIPE) to accelerate its digital asset strategy. The deal triggered an initial surge followed by a sharp dip, reflecting mixed trader sentiment. Despite the volatility, the stock remains up 2.84% from the open, showing that some investors view the PIPE as a strategic long-term catalyst.
$500 Million PIPE Fuels Digital Asset Ambitions
The company plans to raise $500 million by selling 50 million Class A shares and pre-funded warrants at $10 per unit. The capital will fund mF’s digital asset treasury initiative, including large-scale acquisitions of bitcoin cash. Part of the proceeds will also support general corporate needs and working capital, giving the company flexibility as it expands into digital assets.
The transaction is scheduled to close around December 1, 2026, pending standard closing conditions. mF International will file a Form 6-K with the SEC to provide additional information, including details on exemptions under the Securities Act. Since the offering will not be registered, resale will require future registration statements—covered under the registration rights agreements already signed with PIPE investors. Cooley LLP is advising the company on U.S. legal matters, signaling a high-level, institution-grade process.
Management says more announcements on its digital asset strategy will follow soon, increasing market anticipation and potentially adding to short-term volatility.
Technical Outlook
Technically, MFI has been in a strong bearish cycle. After hitting a high near $60 in September, price broke down aggressively, even slicing below the critical $22 support level. That zone has already been retested, confirming it as new resistance. Unless momentum shifts, the next downside magnet is the $5 support area. Bulls need a strong catalyst to reclaim previous levels.

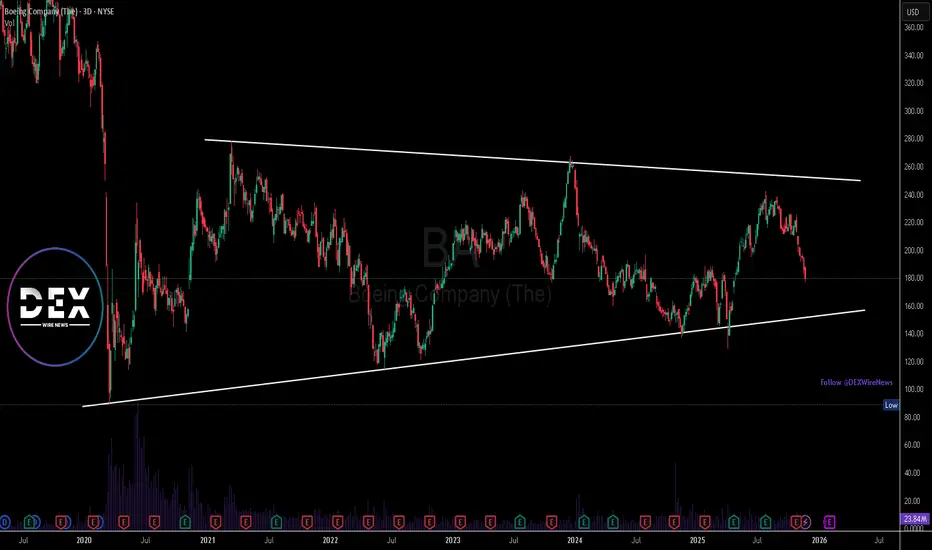
Boeing ( $BA) Navigates Costs, Delays, and New Order MomentumBoeing (NYSE: NYSE:BA ) is working through one of its most challenging phases as production delays for the 777X have triggered a $4.9 billion cash charge. The pushback of the first 777X delivery to 2027 adds pressure to Boeing’s multi-year recovery plan and complicates its ability to stabilize cash flow. Heightened regulatory oversight and persistent technical hurdles continue to slow production, contributing to the stock’s decline of more than 25% since its July peak.
Even with these setbacks, Boeing remains a central force in global aviation. Its 5,900-plane backlog demonstrates resilient long-term demand, and recent airline agreements highlight confidence in Boeing’s future. Strong international partnerships reinforce the company’s competitive positioning despite near-term delays.
This week alone, Boeing secured major orders that could bolster its financial outlook. Emirates ordered 65 additional 777-9 jets—an estimated $38 billion deal—which expands its total Boeing order book to 315 aircraft. flydubai also signed an MoU for 75 Boeing 737 MAX aircraft valued at roughly $13 billion. These commitments strengthen Boeing’s medium-term pipeline and provide revenue visibility well into the next decade.
Boeing continues to expand its defense portfolio as well. The company recently secured an $877 million U.S. Department of Defense contract for MH-47G helicopters, supplementing ongoing deals with Ethiopian Airlines, Gulf Air, and Air Senegal. These diversified contracts help cushion Boeing from commercial-aviation volatility.
Technical Outlook
Technically, BA trades inside a multi-year bearish symmetrical triangle, reflecting uncertainty and long-term consolidation. Momentum remains bearish as price approaches the triangle’s base support zone. If the support holds, BA could stage a recovery bounce; however, a breakdown signals further downside.
Opendoor ($OPEN) Expands Shareholder Value With Special WarrantsOpendoor Technologies Inc. (NASDAQ: NASDAQ:OPEN ) has taken a bold step to enhance shareholder value by issuing a special dividend of tradable warrants to stockholders as of November 18, 2025. The company distributed one Series K, one Series A, and one Series Z warrant for every 30 shares held, offering investors discounted future purchase opportunities. With the stock trading at $9.20 during the announcement, the move came at a time of increasing market optimism around the company’s recovery and operational momentum.
The warrants provide attractive entry points for long-term investors. Series K is exercisable at $9.00, Series A at $13.00, and Series Z at $17.00. All three expire on November 20, 2026, though early expiration triggers apply if Opendoor’s stock trades above 120% of the exercise price for 20 consecutive trading days. This means Series K could expire early if the stock reaches $10.80—highlighting the potential for accelerated shareholder action should the stock rally.
From a fundamental perspective, the move signals management’s confidence in Opendoor’s growth trajectory, improved liquidity position, and long-term business model stability. The warrant issuance also provides Opendoor with flexibility in raising capital if exercised, further strengthening its balance sheet in a challenging housing market.
Technical Outlook
Technically, OPEN remains bullish in the higher time frame despite a recent bearish retracement from the $10 high. The stock is currently trading near $6 and approaching a critical support zone around $5—a level that has historically held since 2022 within a long-term ranging channel.
If the $5 support holds, bullish continuation targets lie at $12, $15, and ultimately $20. A breakout and retest of the upper range structure would confirm a strong upside trend continuation.

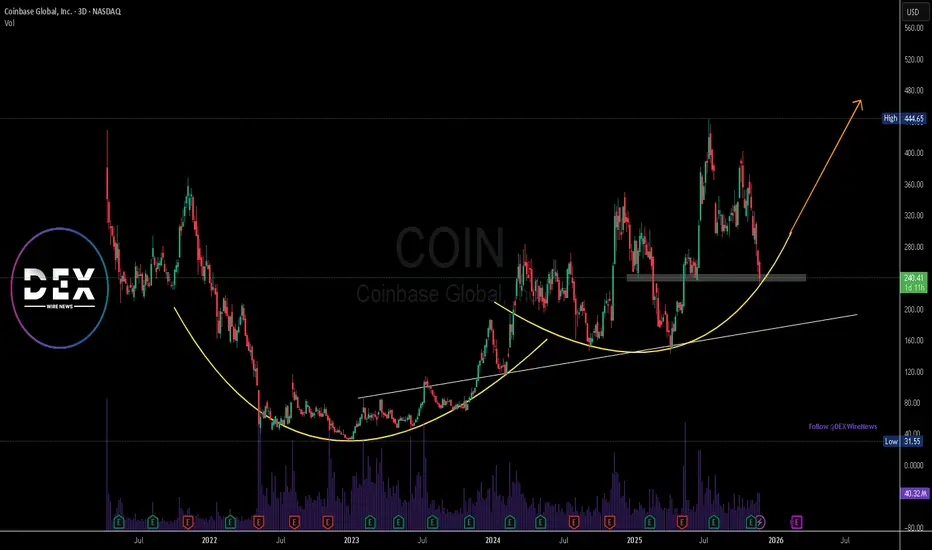
Coinbase Global Inc. Expands 24/7 Altcoin Futures TradingCoinbase Global Inc. (NASDAQ: COIN) is expanding its derivatives business with the introduction of 24/7 altcoin futures beginning December 5. The new lineup will include long-dated, perpetual-style futures for Avalanche, Bitcoin Cash, Cardano, Chainlink, Dogecoin, Hedera, Litecoin, Polkadot, Shiba Inu, Stellar, and SUI. This expansion builds on Coinbase’s existing 24/7 markets for Bitcoin, Ethereum, Solana, and XRP, significantly broadening access for traders seeking diverse crypto exposure.
A Major Expansion of Altcoin Futures
The move signals Coinbase’s commitment to meeting rising demand for round-the-clock crypto trading. By extending futures beyond major assets into popular altcoins, Coinbase strengthens its position as a U.S.-regulated venue offering continuous derivatives access. The newly added assets operate under the same structure as existing futures: perpetual-style mechanics with hourly funding and twice-daily settlement to keep contract pricing closely aligned with spot markets.
Unlike traditional perpetual contracts, Coinbase’s U.S. version carries five-year expirations, blending long-term optionality with the flexibility traders expect from perpetual futures. This hybrid approach appeals to institutions and advanced traders who want exposure without rolling short-dated contracts.
Strategic Positioning in a Competitive Market
With global crypto exchanges competing aggressively in derivatives, Coinbase’s move positions it as a key player offering regulated futures across a wide basket of assets. The expanded lineup enhances liquidity, attracts hedging activity, and deepens Coinbase’s ecosystem ahead of growing institutional interest.
Technical Outlook for COIN
COIN recently retraced sharply from its $444 high, falling toward the $240 support zone, where it currently trades. This level is critical: a breakdown could send price toward the ascending trendline near $170, aligning with the previous higher low.
If either support level holds, the broader bullish trend remains intact. A strong rebound may set COIN on track to retest, and potentially reclaim the $444 high, supported by its expanding derivatives business and improving market sentiment.
GOLD (XAUUSD): Support & Resistance Analysis for Next Week
Here is my latest structure analysis for Gold.
Vertical Structures
Vertical Support 1: Rising trend line
Horizontal Structures
Support 1: 4021 - 4045 area
Support 2: 3869 - 3934 area
Support 3: 3765 - 3829 area
Support 4: 3690 - 3738 area
Resistance 1: 4082 - 4133 area
Resistance 2: 4202 - 4246 area
Resistance 3: 4360 - 4382 area
Consider these structures for pullback/breakout trading.
❤️Please, support my work with like, thank you!❤️
I am part of Trade Nation's Influencer program and receive a monthly fee for using their TradingView charts in my analysis.

EURUSD: Support & Resistance Analysis for Next Week 🇪🇺🇺🇸
Here is my latest support and resistance analysis
for EURUSD for next week.
Consider these structures for pullback/breakout trading next week.
❤️Please, support my work with like, thank you!❤️
I am part of Trade Nation's Influencer program and receive a monthly fee for using their TradingView charts in my analysis.

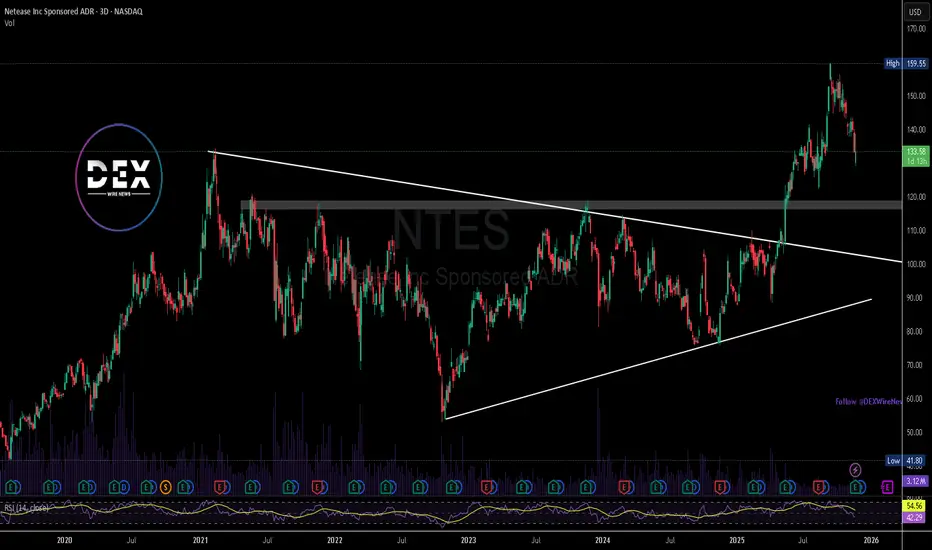
NetEase Inc.(NASDAQ: $NTES)Revenue Rises Despite Market PressureNetEase Inc. (NASDAQ: NTES) reported solid third-quarter results, posting 8.2% year-over-year revenue growth to RMB 28.4 billion ($4.0B). The company’s performance was driven primarily by its gaming division, though investor response remained muted as the stock pulled back after a strong multi-month rally.
Gaming Remains the Core Growth Engine
NetEase’s gaming revenue climbed 11.8% to RMB 23.3 billion ($3.3B), reinforcing the company’s leadership in China’s online gaming market. Long-running titles such as Fantasy Westward Journey Online continued to generate strong engagement, while new global releases like Destiny: Rising delivered impressive adoption.
The company’s strength lies in consistent updates, global game rollouts, and its ability to balance legacy franchises with innovative new titles. This pipeline helped offset slower performance in other business segments, where cloud music, education technologies, and other initiatives delivered mixed results.
However, despite gaming outperformance, the stock declined. This suggests that markets either expected stronger beats or remain skeptical about NetEase’s expansion potential outside its core gaming business. Investors appear cautious about growth diversification, monetization risks, and regulatory uncertainties in China’s digital content space.
Technical Outlook
NASDAQ:NTES recently broke out of a years-long symmetrical triangle, rallying sharply toward the $159 zone, where it formed a local high. After reaching this peak, price pulled back toward the current $133.
This retracement appears healthy within a broader uptrend. Buyers may look for continued support above the $118 demand zone, which marks the prior breakout area highlighted on the chart. If bulls defend this region, momentum could resume toward the $150–$160 target zone. A weekly close below $118, however, may trigger a deeper move toward $105. However, NetEase remains fundamentally strong and technically bullish over the long term.
Alphabet Momentum Surges as Berkshire’s Bet $5 billion stakeAlphabet Inc. (NASDAQ: NASDAQ:GOOG ) closed at $299.65 on Friday and briefly pushed above $302 in after-hours trading, extending its strong 2025 rally. The momentum accelerated after Berkshire Hathaway revealed a new $5 billion stake, making Alphabet one of its largest U.S. holdings. The move reinforces investor conviction in Alphabet’s long-term AI roadmap, especially as capital expenditures surge.
Alphabet’s Q3 earnings on Oct. 29 highlighted the company’s powerful growth engine. Revenue rose 16% year over year to $102.3 billion, while net income increased 33% to $35 billion. EPS jumped 35% to $2.87 as operating efficiency improved across Google Services and Cloud.
Google Cloud delivered another breakthrough quarter, generating 34% growth and $15.2 billion in revenue. The segment continues to benefit from rising AI workloads and enterprise adoption. YouTube and Search also outperformed, driving strong ad-based revenue expansion.
Capital expenditures remain a key theme. Alphabet raised its 2025 CAPEX outlook twice, now guiding for $91–$93 billion, driven by AI chips, new data centers, and expanded compute clusters. Despite heavy investment, free cash flow remains exceptionally strong at $73.6B over the last 12 months.
Berkshire’s Vote of Confidence
Berkshire’s acquisition of 17.9 million GOOG shares signals deep belief in Alphabet’s AI dominance and multi-segment strength. With nearly $100B in cash and consistent double-digit revenue growth, Alphabet remains one of the most financially resilient companies in big tech.
Technical Outlook
NASDAQ:GOOG has been strongly bullish since the April low at $140. The stock also broke through an ascending-trendline resistance in August and continues to climb toward new all-time highs. As long as price stays above this breakout zone, bullish continuation remains likely.

Eli Lilly Hits $1 Trillion Milestone on GLP-1 BoomEli Lilly & Co. (NYSE: NYSE:LLY ) briefly crossed the $1 trillion market-cap threshold, becoming the first health-care company in history to reach the valuation. Shares traded around $1,059 as demand for its GLP-1 weight-loss and diabetes drugs exploded, driving extraordinary revenue growth and solidifying its global leadership.
Historic Breakthrough for Health-Care
Eli Lilly’s rise into the trillion-dollar tier places it beside mega-caps typically dominated by technology firms. Its 36% year-to-date surge has been powered by transformative changes in global health trends, particularly the widespread adoption of GLP-1 therapies. Investors see Lilly as the clear frontrunner in a market undergoing rapid medical, cultural, and financial shifts.
Mounjaro and Zepbound Drive Massive Revenue
Third-quarter earnings highlighted unprecedented growth:
Mounjaro: $6.52B revenue (+109% YoY)
Zepbound: $3.59B revenue (+184% YoY)
These drugs are expanding faster than nearly any product in pharmaceutical history. Analysts expect continued momentum as insurance adoption widens, regulatory approvals expand, and Lilly prepares to launch oral GLP-1 versions—an innovation that could reshape accessibility.
Legacy of Innovation
Founded in 1876, Eli Lilly has delivered breakthroughs for a century—from insulin to Prozac to early polio vaccines. But its modern dominance began in 2022 when tirzepatide (Mounjaro) gained approval, offering dual-hormone therapy that reshaped diabetes and weight-loss treatment. Zepbound extended that dominance into obesity care, capturing global demand at scale.
Rivals such as Novo Nordisk and Pfizer are accelerating efforts, with the obesity-drug market expected to exceed $150 billion by the 2030s. Still, Lilly maintains the strongest growth trajectory.
Technical Outlook
LLY trades at all-time highs after breaking above the $969 resistance zone. Price action remains firmly bullish, targeting psychological levels at $1,100 and $1,200. Any retracement should find support at $969, keeping the broader uptrend intact.

Walmart Inc. Expands to Africa With First South Africa StoreWalmart Inc. (NYSE: NYSE:WMT ) has officially opened its first store in South Africa, marking a major step in the retailer’s long-term international expansion strategy. The launch took place in Roodepoort, west of Johannesburg, and signals Walmart’s ambition to deepen its presence in emerging markets while strengthening its global retail influence.
The opening drew overwhelming demand. Hundreds of shoppers lined up for hours, eager to access Walmart’s signature “Everyday Low Prices” and international items not widely available locally—such as Drew Barrymore designer appliances, Labubu dolls, and Dr Pepper beverages. Some customers targeted Black Friday tech deals, highlighting strong consumer interest from day one.
Walmart will compete directly with established local players, particularly Shoprite’s Sixty60 delivery service. The company is rolling out its own 60-minute delivery option to match South Africa’s rapid-commerce expectations. Executives emphasized that Walmart’s entry represents a commitment to long-term value, access, and affordability for South African consumers.
Beyond retail expansion, Walmart is prioritizing community impact. The new store created 80 jobs and partnered with 15 local SMEs to support regional supply chains. This combination of global variety and local empowerment strengthens Walmart’s positioning in a competitive market.
From an investment perspective, Walmart continues to outperform major benchmarks. Its 3-year return of 117.20% and 5-year return of 125.45% surpass the S&P 500 by a wide margin—reflecting consistent investor confidence in the retailer’s disciplined strategy and operational strength.
Technical Outlook
WMT recently bounced from the $100 support level after retracing from $109. Buyers defended the zone strongly, and price is now pushing back toward the $109 resistance. A decisive breakout above $109 opens the path toward new highs, supported by strong fundamentals and global expansion momentum. Failure to reclaim the level may lead to another retest of $100, but the broader structure remains bullish.

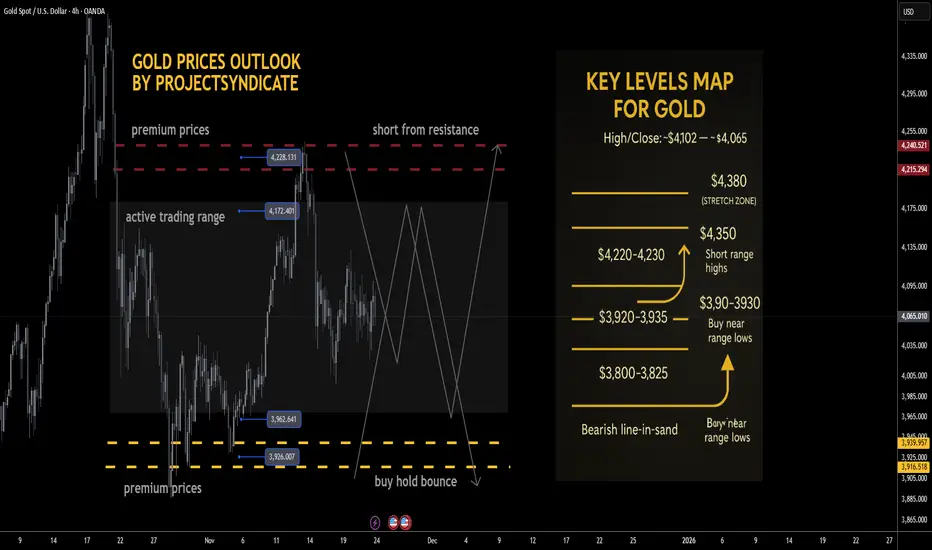
Gold next week: Key S/R Levels and Outlook for Traders🔥 GOLD WEEKLY SNAPSHOT — BY PROJECTSYNDICATE 🏆
High/Close: ~$4,102 → ~$4,065 — tight, inside-feel week with price holding comfortably above the $4,000 handle. Flows look balanced: steady two-way interest, but no strong directional conviction as the market oscillates within a well-defined range.
________________________________________
📈 Trend:
Still bullish on the higher timeframe, but very clearly in range / two-way mode. As long as we’re capped below the $4,350–4,375 ATH supply block and holding above the $3,900s, the playbook remains “range-trade the extremes” rather than chase breakouts.
________________________________________
🛡 Supports Buy Zones
• $3,920–3,930 — key range lows / primary dip zone:
o Your preferred “buy low” area; recent reactions show responsive buyers defending this shelf.
o This is the first major liquidity pocket for range longs and a natural first target for shorts from resistance.
• $3,800–3,825 — deeper demand pocket / fail-safe shelf:
o Secondary, more extreme downside area where higher-timeframe dip-buyers are likely to step in.
o A clean break and daily close below here would suggest the range is failing and a deeper mean reversion is in play, not just a normal pullback.
________________________________________
🚧 Resistances Short Zones
• $4,220–4,230 — immediate range resistance / short-sell zone:
o Your core “short from resistance” idea; this band remains a logical area to fade strength.
o First tests into this region are attractive for tactical shorts, especially if intraday momentum is stalling.
• $4,350–4,375 — ATH heavy resistance block:
o Still the major supply area above.
o Any spike here is a fade candidate unless price starts accepting above it with strong volume and multiple daily closes.
________________________________________
🧭 Bias – Coming Weeks
Base expectation is continued range-bounce price action between roughly $3,920–$4,220, with the broader structure still nested inside the larger $3,800–$4,350 range:
• Preference to fade strength into $4,220–4,230, targeting rotations back toward $3,920–3,930.
• Conversely, buy dips into $3,920–3,930 for moves back toward $4,220–4,230, as long as we hold the $3,800 shelf on a closing basis.
• Invalidation of the “range grind” idea comes on:
o Sustained acceptance above $4,350–4,375 (turns it back into trend-up).
o Or a decisive loss of $3,800–3,825 (opens a deeper corrective leg).
________________________________________
🔝 Key Resistance Zones
• $4,220–4,230 — front-line ceiling; aligns with your tactical short-sell band. Strong candidate to initiate shorts on first, clean tests.
• $4,350–4,375 — prior ATH / macro supply block. Only flips from “sell zone” to “bullish continuation base” if reclaimed and held as support.
🛡 Support Zones
• $3,920–3,930 — primary range low and first major liquidity shelf; ideal first take-profit for shorts and main dip-buy area.
• $3,800–3,825 — deeper support; loss of this level changes the narrative from “sideways digestion” to “larger corrective structure.”
________________________________________
⚖️ Base Case Scenario – Range / Consolidation
Core view: Market continues to oscillate between $3,920–$4,220, within the broader $3,800–$4,350 band.
• Pushes into $4,220–4,230 are sellable for rotations back toward $3,920–3,930.
• Dips into $3,920–3,930 are buyable for rotations back toward $4,220–4,230, as long as structure and flows remain balanced.
• While weekly closes keep rejecting the $4,350–4,375 ATH block, the default remains “sell strength, buy clean range lows.”
________________________________________
🚀 Breakout / Breakdown Triggers
• Bull trigger:
o Sustained acceptance above $4,350–$4,375, with multiple daily closes holding above and that band starting to act as support.
o That would shift tone from “range trading” back to full-on bullish trend, reopening path toward and beyond prior extremes (~$4,400+ in your framework).
• Bear trigger:
o A decisive daily close below $3,800 converts the current “healthy sideways correction” into a deeper, more directional liquidation phase, likely targeting prior lower shelves and expanding volatility.
________________________________________
💡 Market Drivers to Watch
Even in a range, macro and flow catalysts dictate which side of the range gets tested first:
• Real yields & Fed path: Any hawkish repricing or upside surprise in data tends to cap rallies near resistance; dovish shifts / easing fears support the lower end of the range.
• U.S. fiscal / political noise: Episodes of stress typically underpin gold; temporary relief or “risk-on” swings can blunt upside and push price back toward range lows.
• Flows & positioning: After a massive secular run, fast money continues to fade extremes, locking in profits into strength and reloading near range lows.
• Cross-asset behavior: If risk-off hits and gold fails to catch a bid (selling alongside equities), expect deeper probes into the lower end of the range before strategic buyers step back in size.
________________________________________
🔓 Bull / Bear Trigger Lines
• Bullish above: $4,350–$4,375 (sustained acceptance; ATH block reclaimed and used as support).
• Bearish below: $3,800 (shifts from contained range to deeper correction regime).
________________________________________
🧭 Strategy – Focus on Trading the Range
Primary plan – short from resistance (core idea):
• Entry zone:
o Scale into shorts around $4,220–$4,230 (front edge of resistance).
• TP #1:
o $3,920–$3,930 — key range lows; logical place to close majority of the short.
• Runner / extension:
o Leave a runner targeting $3,800–$3,825 if momentum and macro tone turn heavier.
• Risk / invalidation:
o Hard invalidation if price accepts above $4,350–$4,375 (multiple daily closes and successful retests from above).
________________________________________
Alternative plan – buy low from key range lows:
• Entry zone:
o Stagger bids in $3,920–$3,930; add more aggressive size only if we see responsive buying and positive reaction there.
o Optional deeper add zone at $3,800–$3,825 for higher conviction swing longs if structure still looks constructive.
• Exit zone / targets:
o First target back into $4,220–$4,230; heavily de-risk or fully exit as we approach that band.
• Risk management:
o Cut or significantly reduce longs on a daily close below $3,800 or if price accelerates through that shelf on high volume.
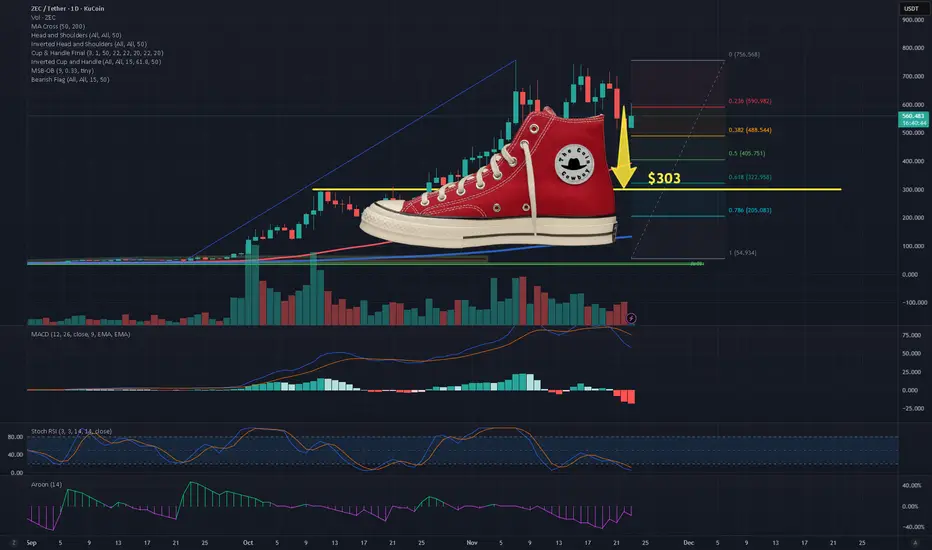
ZEC — The Shoe is About to DropMy 7 reasons why ZEC is about to drop to the heel of the shoe.
1. Price Rejected Hard at the 0.236 Fibonacci Level
The recent top at $752
Strong rejection at $582 (0.236 level)
Price tried to reclaim 0.236 multiple times and failed, which signals:
The bullish trend has lost strength and a deeper retracement is likely.
In most parabolic assets, 0.236 → 0.382 → 0.618 is the natural sequence when momentum dies.
ZEC already hit 0.382 around $476, and bounced weakly. Next logical magnet is 0.618 = $306.
2. The $548 Horizontal Level Was Lost (Key Breakdown)
$548 was:
former support
former demand zone
heavy volume node (visible on histogram)
Price closed below it, which makes it broken support → new resistance
Losing this floor confirms that buyers couldn’t defend the mid-range.
When a mid-range collapses, price usually moves to the next major liquidity pool, which here is:
👉 0.618 Fib at $306
👉 200MA cluster between $380–$400
3. Volume Profile Shows a Gap Below $480
Volume bars reveal high trading activity between $540–$620
A void / low-volume area between $470 → $380
Markets tend to fill low-volume gaps quickly because:
There is little historical demand to slow price down
This means once $480 breaks convincingly, price can accelerate rapidly toward:
📌 $380–$400
📌 $305–$330
4. MACD Bearish Cross With Increasing Bearish Momentum
MACD shows:
MACD line crossing below signal line
Histogram printing deeper red bars
MACD approaching the zero line
A MACD cross this high up (after a parabolic run) is dangerous
When MACD crosses down after a blow-off top, the retrace is usually 50–70%.
That places ZEC’s ideal retrace zone between:
0.5 Fib → $391
0.618 Fib → $306
Again, pointing toward the $300 range
5. Stochastic RSI Bottoming? Not Yet — Could Stay Oversold in a Downtrend
Stoch RSI is oversold, but this is misleading because:
In downtrends, Stoch RSI can remain pinned down while price continues falling.
This happens during macro trend reversals.
Oversold Stoch does not mean reversal—it often means continuation.
6. Aroon Indicator Shows Strong Downtrend Confirmation
Aroon indicator is down (purple) is dominating
Aroon Up (green) is completely suppressed
This means trend strength = bearish
Aroon tends to be a leading indicator, so with this reading:
Trend is already confirmed bearish. More downside is expected.
7. Market Structure: Lower Highs + Breakdown of Rising Structure
The chart clearly shows:
A lower high after the top (not a good sign)
Breakdown of the parabolic rising wedge
Failed retest zone around $600
Candle spreads widening on down moves (increasing sell pressure)
All of that is consistent with a distribution pattern after a massive run
Once distribution completes, assets typically retrace to:
📌 0.618
or
📌 the base of the breakout structure
The base of ZEC’s breakout...
→ $300–$350 area
US30 BEARS ARE GAINING STRENGTH|SHORT
US30 SIGNAL
Trade Direction: short
Entry Level: 46,264.6
Target Level: 45,574.0
Stop Loss: 46,722.1
RISK PROFILE
Risk level: medium
Suggested risk: 1%
Timeframe: 4h
Disclosure: I am part of Trade Nation's Influencer program and receive a monthly fee for using their TradingView charts in my analysis.
✅LIKE AND COMMENT MY IDEAS✅
