AUD-JPY Free Signal! Sell!
Hello,Traders!
AUDJPY tapped into a high-timeframe supply block and printed rejection wicks, signalling distribution after a premium sweep. With liquidity taken above the range, the setup aligns for a displacement down into the next draw-on-liquidity.
Sell!
Comment and subscribe to help us grow!
Check out other forecasts below too!
Disclosure: I am part of Trade Nation's Influencer program and receive a monthly fee for using their TradingView charts in my analysis.
Contains image

Bitcoin: Recovery Path to 250kHey guys in this video, I shared my thoughts on the current market state of INDEX:BTCUSD , why I believe the bull market isn't over yet and also what to expect the coming weeks.
If you find this content helpful, like, share, follow and most importantly share your thoughts in the comment below if you agree or disagree with my view. Lets help each other. Cheers.💚

ENGROH — Technical OutlookThe price gave an initial bounce due to RSI bullish divergence, indicating buying interest.
A clear Cup & Handle formation is developing in the long term, which is a strong continuation pattern with a target of 365 PKR.
In the short term, even if we ignore the handle, a Double Bottom formation is confirmed with a target of 260 PKR.
Short-term stop loss (SL): 208 PKR (closing basis).
For confirmation of the higher target, a daily close above the handle is necessary.
Volume support and RSI momentum validate the pattern.
Targets:
• 260 PKR (Short-term Double Bottom)
• 365 PKR (Long-term Cup & Handle)
Support Zone: Near the handle base at current levels.
Note: If you are a long-term investor, adding on dips is the best strategy to target 365 PKR.

S&P 500 BullishPrice has broken out above the descending broadening wedge, confirming a strong bullish setup.
The market is currently testing the December Central Pivot (P) 6751.
As long as price remains above this level we expect continuation toward R1 at 6980.
A break above R1 would open the next upside target at R2 (7111).
The 1.618 Fibonacci extension aligns with the 7087 – 7140 zone creating a high probability resistance region.
Strong bullish momentum stays intact above the December Top Central Point (TC) 6800.

SUICRYPTOCAP:SUI is trading inside a clean descending channel pattern and the structure is setting up for a major reversal. From the current price to the measured target there is a potential 350 percent gain. Momentum is coiling and this setup looks ready to expand.

ETH - Bulls Waiting at the Intersection Zone!📈ETH remains overall bullish, moving steadily inside its rising channel. Every dip toward the lower bound has acted as a clean continuation point for the next push upward.
🏹As price pulls back , we will be looking for long setups once ETH retests the intersection of the lower trendline and the demand zone. This confluence area has been respected multiple times, making it a high-probability level for trend-following entries.
⚔️As long as ETH holds above this orange zone, the bullish structure remains intact, and the next impulse toward the upper channel boundary becomes the most likely scenario. Only a break below the demand zone would weaken the bullish outlook.
Now we wait for the retest… then let the structure guide the entries. 🤔
⚠️ Disclaimer: This is not financial advice. Always do your own research and manage risk properly.
📚 Stick to your trading plan regarding entries, risk, and management.
Good luck! 🍀
All Strategies Are Good; If Managed Properly!
~Richard Nasr

PREMA — Technical OutlookPrice is holding at its long-term key support zone, a level that has historically produced strong reactions.
On the daily timeframe, an RSI bullish divergence is active, which confirmed the bounce seen on Thursday.
Key Level:
• 42 — A daily close above this level will open the door for bullish continuation.
Targets:
• 46 (initial target)
• Further upside is possible if price sustains above 42.
SL: 36 (Closing basis)
Structure continues to maintain a support-driven bullish bias.

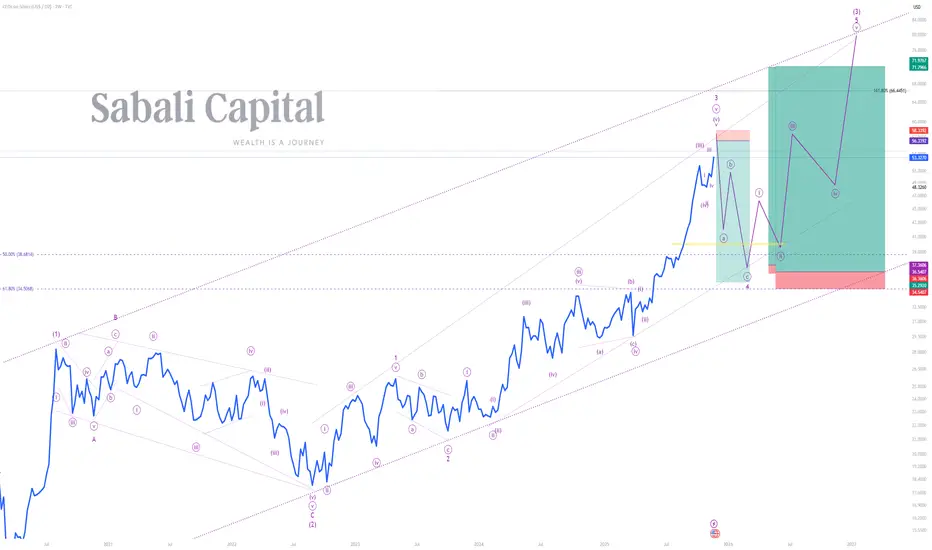
FROM RALLY TO REALITY, SILVER'S CORRECTION IS STRUCTURALPeace be unto you
Primary Chart: Silver Analysis (Weekly Timeframe)
A) Wave Analysis: Minor wave 3 peaks, sharp correction looms
Price is currently completing minor wave 3 that began printing on the 4th of October 2023. Minor wave 1 started printing on the 1st of September 2022 and terminated on the 5th of May 2023. Minor wave 2 sideways correction began when minor wave 1 terminated and terminated when minor wave 3 started printing. Minor wave 4 is expected to be a sharp correction in line with the law of Elliot Waves Guideline on Corrections (Wave 2 and 4) which states that "if wave 2 is a sharp correction, expect wave 4 to be a sideways correction, and vice versa". Thus, minor wave is forecasted to be sharp and retrace to 50% and 61.8% retracement levels of minor wave 3, i.e. minor wave is forecasted to terminated within the 38.6814 and 34.5068 levels before price begins printing minor wave 5 to complete intermediate wave (3) as indicated on the primary chart.
B) Indicator(s) Analysis: Bearish Divergence confirmed and bulls losing altitude. The EMA magnet activated, pullback before the next push. The MACD flips the script, and a seasonal shift is detected.
1) EMA 50 & 150 (Weekly) - Though strongly bullish, price will pull back to touch these moving averages before it continues to rally.
2) RSI 14 (Weekly) - The RSI has rallied above the 70 upper band in August 2025 and reached a peak in October 2025. On the 3rd of November 2025 the RSI reached a trough, and it is now printing a lower high whilst price is printing a higher high. This is known as a Strong Bearish Divergence signaling that bulls are growing weak and that price will collapse on its weight.
3) MACD H (Weekly) - Price has been printing above the MACD centerline indicating that bulls have been strong, but on the 20th of October 2025 we have seen a down close on MACD Histograms indicating a possible trend reversal and a change of season. This is the time to go short.
#SabaliCapital
#TechnicalAnalysis
#PreciousMetals
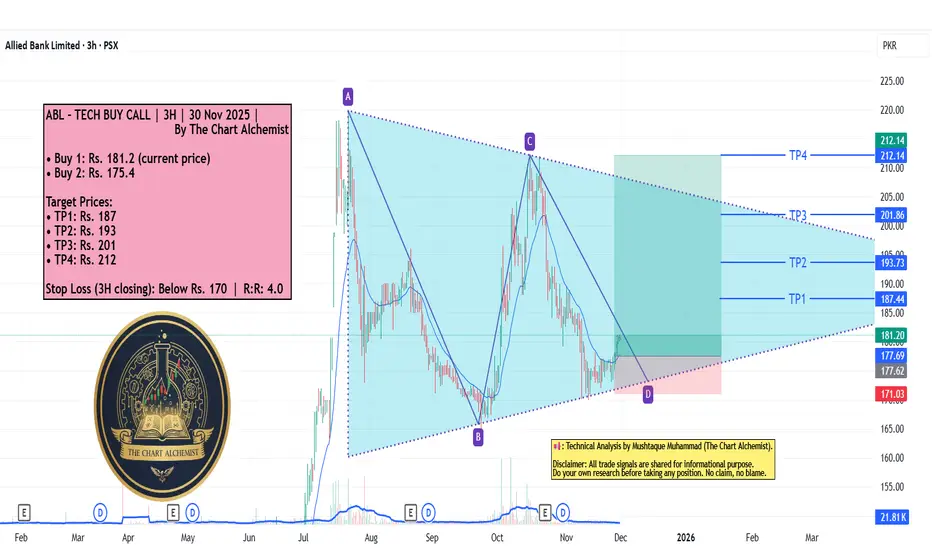
ABL – TECH BUY CALL | 3H | 30 Nov 2025 | By The Chart Alchemist ABL – TECH BUY CALL | 3H | 30 Nov 2025 | By The Chart Alchemist
After reaching a previous high of PKR 218, ABL entered a corrective phase that developed into a converging triangle pattern, reflecting consolidation. A fresh demand zone has formed at the lower boundary of this structure, where the stock has shown a strong bullish reversal. This reaction signals renewed accumulation and increases the probability of continuation toward the next upside targets.
📢 Technical Analysis by Mushtaque Muhammad (The Chart Alchemist).

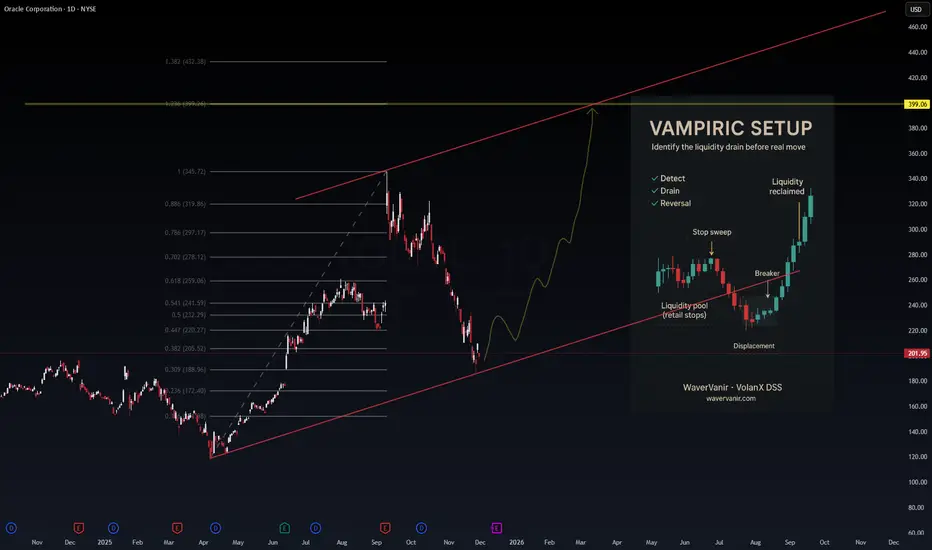
$ORCL — WaverVanir Edge (Vampiric Setup)NYSE:ORCL — WaverVanir Edge (Vampiric Setup)
(Educational Only)
Market Structure:
Price tapped the ascending trendline after a full liquidity drain from the June–Sept highs.
The selloff created a deep retracement into 0.702 → 0.786 zone, a common SMC reversal region.
ORCL is now positioned for a Vampiric Setup — the market drains retail liquidity before revealing the real directional move.
Vampiric Setup Components (From the chart):
Retail stop pools swept
Breaker structure formed
Bullish displacement confirms aggressive repricing
Liquidity reclaimed with momentum
Bias:
As long as structure respects the trendline, bias favors a multi-month rally toward:
Fib 1.0 → $345
Fib 1.382 → $399 (primary target)
Liquidity Map:
Below: liquidity vacuum already drained — limited downside unless macro breaks.
Above: large inefficiencies between 260 → 315 → 345 now become magnets.
Momentum:
A classic “drain → reclaim → expansion” pattern.
ORCL often trends in large waves due to its enterprise cloud cycles.
Key Levels:
Support: 188 / 205
Targets: 315 → 345 → 399
Invalidation: Strong daily close below trendline
Smart money always moves after the drain.
— WaverVanir International LLC
#ORCL #Stocks #VolanX #AI #Liquidity #WaverVanir
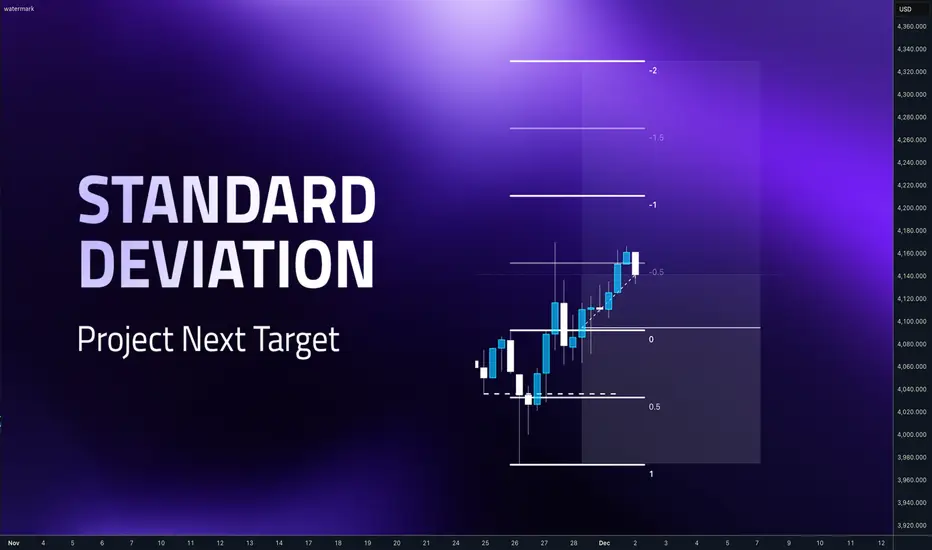
Standard Deviations - How to be exit before the pullbackHey whats up guys, in this post Ill show you easy method which can help you to set your targets, stay in the positions, prevent cutting position too early or hold for too long. You will basically have more objectives to stay in trade and give it a frame to which key levels you should use. Standard deviations are projection deviations of the manipulation leg. Which is the price swing that sweeps liquidity and then changes the order flow. In simple words, it is the move that takes out stops and then flips the structure - Order block.
📌 Fibonacci tool settings
We will be measuring deviations from the order block and here is the Fibonnaci settings
0 - 1 is where you measure the manipulation leg and then you got your projections.
Zone between 2 - 2.5 is my main focus for taking partials of full profits Price obviously can go further but between 2 - 2.5 is where I tend to take something of the table. Because my longterm statistics says most of my trades has 2.3 RR. 📌 What to do at 2- 2.5
Obviously don't start doing what Im saying here on your next trade. First test it and if you find it useful, never put any idea from someone from the internet to your money without verifying by yourself then add it to your arsenal or reject it. If your strategy has fixed TP based on structure stick with it. Standard deviations can be just a little helper. Let's look at few examples.
1️⃣ Example: GBPUSD
This is the example which has Benn posted here on TV And as you can see it has made some gain, didn't hit full TP and reversed, back to the entry. But look where it reversed - Exactly at the 2 - 2.5 I saw it has my average profit and it was Friday so I closed it . as we can see it was a good decision to close position fully here and not sticking to to the full target. Im not saying that closing trader before the initial target is good decision, but considering that its Friday and I got my average 2.3 gains. Its a no brainer to take what the market offers to me. 2️⃣ Example: EURUSD
My strategy is has two defined targets. 50% of the range and full range. After taking 50% partial at 50% I should be targeting opposing range low after the sweep of the liquidity highs. So I should hold the trade until the target. But as it was a Friday and price been between 2 - 2.5 means my trade was around 2.3 RR in profit, which is my average reward so I decided to close it completely and as we can see it was a good decision as the price just completely reversed before hitting my target. 3️⃣ Example: XAUUSD
This is model 2 entry on Weekly range and Model 1 on Daily CLS range. Let's not overcomplicate. Look at the order block our initial point for the measuring our target and check where is the 2 Std. Projecting 2 St.D gave me confidence that CLS highs could be reached easily as it all was aligned with HTF trend so I held the trade for the whole week. Exited little bit bellow, but as it was reaction on LTF OB and Friday, I didnt want to hold in the trade over the weekend. 4️⃣ Example :EURUSD
Another EURUSD trade example after sweeping a low and creating order block We can that 2 STD aligns with CLS highs so its perfect target and we can see sharp expansion to the 2 St. D then price started retracing and consolidating, If we targeting bigger targets we would be for 2 days in this choppy range now. 📌This tool is not a strategy it self its just something what can help us to set reasonable targets while we don't have to face big pullbacks. Im not saying you should go only for 2.3 RR as I do. If you can hold traders for 3RR and more you are great trader.
📌However I found that when Im targeting 3R and more, I must face pullback and watch how my gains go back to the markets which I dont like. Im still human and have emotions and you know how it feels when you have a great trade developing and then in a blink of the eye its back on your entry.
📌Also by targeting just 2.3 RR is a clean shot and I realized that I can increase my risk per trade for such setups because they are hitting TP more often than 3RR trades. So in the end it's less stress and better profits. But it's all about a personal preferences.
Let me know what is your average RR and reason you targeting it.
David Perk aka Dave Fx Hunter
NOV.30,2025 BITCOIN (BTC) PRICE CHART ANALYSISBitcoin on the monthly and Weekly charts has officially confirmed a bearish cycle. The daily chart is consolidating around the 21 EMA resistance moving average. I think the sideways price action will continue for a while as the weekly candle we have formed is an inside bar candle suggesting a pause.
What I am carefully watching is these fib level on the daily chart ( 90,793, 94,219, 98,573). A break above 98k zone could put the $103k & $109k level on the table. Since we have daily cycle high, I think price will continue sideways with the 21EMA holding resistance, this level is also the 0.382 fib of the last impulse selling, before a continuation to the downside.
The weekly chart has hit stochastic cycle low and RSI could also keep up into the 35 level before the next strong selling, so patience here is important. Both the weekly and monthly still confirms the bottom is not here yet and more falling is very likely at this point. With the monthly MACD officially crossing down since July 2023 when this rally began. If these indicators proves right, BTC will continue to fall for the next few months.
These are my thoughts and observation on Bitcoin price action. Practice some risk management and money management as the market maker will seek to do a liquidation event before the downtrend continuation.
Thank you as always for reading my publications and kindly support my work with a boost and share what you think in the comments section. Let's be a community that conquers the market together. Cheers!!!

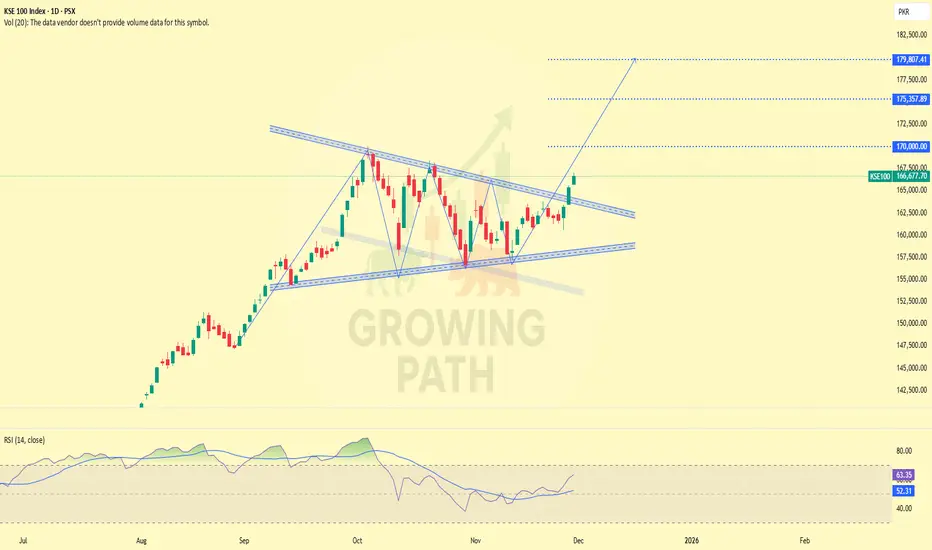
KSE100 — Daily | Breakout Confirmation + Upside TargetsThe index has confirmed a clean breakout from the falling channel and is now holding firmly above the trendline structure. Price has shifted into a stronger bullish posture compared to previous sessions.
The RSI has moved above 60, indicating momentum is entering bullish territory. Multiple higher-timeframe closes (weekly & monthly) also support continuation to the upside.
As long as price remains above the breakout zone, the upward targets remain active:
Targets:
• 170,000
• 175,350
• 179,800
Minor resistance lies near 168,200 and 170,000, but the broader structure favors continuation as long as the breakout holds.
Bias: Bullish
Invalidation: Breakdown below the channel support or failure to hold above the breakout level.
AUDUSD FRGNT WEEKLY FORECAST -Q4 | W49 | Y25 |📅 Q4 | W49 | Y25 |
📊 AUDUSD FRGNT WEEKLY FORECAST
🔍 Analysis Approach:
I’m applying Smart Money Concepts, focusing on:
Identifying Points of Interest on the Higher Time Frames (HTFs) 🕰️
Using those POIs to define a clear trading range 📐
Refining those zones on Lower Time Frames (LTFs) 🔎
Waiting for a Break of Structure (BoS) for confirmation ✅
This method allows me to stay precise, disciplined, and aligned with the market narrative, rather than chasing price.
💡 My Motto:
"Capital management, discipline, and consistency in your trading edge."
A positive risk-to-reward ratio, paired with a high win rate, is the backbone of any solid trading plan 📈🔐
⚠️ Losses?
They’re part of the mathematical game of trading 🎲
They don’t define you — they’re necessary, they happen, and we move forward 📊➡️
🙏 I appreciate you taking the time to review my Daily Forecast.
Stay sharp, stay consistent, and protect your capital
— FRNGT 🚀
FX:AUDUSD

Working hard yet poor while Others get wealthy, answer is DCAEver wondered why you work so hard yet your wealth doesn’t grow
How some people with the exact same income quietly multiply their assets
The answer is a simple calm strategy that whales follow It is called DCA
Hello✌️
Spend 3 minutes ⏰ reading this educational material.
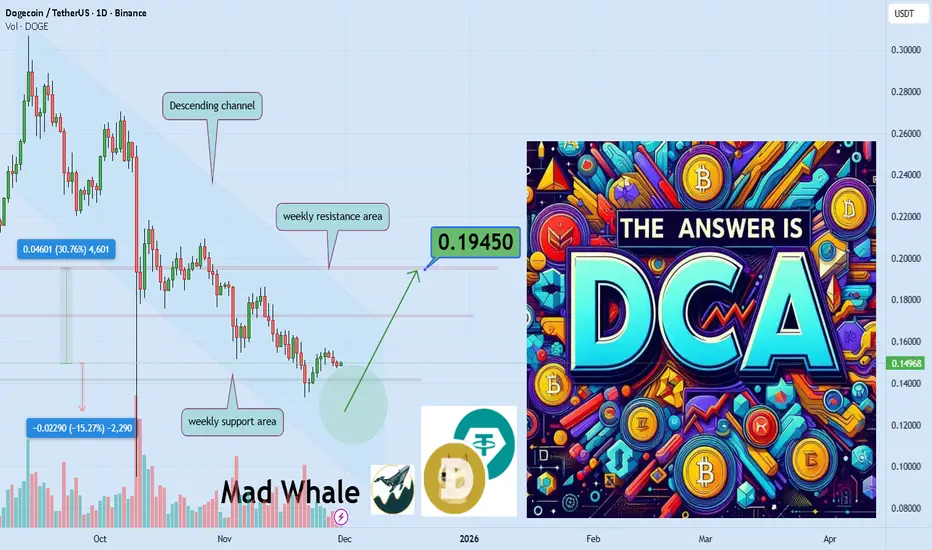
🎯 Analytical Insight on doge:
I expect a much bigger rise for Ripple than what I have shown on the chart. But we should remember that every year when the New Year approaches the market usually goes bearish. We need to wait and pass through that period to see what the final result will be.
Now , let's dive into the educational section,
The problem isn’t the market it is our behavior 🧠
Many wait for the perfect entry and never enter at all
Others rush to buy the top then panic sell the bottom
This behavior kills wealth and wastes precious time
The market never rewards emotional chaos
DCA means order inside crypto chaos ⏳
Crypto volatility punishes the impatient every single time
Buying periodically stops emotional decision making
If price drops you accumulate cheaper
If price rises your position grows stronger
Why whales never act like retail traders 🐳
Whales never throw all capital at once into the market
They use every dip as a quiet accumulation opportunity
DCA is simply whale strategy in a smaller scale
Slow silent and incredibly powerful
Greed is the hidden enemy of retail 🔥
Our mind always asks for fast and huge profits
But real profits go only to the patient ones
DCA isn’t greedy but builds true wealth
Each small buy is one step toward financial freedom
When everyone is hopeless you own the future ⚡
In bear markets emotional traders give up
But DCA traders become the future winners
The market rewards those who continue
Not those who stop because of fear
Your DCA plan must stay simple 📝
Define a monthly amount that never hurts your life
Choose a fixed time so it becomes a habit
Pick strong and credible long term assets only
Most important never break discipline for news or hype
summary 🎯
If you work hard but wealth doesn’t grow
The problem is not effort the problem is no system
TradingView features that make DCA smarter 📈
Price alerts so the market never surprises your entries
Moving averages to confirm trend before new allocation
Support zones marked with horizontal levels for optimal steps
Volume indicator to detect where big money is building positions
Percent labels to track the efficiency of every DCA buy
A clean focused watchlist to keep best assets always visible
survival tips for crypto investors 🔑
Never sacrifice long term patience for short term excitement
Volatility copies your mindset stay balanced and volatility works for you
True wealth goes to those who continue even during deep red days
✨ Need a little love!
We pour love into every post your support keeps us inspired! 💛 Don’t be shy, we’d love to hear from you on comments. Big thanks , Mad Whale 🐋
📜Please make sure to do your own research before investing, and review the disclaimer provided at the end of each post.
SLP explosion is coming 30%gain toward 0.001165$Hi the support and resistances on the chart are based on the previous data and weekly candlesticks if BINANCE:SLPUSDT holds this last support the potential of 30% gain is logical toward 0.001165$

GBPUSD FRGNT WEEKLY FORECAST - Q4 | W49 | Y25 |📅 Q4 | W49 | Y25 |
📊 GBPUSD FRGNT WEEKLY FORECAST
🔍 Analysis Approach:
I’m applying Smart Money Concepts, focusing on:
Identifying Points of Interest on the Higher Time Frames (HTFs) 🕰️
Using those POIs to define a clear trading range 📐
Refining those zones on Lower Time Frames (LTFs) 🔎
Waiting for a Break of Structure (BoS) for confirmation ✅
This method allows me to stay precise, disciplined, and aligned with the market narrative, rather than chasing price.
💡 My Motto:
"Capital management, discipline, and consistency in your trading edge."
A positive risk-to-reward ratio, paired with a high win rate, is the backbone of any solid trading plan 📈🔐
⚠️ Losses?
They’re part of the mathematical game of trading 🎲
They don’t define you — they’re necessary, they happen, and we move forward 📊➡️
🙏 I appreciate you taking the time to review my Daily Forecast.
Stay sharp, stay consistent, and protect your capital
— FRNGT 🚀
FX:GBPUSD

BECO – Weekly | Bearish Divergence + Golden Zone Support TestPrice has formed Higher Highs while RSI has formed Lower Highs — a textbook bearish divergence indicating weakening momentum.
The Fibonacci Golden Zone (4.94–4.01) aligns with a major structural support cluster.
This zone will likely decide the next trend direction.
Holding this zone may trigger continuation to the upside, while a breakdown from this area could lead to a deeper correction.
Key Levels:
• Resistance: 8.85
• Supports: 5.00 – 4.60 – 4.00
• Bearish divergence active
• Volume weakening near highs

SPY Buyers In Panic! SELL!
My dear followers,
This is my opinion on the SPY next move:
The asset is approaching an important pivot point 683.34
Bias - Bearish
Safe Stop Loss - 688.64
Technical Indicators: Supper Trend generates a clear short signal while Pivot Point HL is currently determining the overall Bearish trend of the market.
Goal - 674.67
About Used Indicators:
For more efficient signals, super-trend is used in combination with other indicators like Pivot Points.
Disclosure: I am part of Trade Nation's Influencer program and receive a monthly fee for using their TradingView charts in my analysis.
———————————
WISH YOU ALL LUCK

NVDA🌎NVIDIA: At the Peak or the Brink?
Nvidia's record highs are accompanied by warning signs. A market cap of $4.37 trillion and a P/E ratio of 51 indicate inflated expectations.
Risks:
Speculative demand: The $23.7 billion investment looks like an artificial market pump.
Macro threats: The AI boom will face energy shortages.
Historical parallel: The scenario mirrors Cisco's pre-dot-com bubble.
Fierce competition: AMD, Intel, and cloud giants are creating their own chips.
Growth drivers:
Leadership in AI, a closed CUDA ecosystem, and 66% data center revenue growth.
Nvidia is a leader, but its shares have become a high-risk asset. Any slowdown in business performance will lead to a collapse in the stock price.
The baseline scenario is a broad sideways trend.

NOV.30,2025 ANALYSIS ON SPX500 & NAS100 INDICES The monthly charts have printed hanging man candles and hence if the closing of next month candle is below the body of the candle, it will confirm that the rally is over and the next months have a bearish setup. Indicators also support the rally is over based on the weekly and daily charts on both indices.
The weekly candle looks bullish but since the volume is low it does not confirm the rally and is a market maker manipulation setup for retail traders. For shorts bias use tight stop loss, price should not exceed the invalidation levels noted in the video.
The daily charts also show a hidden bearish divergence on MACD Histogram bars, Stochastic cycle & Momentum at fib resistance of 0.786 retrace and Oct, 2023 fib extension of 1) for the SPX500 and fib 0.618 retrace for the NAS100. Daily Stoch cycles support shorts more than long. Price uprise since Wed, Nov 26th, has been on declining momentum, see MACD histogram on 4H. RSI is overbought on 4H with a hidden bearish divergence too.
So, I see more bearish signal on the indices than bullish continuation.
Thank you again for supporting my publications and consider giving my publication a boost and comment with your own insights too. Iron sharpens Iron, let conquer the market together. Cheers !!

NIFTY Analysis for 01st Nov '25: IntraSwing Spot & FUT levels✍🏼️ "Future IntraSwing Levels" mentioned in BOX format.
✍🏼️ "WEEKLY Levels" mentioned in BOX format.
[ Level Interpretation / description:
L#1: If the candle crossed & stays above the “Buy Gen”, it is treated / considered as Bullish bias.
L#2: Possibility / Probability of REVERSAL near RLB#1 & UBTgt
L#3: If the candle stays above “Sell Gen” but below “Buy Gen”, it is treated / considered as Sidewise. Aggressive Traders can take Long position near “Sell Gen” either retesting or crossed from Below & vice-versa i.e. can take Short position near “Buy Gen” either retesting or crossed downward from Above.
L#4: If the candle crossed & stays below the “Sell Gen”, it is treated / considered a Bearish bias.
L#5: Possibility / Probability of REVERSAL near RLS#1 & USTgt
HZB (Buy side) & HZS (Sell side) => Hurdle Zone,
*** Specialty of “HZB#1, HZB#2 HZS#1 & HZS#2” is Sidewise (behaviour in Nature)
Rest Plotted and Mentioned on Chart
Color code Used:
Green =. Positive bias.
Red =. Negative bias.
RED in Between Green means Trend Finder / Momentum Change
/ CYCLE Change and Vice Versa.
Notice One thing: HOW LEVELS are Working.
Use any Momentum Indicator / Oscillator or as you "USED to" to Take entry.
⚠️ DISCLAIMER:
The information, views, and ideas shared here are purely for educational and informational purposes only. They are not intended as investment advice or a recommendation to buy, sell, or hold any financial instruments. I am not a SEBI-registered financial adviser.
Trading and investing in the stock market involves risk, and you should do your own research and analysis. You are solely responsible for any decisions made based on this research.
"As HARD EARNED MONEY IS YOUR's, So DECISION SHOULD HAVE TO BE YOUR's".
Do comment if Helpful .
In depth Analysis will be added later (If time Permits)
