PINL – TECH BUY CALL | 1D |Oct 23, 2025 | By The Chart AlchemistPINL – TECH BUY CALL | 1D | October 23, 2025 | By The Chart Alchemist
Technical Overview:
The stock PINL appears to have completed its recent pullback phase and is showing signs of renewed bullish strength. Price action has stabilized near key support, suggesting the end of corrective pressure. With momentum indicators improving and volume starting to build, the setup favors a potential breakout toward higher resistance levels. A sustained move above the current range could initiate a strong upward continuation.
📢 Technical Analysis by Mushtaque Muhammad (The Chart Alchemist)
Contains image

DHPL – TECH BUY CALL | 1D | Oct 23, 2025 | The Chart AlchemistDHPL – TECH BUY CALL | 1D | Oct 23, 2025 | The Chart Alchemist
Technical Overview:
The stock DHPL has completed its recent pullback and is showing early signs of renewed bullish momentum. Price action indicates a potential reversal from the lower boundary of its short-term correction channel. With buyers stepping back in near support levels, the structure suggests the beginning of a new upward leg within the broader uptrend. Sustained trading above the current zone could trigger momentum toward the listed targets.
📢 Technical Analysis by Mushtaque Muhammad (The Chart Alchemist)

GOLD 4H CHART ROUTE MAP UPDATE & TRADING PLAN FOR THE WEEKHey Everyone,
Please see our updated 4h chart levels and targets for the coming week.
We are seeing price play between two weighted levels with a gap above at 4333 and a gap below at 4225. We will need to see ema5 cross and lock on either weighted level to determine the next range.
We will see levels tested side by side until one of the weighted levels break and lock to confirm direction for the next range.
We will keep the above in mind when taking buys from dips. Our updated levels and weighted levels will allow us to track the movement down and then catch bounces up.
We will continue to buy dips using our support levels taking 20 to 40 pips. As stated before each of our level structures give 20 to 40 pip bounces, which is enough for a nice entry and exit. If you back test the levels we shared every week for the past 24 months, you can see how effectively they were used to trade with or against short/mid term swings and trends.
The swing range give bigger bounces then our weighted levels that's the difference between weighted levels and swing ranges.
BULLISH TARGET
4333
EMA5 CROSS AND LOCK ABOVE 4333 WILL OPEN THE FOLLOWING BULLISH TARGETS
4422
EMA5 CROSS AND LOCK ABOVE 4422 WILL OPEN THE FOLLOWING BULLISH TARGET
4494
EMA5 CROSS AND LOCK ABOVE 4494 WILL OPEN THE FOLLOWING BULLISH TARGET
4572
BEARISH TARGETS
4225
EMA5 CROSS AND LOCK BELOW 4225 WILL OPEN THE FOLLOWING BEARISH TARGET
3985
EMA5 CROSS AND LOCK BELOW 4122 WILL OPEN THE SWING RANGE
3985
3857
EMA5 CROSS AND LOCK BELOW 3857 WILL OPEN THE SECONDARY SWING RANGE
3741
3632
As always, we will keep you all updated with regular updates throughout the week and how we manage the active ideas and setups. Thank you all for your likes, comments and follows, we really appreciate it!
Mr Gold
GoldViewFX

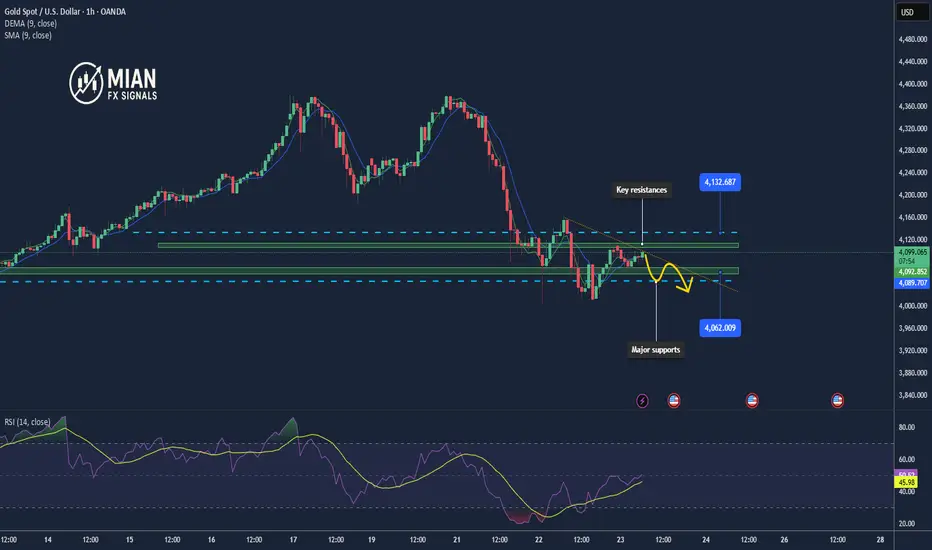
Gold consolidates at 4090 – Downside risk if 4070 breaks1. Market Overview
Gold (XAU/USD) rebounded slightly from the 4081 low after a quick wick rejection, now trading around 4090–4092. The market remains under pressure from the upper supply zone, while buying momentum is still weak. Traders are waiting for U.S. economic data later today to determine the next direction.
________________________________________
2. Technical Analysis
• Main trend: Short-term bearish
• Key resistances: 4108 – 4115 – 4132
• Major supports: 4070 – 4060 – 4045
• EMA50/200 (H1): Still in a bearish crossover, indicating ongoing downside momentum.
• H1 Candles: Narrow range with long lower wicks — showing mild buying but no strength.
• RSI (H1): Hovering around 45 – not oversold yet, leaving room for further decline.
________________________________________
3. Outlook
Gold remains in a consolidation phase after a recent drop, with no clear reversal signal yet. As long as the price stays below 4115, the short-term bearish bias prevails. A break below 4070 could push prices toward 4060 or even 4045. Conversely, a close above 4115 (H1) may trigger a short-term bullish correction.
________________________________________
4. Trading Strategy
🔻 SELL XAU/USD
Entry: 4111 – 4114
🎯 TP: 40 / 80 / 200 pips
🛑 SL: 4117
🔺 BUY XAU/USD
Entry: 4061 – 4064
🎯 TP: 40 / 80 / 200 pips
🛑 SL: 4058
EURCAD - Bounce Play at the Rail!EURCAD has been respecting its ascending channel beautifully , bouncing between the rails like clockwork. And right now, price is once again retesting the lower trendline, where buyers have consistently stepped in before launching new bullish waves.
🏹As long as this trendline and minor support around 1.62 hold firm, I’ll be watching closely for bullish rejections or reversal patterns to confirm a fresh leg upward. A clean bounce from here could send price back toward the orange structure zone around 1.6350, followed by a potential push toward 1.64+ if momentum builds up.
⚔️However, a break and close below 1.6180 would invalidate the setup and could shift control back to the bears — but until that happens, the path of least resistance remains to the upside.
In short, I’m expecting EURCAD to trap late sellers and fuel another rebound from the channel’s base, the kind of move that rewards patience and precision.
📊 All Strategies Are Good; If Managed Properly!
~Richard Nasr

Comparison: Gold’s Triple Top vs. EthereumLet’s take a look at the charts. Gold formed a triple top before breaking out strongly, and the current Ethereum structure looks strikingly similar, only moving much faster.
The gold chart you see here developed over 15 years, while Ethereum’s pattern has taken shape in just 4 years.
When a resistance level is tested multiple times, it often eventually breaks.
I’m sharing this analysis to help you recognize recurring patterns across markets. History doesn’t repeat itself perfectly, but it often rhymes.

2008 Crisis and How the Banking System Has Changed Since:
⚠️These headlines serve as a reminder that despite the Basel I, II, and III global banking regulations, we have not been spared from systemic risks originating within the financial system itself
🏦After the 2008 crisis, banks became heavily overregulated. As a result, many of their most lucrative investment and financing activities shifted into affiliated offshore hedge funds — entities that remain very much part of the same global financial machinery. They are simply no longer called “banks,” and therefore escape almost all regulation.
💵These hedge funds lend, repackage loans, buy and sell exotic financial instruments, re-hypothecate, and re-collateralize. They use questionable collateral to issue risky loans , which are then resold, repackaged, and used again as collateral again.
💰 Exotic derivatives, curreny swaps, REPO operations, outright fraud,risky options market-making, — you name it — all thrive offshore , far from regulatory oversight yet just a click away for clients. And make no mistake: these so-called “non-banks” are deeply interconnected with the global financial system. If they fail, the shockwaves will be felt everywhere.
📈 The next financial tsunami will begin offshore — but it’s the onshore world that will be hit the hardest . So don’t keep large sums of money in the bank, guys. Once your funds are in the bank, they’re no longer truly yours — they belong to the bank. Your account can be frozen, blocked, seized, taxed, or even converted into shares (as happened in Spain in 2011).
⚠️And remember: banks can fail. They will fail. And when they do — the government won’t save you.
Yours truly,
Greg🌹

GLMRUSDT Macro Downtrend Intact, Key Levels DefinedGLMRUSDT remains in a firm macro downtrend. The key Main Sell-off zone ($2-$2.61) is the primary resistance to watch for any short to mid-term rallies. Until that area is broken, the path of least resistance is down. The Area of Interest for a potential long-term bottom lies between $0.0.0219 to $0.039 watch for a confirmed bullish reversal there. A break below $0.0185 signals a continuation of the downtrend.

TradeCityPro BNBUSDT Heading Toward a New ATH?👋 Welcome to TradeCityPro Channel!
Let’s dive into the BNB (Binance Coin) analysis — one of the strongest and most bullish charts in the market. Currently, after correcting from its All-Time High (ATH), the price is consolidating within a sideways range, showing that buyers and sellers are in a tug-of-war.
🌐 Overview of Bitcoin
Before we begin, note that we’ve moved the Bitcoin analysis to a dedicated daily report for deeper insights into its market behavior, dominance, and trend structure:
👉 TradeCityPro Bitcoin Daily Analysis
📊 Technical Overview (4H Timeframe)
After facing a heavy rejection from its ATH, BNB once again attempted to retest that level. However, a fake breakout (false move above resistance) led to another sharp correction, pushing the price back down into the range.
Interestingly, this correction bounced exactly from the $1054 support zone, the same level that previously acted as a strong reversal point. This repeated reaction confirms how critical this support is — not only because it aligns with the 50% Fibonacci retracement level, but also due to its importance in the Dow Theory structure as a mid-wave equilibrium.
📈 Long Setup (Bullish Scenario)
If price breaks above $1129, it could trigger an early long position setup — signaling that buyers are regaining control before another major leg up. This move would likely be the early breakout signal ahead of a potential new ATH attempt.
📉 Short Setup (Bearish Scenario)
For short positions, the $1054 level remains the key trigger. A clean breakdown below this zone would indicate the loss of a major support and could open the way for a deeper retracement.
However, keep in mind — this is a high-impact support zone, so avoid placing tight stop-losses or over-leveraged entries. Price volatility is expected to increase around this level.
🎯 Conclusion
BNB remains one of the strongest altcoins structurally, and as long as it holds above the $1050 region, the bullish structure remains valid. The next few sessions will be crucial — watch the $1129 breakout for confirmation of renewed bullish momentum, or the $1054 breakdown for signs of weakness.
📝 Final Thoughts
Stay calm, trade wisely, and let's capture the market's best opportunities!
This analysis reflects our opinions and is not financial advice.

EURUSD Sell Setup | HTF OB + Asia Liquidity Grab📉 On EURUSD, the overall market structure remains bearish — price has been consistently forming lower highs and lower lows, clearly showing that sellers are still in control on the higher timeframe.
Currently, the market is just in a corrective phase, retracing upward after a strong impulsive drop. This correction aligns perfectly with a Higher-Timeframe Order Block (HTF OB), which sits just above the Asian session liquidity.
💧 Liquidity Context:
During the Asian session, liquidity built up above recent minor highs.
Now, the market has swept that liquidity, tapping into the area where institutional orders are likely resting (HTF OB).
This combination of liquidity grab + OB retest gives a strong bearish confluence for a potential sell-side continuation.
💡 Setup Plan:
1️⃣ Let the market fully take out the Asian session liquidity above the recent high.
2️⃣ Once liquidity is taken and price taps into the HTF OB, shift focus to LTF confirmation zones (1M–5M).
3️⃣ Watch for clear bearish confirmation such as:
Minor CHOCH or MSS,
Strong bearish engulfing candle,
Formation of lower highs & lower lows on LTF.
4️⃣ After confirmation → plan for sell entries following the dominant bearish flow.
5️⃣ No confirmation = no trade ❌ — stay patient and disciplined.
🎯 Target:
The next swing low or liquidity pool below recent lows — depending on intraday momentum and volatility.
🧩 Setup Summary:
Market Bias → Bearish
Confluence → HTF OB + Asia Session Liquidity Grab
Entry → Only after strong LTF confirmation
Target → Next Swing Low / Liquidity Pool
Type → Scalp to Intraday Sell Setup
Risk Rule → Confirmation-based entry only
⚠️ Disclaimer:
This is my personal analysis and not financial advice.
Always trade according to your own plan, and manage your risk wisely.

Gold market Daily demands through to 4157Gold market enters a reform phase, aligning with daily demand at 4157, suggesting potential bullish reaccumulation as price stabilizes within this key zone. yall note this zones
🔑 Key Zone: 4157 (Daily Demand)
📈 Bias: Bullish reform phase pending confirmation above intraday structure follow for more insights , comment and boost idea

$ASTER (8-HOUR): DOUBLE BOTTOM / FALLING WEDGE combo in-playSEED_WANDERIN_JIMZIP900:ASTER 8-HOUR chart updated. That FALLING WEDGE / DOUBLE BOTTOM potential reversal combo at 97c did work, for now, I didn't take the trade, mainly due to declining on-chain numbers.
People might have had enough of leverage trading for this year already and the next one, too. These DEXES will have a real problem growing numbers soon, and kind of already what I have been seeing with the numbers, real or still cooked.
Perp volumes in decline for a week, fees at just a fraction of their record-breaking claims a few feeks ago. So many red flags here.
That has to be compared do GETTEX:HYPE inevitably, next posts☝️
As far as the chart itself, no LONG until $1.12 FALLING WEDGE breakout. Volumes have been terrible so that's a total MUST before taking a position. And some bull divergences, nothing here yet.
💙👽

#BTC retests support at 104,000. Can it hold?📊 #BTC retests support at 104,000. Can it hold?
🧠From a structural perspective, the pullback after reaching our ideal red target zone makes sense. After the October 11th crash, market liquidity suffered a devastating blow, so we're likely to see some period of sideways consolidation. Therefore, we continued to reduce our holdings after hitting our short defensive point, locking in a total of 80% profit. Our long position has now been closed at our cost price.
➡️This is the third time we've tested support near 107,400. The more times it's tested, the weaker the support becomes. However, don't chase shorts near this support level. Even if you do short, wait for a break below this support level and a rebound before considering a short position.
➡️If the decline continues, support near 105,188 or the solid support at 103,588 (where we last entered a long position) is worth watching.
Let's see 👀
🤜If you like my analysis, please like 💖 and share 💬 BITGET:BTCUSDT.P

EURJPY Trading Opportunity! SELL! My dear followers,
This is my opinion on the EURJPY next move:
The asset is approaching an important pivot point 176.95
Bias - Bearish
Technical Indicators: Supper Trend generates a clear short signal while Pivot Point HL is currently determining the overall Bearish trend of the market.
Goal - 176.33
About Used Indicators:
For more efficient signals, super-trend is used in combination with other indicators like Pivot Points.
Disclosure: I am part of Trade Nation's Influencer program and receive a monthly fee for using their TradingView charts in my analysis.
———————————
WISH YOU ALL LUCK

EURUSD FRGNT Daily Forecast -Q4 | W43 | D23| Y25 |📅 Q4 | W43 | D23| Y25 |
📊 EURUSD FRGNT Daily Forecast
🔍 Analysis Approach:
I’m applying Smart Money Concepts, focusing on:
Identifying Points of Interest on the Higher Time Frames (HTFs) 🕰️
Using those POIs to define a clear trading range 📐
Refining those zones on Lower Time Frames (LTFs) 🔎
Waiting for a Break of Structure (BoS) for confirmation ✅
This method allows me to stay precise, disciplined, and aligned with the market narrative, rather than chasing price.
💡 My Motto:
"Capital management, discipline, and consistency in your trading edge."
A positive risk-to-reward ratio, paired with a high win rate, is the backbone of any solid trading plan 📈🔐
⚠️ Losses?
They’re part of the mathematical game of trading 🎲
They don’t define you — they’re necessary, they happen, and we move forward 📊➡️
🙏 I appreciate you taking the time to review my Daily Forecast.
Stay sharp, stay consistent, and protect your capital
— FRNGT 🚀
OANDA:EURUSD

Patience - When Calm Feels WrongNOTE – This is a post on mindset and emotion. It is not a trade idea or strategy designed to make you money. My intention is to help you preserve your capital, focus, and composure — so you can trade your own system with calm and confidence.
Markets quiet down.
Price moves slow.
Everything looks still, maybe too still.
Part of you relaxes.
Another part tenses.
It’s that sense that something’s coming.
And sometimes, it is.
But here’s the hard part
Your body doesn’t always know the difference between anticipating danger and feeling unsafe.
For traders, the nervous system reads uncertainty like threat.
Even a normal pause in volatility can trigger the same internal siren:
Something’s wrong. Do something.
You start scanning: news, charts, signals
anything to justify the unease.
But often, the danger isn’t out there.
It’s inside you... a learned association between stillness and not knowing what's going to happen next
Which causes restlessness, uncertainty and a need to fidget and meddle.
The skill isn’t in shutting that instinctive unease down.
It’s in listening without reacting impulsively.
Ask yourself - what is really going on right here, right now?
The point here is:
Patience isn’t passive.
It’s regulated awareness.
It’s being alert, not alarmed.
Ready, but not restless.
Sometimes there is indeed a risk out there.
We are trading the financial markets after all.
However. You have a trading plan.
You know to be risk measured.
All that is needed now is the ability to regulate yourself
Stay calm and patient so you can execute your plan as intended.


SENSEX Intraday Levels for 24th Oct 2025✍🏽️ Yesterday night GIFTNITY Closed Near +1.4+%
In Social Network & Analyst fraternity sitting & Shouting in Business Channel NEW High with Gapup of 300+ points, BUT NEVER REACHED 300+ Points during whole day of Trading. Also Notice One thing All the Gains in First 3-4 hours of trade absorbed in Last hour & Closd Near Day LOW & Near Monday Close.
But as per my Level No 5 min Candle Closed Above my mentioned "UBTgt @ 26098.55 ( Though at 12.45 pm European Market opening Session a Knee-Jurk reaction made a high @ 26104, but with that Candle Closed Near 26078.✍🏽️
🚀 "WEEKLY Levels" mentioned in BOX format.
🌡️Plot Levels Using 3 Min, 5 Min Time frame in your Chart for Better Analysis
L#1: If the candle crossed & stays above the “Buy Gen”, it is treated / considered as Bullish bias.
L#2: Possibility / Probability of REVERSAL near RLB#1 & UBTgt
L#3: If the candle stays above “Sell Gen” but below “Buy Gen”, it is treated / considered as Sidewise. Aggressive Traders can take Long position near “Sell Gen” either retesting or crossed from Below & vice-versa i.e. can take Short position near “Buy Gen” either retesting or crossed downward from Above.
L#4: If the candle crossed & stays below the “Sell Gen”, it is treated / considered a Bearish bias.
L#5: Possibility / Probability of REVERSAL near RLS#1 & USTgt
HZB (Buy side) & HZS (Sell side) => Hurdle Zone,
*** Specialty of “HZB#1, HZB#2 HZS#1 & HZS#2” is Sidewise (behaviour in Nature)
Rest Plotted and Mentioned on Chart
Color code Used:
Green =. Positive bias.
Red =. Negative bias.
RED in Between Green means Trend Finder / Momentum Change
/ CYCLE Change and Vice Versa.
Notice One thing: HOW LEVELS are Working.
Use any Momentum Indicator / Oscillator or as you "USED to" to Take entry.
⚠️ DISCLAIMER:
The information, views, and ideas shared here are purely for educational and informational purposes only. They are not intended as investment advice or a recommendation to buy, sell, or hold any financial instruments. I am not a SEBI-registered financial adviser.
Trading and investing in the stock market involves risk, and you should do your own research and analysis. You are solely responsible for any decisions made based on this research.
"As HARD EARNED MONEY IS YOUR's, So DECISION SHOULD HAVE TO BE YOUR's".
Do comment if Helpful .
In depth Analysis will be added later (If time Permits)

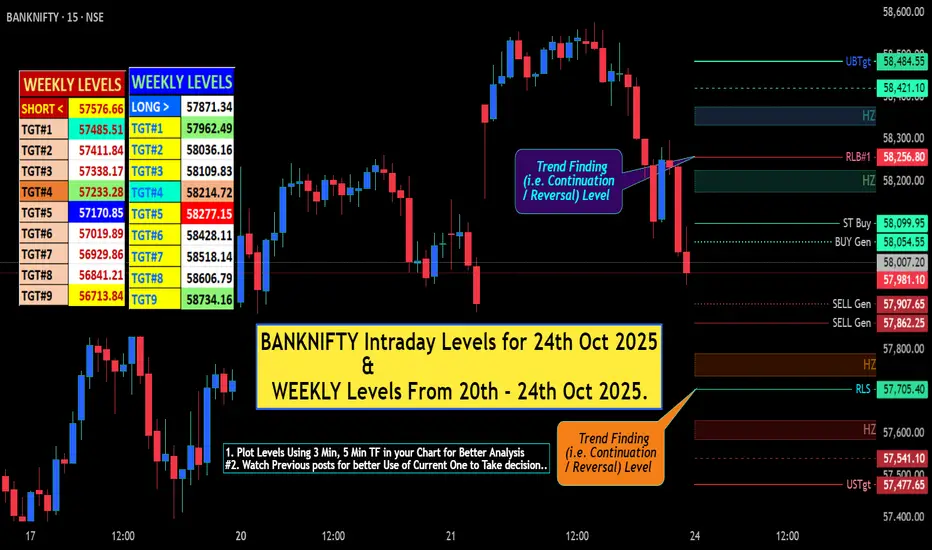
BANKNIFTY Intraday Levels for 24th Oct 2025✍🏽️ Yesterday night GIFTNITY Closed Near +1.4+%
In Social Network & Analyst fraternity sitting & Shouting in Business Channel NEW High with Gapup of 300+ points, BUT NEVER REACHED 300+ Points during whole day of Trading. Also Notice One thing All the Gains in First 3-4 hours of trade absorbed in Last hour & Closd Near Day LOW & Near Monday Close.
But as per my Level No 5 min Candle Closed Above my mentioned "UBTgt @ 26098.55 ( Though at 12.45 pm European Market opening Session a Knee-Jurk reaction made a high @ 26104, but with that Candle Closed Near 26078.✍🏽️
🚀 "WEEKLY Levels" mentioned in BOX format.
🌡️Plot Levels Using 3 Min, 5 Min Time frame in your Chart for Better Analysis
L#1: If the candle crossed & stays above the “Buy Gen”, it is treated / considered as Bullish bias.
L#2: Possibility / Probability of REVERSAL near RLB#1 & UBTgt
L#3: If the candle stays above “Sell Gen” but below “Buy Gen”, it is treated / considered as Sidewise. Aggressive Traders can take Long position near “Sell Gen” either retesting or crossed from Below & vice-versa i.e. can take Short position near “Buy Gen” either retesting or crossed downward from Above.
L#4: If the candle crossed & stays below the “Sell Gen”, it is treated / considered a Bearish bias.
L#5: Possibility / Probability of REVERSAL near RLS#1 & USTgt
HZB (Buy side) & HZS (Sell side) => Hurdle Zone,
*** Specialty of “HZB#1, HZB#2 HZS#1 & HZS#2” is Sidewise (behaviour in Nature)
Rest Plotted and Mentioned on Chart
Color code Used:
Green =. Positive bias.
Red =. Negative bias.
RED in Between Green means Trend Finder / Momentum Change
/ CYCLE Change and Vice Versa.
Notice One thing: HOW LEVELS are Working.
Use any Momentum Indicator / Oscillator or as you "USED to" to Take entry.
⚠️ DISCLAIMER:
The information, views, and ideas shared here are purely for educational and informational purposes only. They are not intended as investment advice or a recommendation to buy, sell, or hold any financial instruments. I am not a SEBI-registered financial adviser.
Trading and investing in the stock market involves risk, and you should do your own research and analysis. You are solely responsible for any decisions made based on this research.
"As HARD EARNED MONEY IS YOUR's, So DECISION SHOULD HAVE TO BE YOUR's".
Do comment if Helpful .
In depth Analysis will be added later (If time Permits)
XAUUSD IDEA🟡 XAUUSD Trading Plan
📉 Sell Setup
Sell Zone: 4125 - 4085
Main Range: 4082 – 4158
Condition:
If price breaks below 4082, bearish momentum is expected.
Next Target: 4058 (continuation level)
✅ Summary:
Look for short opportunities between 4125–4085.
A confirmed break below 4082 may extend the drop toward 4058.
📈 Buy Setup
Buy Zone: Near 4059 (support area)
Target: 4199
Condition:
If price tests and holds 4059 support, expect bullish reversal toward 4199.
✅ Summary:
Wait for price to test 4059 — if it shows support or bullish confirmation, target 4199 for rebound.

GOLD BEARS WILL DOMINATE THE MARKET|SHORT
GOLD SIGNAL
Trade Direction: short
Entry Level: 4,107.17
Target Level: 3,579.84
Stop Loss: 4,459.30
RISK PROFILE
Risk level: medium
Suggested risk: 1%
Timeframe: 1D
Disclosure: I am part of Trade Nation's Influencer program and receive a monthly fee for using their TradingView charts in my analysis.
✅LIKE AND COMMENT MY IDEAS✅

AUD/CHF SENDS CLEAR BEARISH SIGNALS|SHORT
AUD/CHF SIGNAL
Trade Direction: short
Entry Level: 0.519
Target Level: 0.514
Stop Loss: 0.522
RISK PROFILE
Risk level: medium
Suggested risk: 1%
Timeframe: 6h
Disclosure: I am part of Trade Nation's Influencer program and receive a monthly fee for using their TradingView charts in my analysis.
✅LIKE AND COMMENT MY IDEAS✅

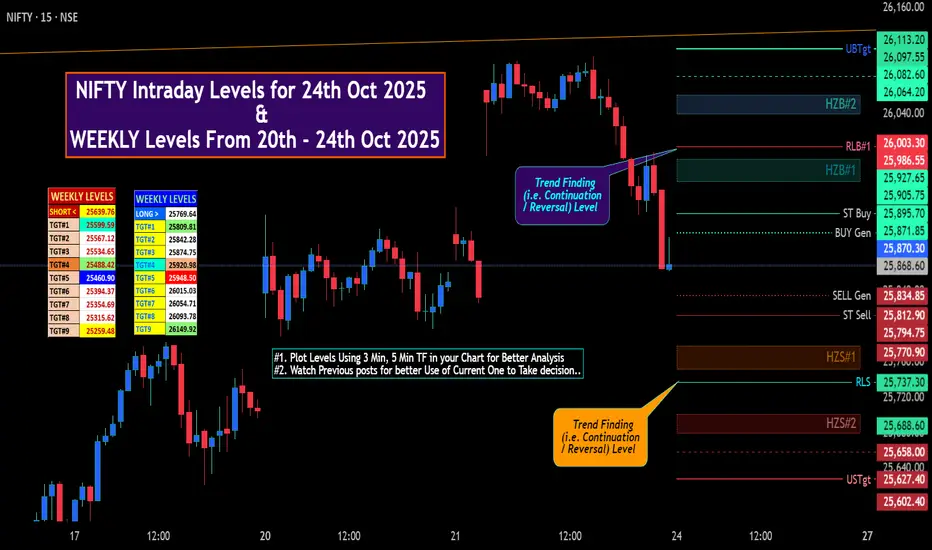
NIFTY Intraday Levels for 24th Oct 2025✍🏽️ Yesterday night GIFTNITY Closed Near +1.4+%
In Social Network & Analyst fraternity sitting & Shouting in Business Channel NEW High with Gapup of 300+ points, BUT NEVER REACHED 300+ Points during whole day of Trading. Also Notice One thing All the Gains in First 3-4 hours of trade absorbed in Last hour & Closd Near Day LOW & Near Monday Close.
But as per my Level No 5 min Candle Closed Above my mentioned "UBTgt @ 26098.55 ( Though at 12.45 pm European Market opening Session a Knee-Jurk reaction made a high @ 26104, but with that Candle Closed Near 26078.✍🏽️
🚀 "WEEKLY Levels" mentioned in BOX format.
🌡️Plot Levels Using 3 Min, 5 Min Time frame in your Chart for Better Analysis
L#1: If the candle crossed & stays above the “Buy Gen”, it is treated / considered as Bullish bias.
L#2: Possibility / Probability of REVERSAL near RLB#1 & UBTgt
L#3: If the candle stays above “Sell Gen” but below “Buy Gen”, it is treated / considered as Sidewise. Aggressive Traders can take Long position near “Sell Gen” either retesting or crossed from Below & vice-versa i.e. can take Short position near “Buy Gen” either retesting or crossed downward from Above.
L#4: If the candle crossed & stays below the “Sell Gen”, it is treated / considered a Bearish bias.
L#5: Possibility / Probability of REVERSAL near RLS#1 & USTgt
HZB (Buy side) & HZS (Sell side) => Hurdle Zone,
*** Specialty of “HZB#1, HZB#2 HZS#1 & HZS#2” is Sidewise (behaviour in Nature)
Rest Plotted and Mentioned on Chart
Color code Used:
Green =. Positive bias.
Red =. Negative bias.
RED in Between Green means Trend Finder / Momentum Change
/ CYCLE Change and Vice Versa.
Notice One thing: HOW LEVELS are Working.
Use any Momentum Indicator / Oscillator or as you "USED to" to Take entry.
⚠️ DISCLAIMER:
The information, views, and ideas shared here are purely for educational and informational purposes only. They are not intended as investment advice or a recommendation to buy, sell, or hold any financial instruments. I am not a SEBI-registered financial adviser.
Trading and investing in the stock market involves risk, and you should do your own research and analysis. You are solely responsible for any decisions made based on this research.
"As HARD EARNED MONEY IS YOUR's, So DECISION SHOULD HAVE TO BE YOUR's".
Do comment if Helpful .
In depth Analysis will be added later (If time Permits)