PEPE completed major breakout and retest time to pumpThe market has undergone a significant correction, which appears to have concluded after absorbing substantial liquidity. This consolidation phase has established a solid foundation for a potential strong bullish impulse. Consequently, BINANCE:PEPEUSDT is now well-positioned to approach the technical targets previously outlined on the chart.
DISCLAIMER: ((trade based on your own decision))
<<press like👍 if you enjoy💚
Contains image

BITCOIN (BTCUSD): Bullish Move From Support Confirmed?!
There is a high probability, that Bitcoin will bounce from
a key intraday horizontal support.
As a confirmation, I see a valid bullish CHoCH and a breakout
of a resistance line of a falling parallel channel.
I expect growth at least to 110.800 level.
❤️Please, support my work with like, thank you!❤️
I am part of Trade Nation's Influencer program and receive a monthly fee for using their TradingView charts in my analysis.

COPPER - Following Gold?Hello TradingView Family / Fellow Traders. This is Richard, also known as theSignalyst.
📈 COPPER has been overall bullish, trading inside the rising wedge pattern in blue.
At present, COPPER is undergoing a correction phase and it is hovering around the lower bound of the wedge.
Moreover, it is retesting a massive support zone marked in green.
🏹 Thus, the highlighted blue circle is a strong area to look for buy setups as it is the intersection of the green support and lower blue trendline acting as a non-horizontal support.
📚 As per my trading style:
As #COPPER approaches the blue circle zone, I will be looking for bullish reversal setups (like a double bottom pattern, trendline break , and so on...)
📚 Always follow your trading plan regarding entry, risk management, and trade management.
Good luck!
All Strategies Are Good; If Managed Properly!
~Rich

Vicor Corporation (NASDAQ: $VICR) Gearing for A Breakout The price of Vicor Corporation (NASDAQ: NASDAQ:VICR ) is set for a breakout amidst breaking out of a bullish symmetrical triangle pattern.
The asset has already broke the ceiling of the triangle with increasing momentum, the stock is poised for a 170% surge.
As of the time of writing, the stock is up 31.91% in Wednesday's market session.
In another news, Vicor Corporation (NASDAQ:VICR) reported Q3 CY2025 results exceeding the market’s revenue expectations , with sales up 18.5% year on year to $110.4 million. Its GAAP profit of $0.63 per share was significantly above analysts’ consensus estimates.

Nasty reversal candle on Silver monthly chart.Silver.
That is one nasty reversal candle on monthly chart.
Problem is that it's happening with price historically stretched from moving average, where corrections start.
There is an outlier chance we still get a melt-up.
8 more trading days to see how the dust settles.

$STBL (4-HOUR): RE-ENTRY into SPOT (10.5c)Ok I entered AQUISUK:STBL spot at 12.5c yesterday fully expecting a DEAD CAT on CRYPTOCAP:BTC which is exactly what we have been dealing with.
I had a STOP LOSS at 10.c, triggered but here I'm changing the strategy, decided to rebuy this and employ the tokens in the ecosystem, it's essentially a #stablecoin bet also, which makes sense at such low prices.
So, re-buying SPOT 10.5c again, the 4-HOUR chart supports the bullish bias flashing a BULL OBV diveregence after a recent BULL RSI hidden diveregence as well. Volumes on the latest rejection declining. All good and ready for upside, unless it all collapses due to Bitcoin's crash.
👽💙

GBPUSD FRGNT Daily Forecast New York Update .1 -Q4 | W43 | D22| 📅 Q4 | W43 | D22| Y25 |
📊 GBPUSD FRGNT Daily Forecast New York Update .1
🔍 Analysis Approach:
I’m applying Smart Money Concepts, focusing on:
Identifying Points of Interest on the Higher Time Frames (HTFs) 🕰️
Using those POIs to define a clear trading range 📐
Refining those zones on Lower Time Frames (LTFs) 🔎
Waiting for a Break of Structure (BoS) for confirmation ✅
This method allows me to stay precise, disciplined, and aligned with the market narrative, rather than chasing price.
💡 My Motto:
"Capital management, discipline, and consistency in your trading edge."
A positive risk-to-reward ratio, paired with a high win rate, is the backbone of any solid trading plan 📈🔐
⚠️ Losses?
They’re part of the mathematical game of trading 🎲
They don’t define you — they’re necessary, they happen, and we move forward 📊➡️
🙏 I appreciate you taking the time to review my Daily Forecast.
Stay sharp, stay consistent, and protect your capital
— FRNGT 🚀
FX:GBPUSD

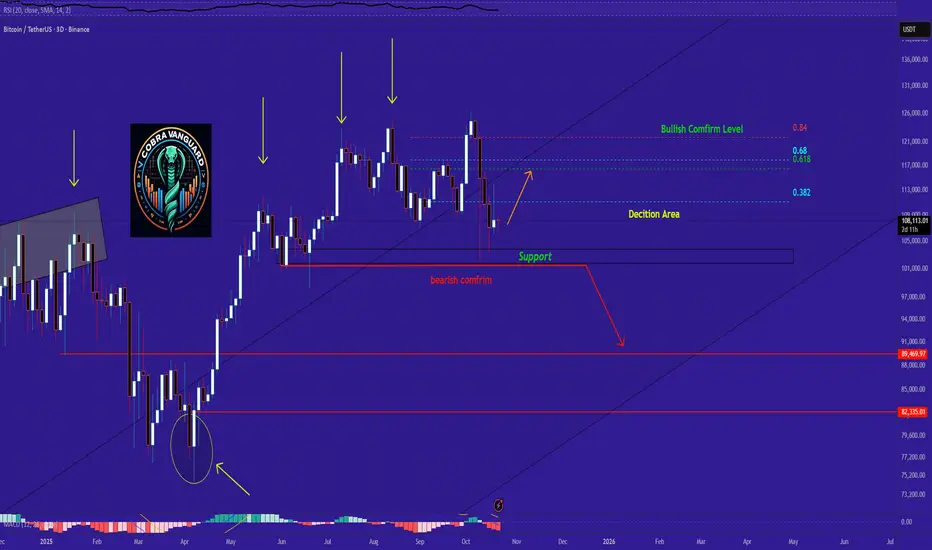
Bitcoin Technical Outlook (Based on Recent Observations)So far, Bitcoin has not yet completed the 3-day red candle close we've been watching. The key decision zones I previously marked—especially the 0.382 Fibonacci level at $112,890—remain unbroken. This level is critical for confirming bullish continuation.
For Bitcoin to maintain its upward momentum, we need a candle close above both the decision zone and the channel's midline, as illustrated by the orange arrow I previously shared.
In my view, if the $103K–$100K support zone breaks downward, we could shift into a bearish stance. This type of behavior from Bitcoin has been typical over the past 640 days.
$TEAM - Time to bottom feed | AtlassianNASDAQ:TEAM
I know how much you all love JIRA. I know how much you all love the different flavors of "agile". I know how much you all love updating confluence pages that nobody will read.
Who cares about all that... We tryna bottom feed here. JIRA at key support. Cud go to zero. Who knows. LET"S EAT
I'm in at $153. Will update with an add level if the bottom drops out.
THANK YOU FOR YOUR ATTENTION TO THIS MATTER

$AVNT (4-HOUR): SPOT ($0.65) in-play, BULLISH in BEARISH climateNYSE:AVNT pretty strong since my SPOT buy yesterday at 65c, 5% up despite a wider cryptomarket weakness.
Now, a lot of heavy-lifting for this coin to do from here, I simply want to see a strong breakout well above 70c, only then would I move my SL to entry price to make this trade risk-free.
MARKET STRUCTURE is bullish on the 4-HOUR chart, but the recent HH was slighly minor, so the next one has to be a strong one, RSI at 60 looking ready for a bigger move, and no signs of any fishy distribution, no controversy here.
Liquidation-wise, another dip to 60c would be okay as long as no high-volume closes below.
Bullish #Avant in a bearish environment.
👽💙

Is Delta Air Lines Taking Off?Delta Air Lines has pressed into a tight range, but some traders may think it’s ready to start climbing.
The first pattern on today’s chart is the series of higher lows since the spring. DAL has stayed above that rising trendline and yesterday inched to its highest closing price since February 20. That combination may be viewed as evidence of an approaching breakout.
Second, the 50-day simple moving average (SMA) had a “golden cross” above the 200-day SMA in late August. That could suggest its long-term trend has gotten more bullish.
Third, the 8-day exponential moving average (EMA) is above the 21-day EMA. MACD is also rising. Those signals may reflect a bullish short-term trend.
TradeStation has, for decades, advanced the trading industry, providing access to stocks, options and futures. If you're born to trade, we could be for you. See our Overview for more.
Past performance, whether actual or indicated by historical tests of strategies, is no guarantee of future performance or success. There is a possibility that you may sustain a loss equal to or greater than your entire investment regardless of which asset class you trade (equities, options or futures); therefore, you should not invest or risk money that you cannot afford to lose. Online trading is not suitable for all investors. View the document titled Characteristics and Risks of Standardized Options at www.TradeStation.com . Before trading any asset class, customers must read the relevant risk disclosure statements on www.TradeStation.com . System access and trade placement and execution may be delayed or fail due to market volatility and volume, quote delays, system and software errors, Internet traffic, outages and other factors.
Securities and futures trading is offered to self-directed customers by TradeStation Securities, Inc., a broker-dealer registered with the Securities and Exchange Commission and a futures commission merchant licensed with the Commodity Futures Trading Commission). TradeStation Securities is a member of the Financial Industry Regulatory Authority, the National Futures Association, and a number of exchanges.
TradeStation Securities, Inc. and TradeStation Technologies, Inc. are each wholly owned subsidiaries of TradeStation Group, Inc., both operating, and providing products and services, under the TradeStation brand and trademark. When applying for, or purchasing, accounts, subscriptions, products and services, it is important that you know which company you will be dealing with. Visit www.TradeStation.com for further important information explaining what this means.

XLM analysis (1hour)The price may reach the mirror Support and experience a strong upward move afterward. However, if this zone fails, we should expect the price to drop toward the PRZ (Potential Reversal Zone).

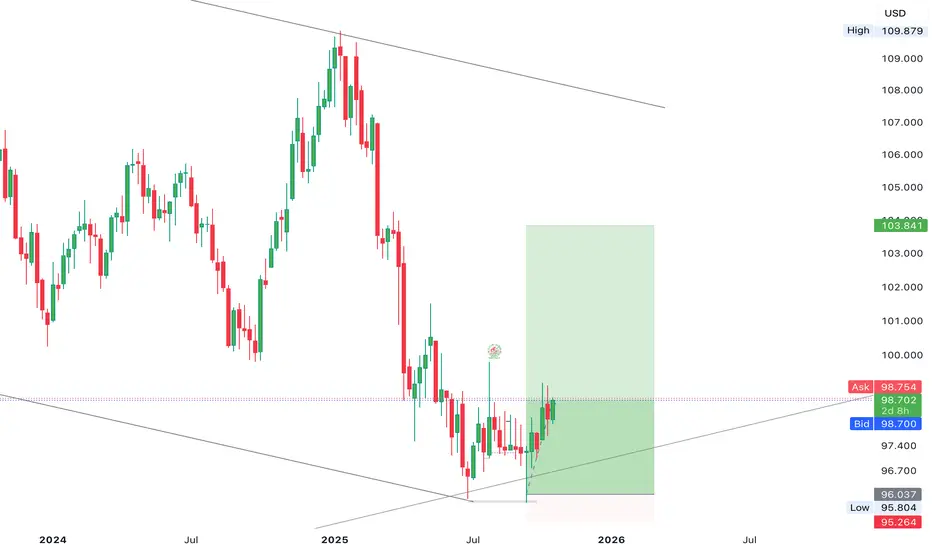
The DXY continues to establish a solid base for bullish recoveryThe DXY continues to establish a solid base for bullish recovery around the 98.000 level, aiming to mitigate toward the 103.000 region. This development highlights a potential shift in market momentum as dollar strength begins to rebuild. follow for more insights ,comment and boost idea
TradeCityPro | ZEC: Bullish Structure Holding Strong👋 Welcome to TradeCity Pro!
In this analysis, I want to review the ZEC coin for you — one of the Privacy and Layer 1 projects, ranked 28th on CoinMarketCap with a market cap of $4.42 billion.
⏳ 4-Hour Timeframe
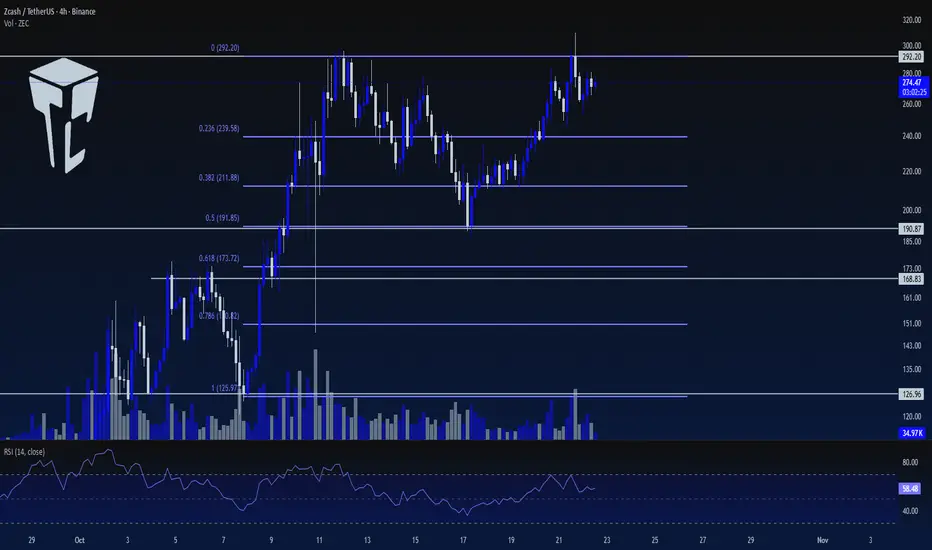
This coin has a bullish trend on the 4-hour timeframe and, after its upward movement, has now entered a corrective phase.
🔍 This correction has reached the 0.5 Fibonacci level of the previous wave, and the price has now returned to the 292.20 zone, having already reacted to it once.
✔️ Breaking the 292.2 level could mark the beginning of the next bullish wave. From a momentum standpoint, the bullish trend is very strong, and with the breakout of 292.2, the momentum will likely continue.
⚡️ Currently, the volume favors buyers, and as the price approaches the 292.2 zone, buying volume is increasing, which raises the probability of breaking this resistance.
💥 The break of level 70 and the RSI entering Overbuy are strong momentum triggers for a long position.
📊 For a short position on this coin, I’ll wait until a bearish structure forms. The current structure is very bullish, so I’d rather open short positions on other coins.
⭐ We’ll get the confirmation of a bearish reversal only after the price stabilizes below 190.87.
📝 Final Thoughts
Stay calm, trade wisely, and let's capture the market's best opportunities!
This analysis reflects our opinions and is not financial advice.
Share your thoughts in the comments, and don’t forget to share this analysis with your friends! ❤️
$BTC (WEEKLY): DARK CLOUD COVER bearish candlestick patternCRYPTOCAP:BTC has got a text-book DARK CLOUD COVER candlestick pattern nearly completely formed on the WEEKLY.
It's a form of a bearish engulfing pattern, just without one single red candle but rather a series of a few. This way, we get to see a few red volume candles in order to assess the validity of a pattern.
In addition to the CLOUD COVER pattern, it occurred precisely at the double top and at the CUP & HANDLE long-term target ($125k). All this adds to a bearish bias, and again, closing above $109k is a MUST this week, once again, for a bullish narratives to make any sense.
Some ETF inflows into both #btc and CRYPTOCAP:ETH yesterday, so that's a bit of hopium, right there.
For now, my targets based on the ELLIOT'S WAVE count: $100.3k or 94.3k. BITCOIN must not lose the $94k or it's #cryptowinter time.
💙👽

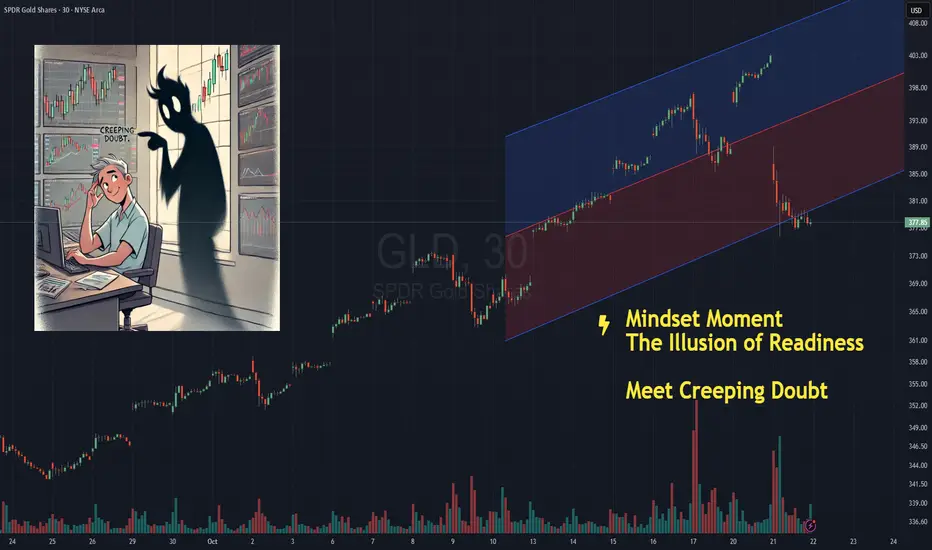
The Illusion of Readiness - Creeping DoubtNOTE – This is a post on mindset and emotion. It is not a trade idea or strategy designed to make you money. My intention is to help you preserve your capital, energy, and focus - so you can trade your own system with calm and confidence.
You know that feeling before you click buy or sell .
You pause…
You check your levels again.
Re-measure your stop.
Recalculate your size.
Zoom in, zoom out.
Add one more confirmation just to be sure.
You tell yourself it’s discipline.
That you’re waiting for the “perfect” setup.
But there's no denying it…
You can feel it
Creeping doubt entering your trading room
Listen. The truth is you already know your plan.
You’ve tested it.
You’ve seen it work.
You are ready.
But your mind doesn’t trust that yet.
So it creates the illusion of readiness
a loop of micro-adjustments and checks that feel productive…
when really, they keep you safely on the sidelines.
It’s control in its most subtle form.
A way of saying,
“I’ll act when I feel completely certain.”
Except in trading that feeling never comes.
Every tweak strengthens the belief that you’re not ready.
Every delay tells your system,
“Not yet… not safe.”
The work isn’t in waiting for confidence.
It’s in acting through the uncertainty
and building trust in motion.
Next time you find yourself double-checking for the fifth time, pause and ask:
“Who is in the driving seat here?”
Take a deep steadying breath and then follow your plan.
EURUSD The Target Is UP! BUY!
My dear subscribers,
My technical analysis for EURUSD is below:
The price is coiling around a solid key level - 1.1581
Bias - Bullish
Technical Indicators: Pivot Points Low anticipates a potential price reversal.
Super trend shows a clear buy, giving a perfect indicators' convergence.
Goal - 1.1630
About Used Indicators:
By the very nature of the supertrend indicator, it offers firm support and resistance levels for traders to enter and exit trades. Additionally, it also provides signals for setting stop losses
Disclosure: I am part of Trade Nation's Influencer program and receive a monthly fee for using their TradingView charts in my analysis.
———————————
WISH YOU ALL LUCK

USDCAD My Opinion! SELL!
My dear friends,
My technical analysis for USDCAD is below:
The market is trading on 1.4027 pivot level.
Bias - Bearish
Technical Indicators: Both Super Trend & Pivot HL indicate a highly probable Bearish continuation.
Target - 1.4012
Recommended Stop Loss - 1.4037
About Used Indicators:
A pivot point is a technical analysis indicator, or calculations, used to determine the overall trend of the market over different time frames.
Disclosure: I am part of Trade Nation's Influencer program and receive a monthly fee for using their TradingView charts in my analysis.
———————————
WISH YOU ALL LUCK

Gold 1979 vs 2025 — When History Whispers and Markets Listen
🌕 1. The Echo of 1979
In 1979, the world watched Gold do the impossible. The metal surged from $226 to over $850 per ounce in less than a year, a 275% explosion that turned fear into fortune.
The triggers were seismic.
🇮🇷 The Iranian Revolution disrupted global oil flows.
🏛️ The U.S. Embassy hostage crisis fueled geopolitical panic.
⚔️ The Soviet invasion of Afghanistan reignited Cold War fears.
💸 And double-digit inflation in the U.S. shredded faith in the dollar.
By early 1980, panic replaced logic. Every newspaper screamed, “Buy Gold before it’s too late!” Then came Paul Volcker’s shock therapy as interest rates jumped above 15% and COMEX doubled margin requirements. Within eight weeks, Gold fell more than 40%, marking the end of one of the most dramatic speculative manias in modern history.
🔁 2. Fast-Forward to 2025: The Parallels Are Uncanny
The world of 2025 looks hauntingly similar.
🕰️ 1979 🔮 2025
Iranian Revolution and Cold War tensions Gaza war, U.S.–China decoupling, and regional instability
Oil shock and inflation Energy disruptions and persistent post-pandemic inflation
Dollar under pressure Record U.S. debt and fiscal erosion
Panic buying of Gold Central bank accumulation and retail FOMO
Fed under Volcker turns hawkish Fed under Powell trapped between cuts and control
By late August 2025, gold sat quietly near $3,415, then erupted into a seven-week vertical rally above $4,300, a mirror image of 1979’s euphoric climb. But just like back then, euphoria was the prelude to exhaustion.
⚠️ 3. The Anatomy of the Current Crash
On October 17, 2025, Gold plunged $250 in one day, a shocking 5–6% drop that broke its parabolic structure and sent fear rippling across markets.
What triggered it?
🏦 A hawkish shift in the Federal Reserve’s language as officials hinted rate cuts might be delayed.
💰 Real yields surged, breaking the inverse correlation that had fueled gold’s climb.
🏛️ Institutional profit-taking hit record levels, confirmed by rising COMEX open interest and volume.
🗞️ Sentiment flipped overnight as headlines shifted from “Gold to $5000” to “Gold crashes $250.”
The move marked the first true break of structure (CHoCH) since the rally began, historically the signal that smart money is quietly exiting.
🔍 4. Lessons from 1980 — The Signs of a Top
Before gold crashed in 1980, five clear warning signs appeared.
⚙️ 1979–1980 Signal 💡 2025 Equivalent 🧭 Status
Fed turns hawkish Powell signals “pause / higher for longer” ⚠️ Emerging
Rising bond yields vs. flat Gold Real yield divergence ✅ Confirmed
Parabolic candles Daily range above $100 ✅ Seen
Media frenzy “Gold to $5000” hype ✅ Seen
Margin hikes and record OI Record COMEX participation ⚠️ Rising
Four out of five signals are already flashing. History teaches that when everyone believes Gold can only rise, it’s often about to fall.
🧭 5. What Smart Traders Should Do Now
🟡 Phase 1 – Immediate Protection (Next 24 Hours)
If you’re long, secure 50–75% of gains and protect above $3,950.
If you’re short, trail stops to $4,200 and look for targets at $3,950 → $3,800 → $3,600.
If you’re flat, stay patient and wait for at least two daily candles of stabilization before acting.
🟠 Phase 2 – Stabilization (Next 3–5 Days)
Watch for:
🕯️ Long lower wicks on daily candles show buyer absorption.
📉 Shrinking COMEX volume indicates exhaustion of sellers.
📊 Flat or falling real yields confirming support.
🔵 Phase 3 – Re-evaluation (Next 1–2 Weeks)
If gold reclaims $4,000+ with strength and Fed tone softens, a controlled re-rally may begin. If Gold stays below $3,800, the correction likely extends toward $3,500, the same 30–40% retracement seen in 1980.
🧘♀️ 6. Beyond the Chart — Discipline Over Drama
When a $250 candle appears, instincts scream, “Do something!” But professionals know the truth: reaction destroys capital, observation preserves it. The coming days are not about prediction but about posture. Stay liquid, track sentiment, watch real yields, and remember that even in 1980, Gold’s crash didn’t end its story — it simply reset the cycle for the next era of accumulation.
✨ History doesn’t repeat, but it rhymes. In 1979, Gold taught us that fear creates bubbles. In 2025, it’s reminding us that even truth needs a pullback before it shines again.
If this article helped you today and brought you more clarity:
Drop a 🚀 and follow us✅ for more trading ideas and trading psychology. Thank you.

Saudi Arabian Oil CompanyTrade Plan: Saudi Arabian Oil Company
Recently had a very deep fall, now showing momentum recovery.
Entry: Wait for a bullish move confirming rejection of recent lows.
Target: Nearest resistance visible on chart.
Potential: Much higher upside if momentum continues.
Stop: Below recent swing low.

Until You Fix This, You’ll Never Be a Successful TraderHey what’s up guys,
today’s post is not going to be technical, and neither some AI-generated piece. But more important than some technical ones. This one is about trading enemies that were holding me back for some time, hope you can learn from my mistakes.
Looking for the secrets which will solve my trading and protect me from losses. Jumping from strategy to strategy and still thinking I need to learn more to avoid losses and find confidence. But than I realized its not in the strategy, but about being realistic and backed by statistical data.
🧠 Without a doubt, trading is 80% psychology and 20% trading.
I’ll show you 3 main problems and give you solution for the inspiration to move to the next level faster.
1️⃣ False Expectations – Getting Rich Quick
First of all avoid 20 years old instagram billionaires with cars, watches and yachts. Its mostly rented and if they cant show 3rd party verified 5 years live track record run aways. Yes, you can get rich from trading, but it’s not gonna be in a month. And most likely not even in a year. Be realistic. A doctor or a lawyer must study at least 4 years, and then practice for a few more years before they earn any money from their professions. They have clean scripts about what to learn, in what order, and how to apply it.
In trading, you don’t know what to learn. You don't know yourself yet. You’ll probably waste time finding out what works and what doesn’t. You’ll also waste time trying shortcuts like signals, expert advisors, and mainly jumping from strategy to strategy thinking it's a solution.
💊 Solution:
Stop believing someone has a magic secret formula to be 100% right on the markets. Strategy that makes you rich in a week and solve all your financial problems? No one has it.
Learning to trade takes time — realistically 1–2 years minimum.
It depends on your commitment and how much focused work you put in.
Don’t expect to watch 20 hours of YouTube videos and become profitable. Doctor also cant do surgery after just reading scripts. Experienced practice and consistent work is needed. Can some mentor help you ? Yes, but you need to check them before buying any course.
Lastly trading is not a solution to a miserable financial situation, if you are broke. Learn trading but don't trade live yet or it will destroy you.
-----------------------------------------------------------------
2️⃣ Trading Random Patterns – Price Action Overfitting
If you’re trading random patterns and every trade has different logic, then you don’t have an edge. Random trading logic = random results.
‼️Knowing all these 👇 and fitting them to the chart is not trading edge. Im not saying, these patterns cant work, but you must focus to the one and become a master. Not randomly choosing what fits to the chart today and taking trade on different logic tomorrow.
‼️ If your strategy is trading random patterns you know,
You can’t measure strategy performance. ⏩ What you can’t measure — you can’t improve or backtest. ⏩ And that means you’re don't have statistical data - its core of all problems.
💊 Solution:
Whatever pattern you like - Head and Shoulders, Triangle, Wedge, Channels, Cup and handle. Whatever but pic one, defined step by step process how you will be trading it. And always use mechanical aprocah how you will be trading it. Narrow criteria for every element of a trade to eliminate subjective decisions.
🛡️ You should have :
• Defined your pattern
• Method to define key levels
• Fixed method how to define a trend
• Fixed method how to trade continuation with your pattern
• Fixed method how to trade reversal by using your pattern
Define one trading pattern ( 1 kick ) Practice it 10 000 times become master 👇 For your inspiration, you can check this strategy, its eliminating subjective decisions.
🔗 Click the picture below to learn more. 👇 Approach information I gave above as Bruce Lee : Adapt useful, Reject useless and something specifically your own.
-----------------------------------------------------------------
3️⃣ Psychological Influence
Trading is 20% strategy and 80% psychology.
It’s you vs. you. You need to master your emotions.
It’s modern to say “fix your mindset,” but how?
There’s no way to stop fearing losses, being greedy, or overtrading by just magically “fixing your mindset.”
🧪 Fear – Not executing your setup when it appears because the last two trades were losses. Closing trades early because you fear it will come back to entry or hit SL — which leads to doubting your strategy and jumping to another one.
🧪 Greed – Setting unrealistic targets and not taking profits at the right time.
Trading sizes so big that you check your phone every 3 minutes. Gambling. Trying to pass prop firm challenges in a few trades instead of consistent work.
🧪 Revenge Trading – Trying to make your money back quickly in bad trading conditions. Trying to prove to the market that you’re right. Fighting with your ego.
🧪 Overtrading – Forcing trades just for the sake of doing something. Feeling like you need to trade every day — a mindset from normal jobs where we’re paid for effort.
💊 Solution:
Mechanical Strategy + Statistical Data = EDGE
Sounds like it has nothing to do with psychology, right? You will see step-by-step, following the same process and trading plan, can be backtested on hundreds of examples.
If you run at least 300 trade backtests on any trade pattern, this is what happen to you:
• No pattern guessing or fitting to price action
• No overthinking — you just follow the same setup you know works
• Fixed SL and TP, fixed RR — no guesswork
• You know your win rate %
• You know your risk-reward %
• Repetitiveness builds confidence and clarity
• Confidence and clarity lead to improvements
• Improvements lead to mastery over time
‼️ Again a statistical edge is only possible through a mechanical trading approach and proper backtesting. If you’ve done your backtests and have statistical data on a large sample, let’s say:
Win Rate: 65%
That means out of 100 trades, you’ll win 75 — but there can still be 25 losses.
You never know the distribution of wins and losses, you only know that you’ll win over a series of trades.
Average RR: 2.3
That means for every $100 you risk, you’ll win $230 if you’re right, and lose $100 if you’re wrong.
The reality is always different than backtest, in reality you will perform worse. Here is what you should at least achieve Having these stats is key — it’s the solution to psychological influence How?
🧠 Final Solutions - Just think about it
🧪 Fear
Why would you fear opening the next trade after a loss or closing early, if you know that on average you win 65 out of 100 trades? Distribution is random, but with a positive win rate, you win over time. Why would you close early if you know that your TP was hit in 75 out of 100 ?
🧪 Greed
Why would you set unrealistic targets when your statistics already show what RR is most profitable for you? And why would you gamble big lot sizes if you know you can lose 35 trades out of 100? It doesn't make sense to gambler right?
🧪 Revenge Trading
Why do it, if you know losses are part of the process and that if you just stick to the plan, you’ll win long-term? Why your statistics says so. You know how your A+ Setup looks like, when stopped out why re-entering again if setup is not valid.
🧪 Overtrading
Why trade every day if your A+ setup doesn’t occur every day?
If your data says the best setups occur 3 times per week, why force it?
Why risk extra trades if you already made profit or if you didn’t perform well this week, why gamble it all on Friday?
See ? Having a fixed mechanical solution backed by backtested statistical data is solution to everything?
David Perk aka Dave Fx Hunter

XPLUSDT Technical Analysis – Bearish Pressure with Key LevelsCurrent Market Status:
Price: $0.3799 (-4.57%)
Exchange: Binance Spot
Volume: 115.72M USDT
Timeframe: 4H Chart
Technical Overview:
XPLUSDT is facing significant selling pressure, down 4.57% and currently trading at $0.3799. The price action shows clear rejection from higher levels with bears maintaining control. Despite the monthly gain of +277.80%, recent weakness suggests consolidation or further downside before any meaningful recovery.
Key Levels:
Resistance Zone: $0.4332 - $0.4507
This red zone represents a major overhead resistance area. Any rally attempts will likely face strong selling pressure in this region. Bulls need to reclaim and hold above $0.4507 to invalidate the bearish structure.
Support Zone: $0.3779 - $0.3805
The green zone marks critical support. Price is currently testing this area at $0.3799. A break and close below $0.3779 could trigger accelerated downside with next support levels potentially much lower.
Trading Strategy:
For Sellers: Look for rejection at the support zone or a breakdown below $0.3779 for continuation shorts
For Buyers: Wait for price to reclaim and hold above $0.4332 with volume confirmation before considering long positions
Risk Management: No man's land between $0.3805 - $0.4332. Avoid trading in this choppy zone.
Conclusion :
XPLUSDT remains under pressure with critical support being tested. The risk/reward favors patience—either wait for a clean breakdown for shorts or a breakout above resistance for longs. Avoid catching falling knives in the current structure.

GBPJPY Buy Setup | Multi-TF Confluence + Demand Zone Reaction📈 On GBPJPY, the market recently showed a clear Higher-Timeframe CHOCH from the 1H Order Block, signaling a potential shift in structure.
Now, within the 15M–5M timeframe, the price is forming internal BOS (IBOS) and a strong demand area near the Order Block + Support zone.
💡 Setup Plan:
1️⃣ Wait for the market to tap into the 15M / 5M OB zone below the support structure.
2️⃣ Once tapped, look for LTF confirmation — a bullish MSS or CHOCH around the entry zone.
3️⃣ On confirmation, plan for scalp-to-intraday buys, targeting the previous swing highs and liquidity pools above.
4️⃣ If there’s no bullish confirmation, no trade ❌ — discipline over prediction.
🎯 Target:
The next swing high or the liquidity zone near 203.400+.
⚙️ Setup Summary:
Bias → Bullish
Confluence → HTF CHOCH + 15M OB + Demand Zone
Entry → After LTF MSS / CHOCH confirmation
Target → Next swing high / liquidity zone
Type → Scalp to Intraday Buy Setup
⚠️ Disclaimer:
This is my personal analysis, not financial advice.
Always trade with proper confirmation and risk management.
