AUD/CHF BEARS ARE STRONG HERE|SHORT
Hello, Friends!
AUD/CHF is making a bullish rebound on the 12H TF and is nearing the resistance line above while we are generally bearish biased on the pair due to our previous 1W candle analysis, thus making a trend-following short a good option for us with the target being the 0.517 level.
Disclosure: I am part of Trade Nation's Influencer program and receive a monthly fee for using their TradingView charts in my analysis.
✅LIKE AND COMMENT MY IDEAS✅
Contains image

Gold Under Pressure as USD Recovers📊 Market Overview:
Gold (XAU/USD) trades near $4006/oz, extending its pullback as the U.S. dollar strengthens and Treasury yields rebound.
Traders are cautious ahead of upcoming U.S. PMI and PCE data, which could shape expectations for the Fed’s next rate move.
📉 Technical Analysis:
• Key resistance: $4030 – $4050
• Nearest support: $3990 – $3975
• EMA09 (H1): Price remains below EMA09, confirming short-term bearish bias
• Candle/volume/momentum: Consecutive bearish candles with long upper wicks indicate strong selling pressure; RSI near 40 shows more downside potential.
📌 Outlook:
Gold may extend its short-term decline if USD strength persists and yields stay elevated.
However, $3990 – $3975 remains a potential rebound zone if a bullish rejection candle appears.
💡 Trade Setup:
🔻 SELL XAU/USD at: $4047 – $4050
🎯 TP: 40 / 80 / 200 pips
❌ SL: $4053
🔺 BUY XAU/USD at: $3975 – $3977
🎯 TP: 40 / 80 / 200 pips
❌ SL: $3972

Lingrid | TONUSDT Key Confluence Support Long OpportunityThe price perfectly fulfilled my previous idea . OKX:TONUSDT is retesting the key confluence area near 2.13 after multiple higher lows formed along the ascending support trendline. Price action shows compression within a narrowing structure, hinting at potential breakout momentum building up. A confirmed bounce from this support may lift price toward 2.28, aligning with short-term resistance and the upper boundary of the range. Overall bias stays bullish as long as the 2.10–2.13 support cluster holds firm.
⚠️ Risks:
Failure to hold the 2.10 support zone could invalidate the bullish scenario.
Increased volatility ahead of macro data releases could cause short-term whipsaws.
Weak momentum or low trading volume may limit the breakout’s sustainability.
If this idea resonates with you or you have your own opinion, traders, hit the comments. I’m excited to read your thoughts!

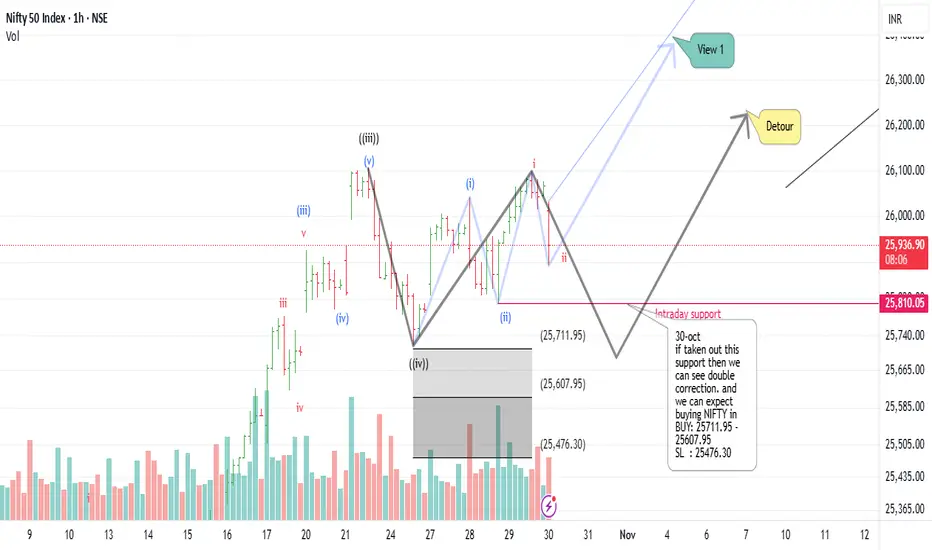
Nifty Intraday DetourIncase Nifty doesn't hold 25810 then will have to tweak the wave count and expect Nifty to correct upto 25712-25476. If that happens then we will plan to buy in Range of 25712-25608 and keep stop loss for 25476
How should we respond to the FOMC?📊How should we respond to the FOMC?
🧠Yesterday, we failed to break through the gray resistance zone (S/R), instead forming a double-top bearish structure in this area. Therefore, our long position opened at the 4-hour neckline support has already hit our cost price and been closed. After a pullback, it tested the 1-hour neckline support and the black descending trendline, and a rebound occurred, but we didn't see a strong upward move, so we closed our long position here as well.
➡️The expectation of a rate cut has already been priced in during the upward movement, so we should be wary of (sell the news)!
➡️If we cannot hold the current support, then we need to be wary of a deeper pullback. The next support level to watch is around 109000, and the extreme support level to watch is the bulls' defense point (106621).
Let's see 👀
🤜If you like my analysis, please like 💖 and share 💬 BITGET:BTCUSDT.P

$STBL (4-HOUR): SPOT buy number 3 (out of 3)I don't really care about any #BUYBACKS on AQUISUK:STBL or TOKEN BURNS, this is just a very promising and potentially disruptive project, and I'm astonished that its MARKETCAP is only the size of some crappy hyped-up #PUMPFUN BS.
I had a plan to make my third and last SPOT PURCHASE between 7.5 and 8 CENTS, the area where most LIQUIDATIONS were sitting, but it looks like it won't drop lower than what we just had, 8.2C.
So, I'm taking the MARKET PRICE of 8.6C at SUPPORT with the RSI about to flash a BULL DIVERGENCE — LOWER LOW in PRICE with a HIGHER LOW in RSI. These 3 main signals of a potential REVERSAL plus FUNDAMENTAL CONVICTION — let's see if this combo will pay some bills this winter. XD
👽💙

TAOGETTEX:TAO is positioned for a potential 115% gain within the next 93 days. The AI sector is showing renewed momentum, and GETTEX:TAO ’s strong fundamentals, liquidity profile, and positioning within the narrative suggest it could lead the next leg of sector expansion.

$SOL (DAILY): LON $187 (STOP LOSS: below $170)Longing CRYPTOCAP:SOL here at $187.
Reasoning within 30 minutes in the next post.
Modest stake, SL: two 4-hour candles below $170.
💙👽

TONLSE:TON is forming a clean descending wedge pattern, showing strong potential for an upside breakout. The measured target sits at $5.8, offering around 160% upside from current levels. Momentum is building, and this setup looks ready to play out soon.

TRUMP$TRUMP has clearly established a bottom and is demonstrating strong momentum. Short term technicals support a move toward the $10 level, driven by renewed volume and improving sentiment across speculative assets. Momentum confirmation will be key.

XAU/USD Intraday Plan | Support & Resistance to WatchYesterday’s analysis is playing out as expected — after breaking above the 3987 resistance, gold tested the 4042 level, but failed to sustain momentum and pulled back for a retest of 3987, now acting as short-term support.
We need to see a clear break of either level to confirm direction, otherwise price may continue to range within this zone before the next move.
A break above 4,042 could open the way for a push toward 4095 and 4137, while a break below 3987 would likely trigger a move back toward the Deeper Support Zone (3,944–3,884).
📌 Key levels to watch:
Resistance:
4042
4095
4137
4178
Support:
3987
3944
3884
3820

EURUSD FRGNT Daily Forecast -Q4 | W44 | D31| Y25 |📅 Q4 | W44 | D31| Y25 |
📊 EURUSD FRGNT Daily Forecast
🔍 Analysis Approach:
I’m applying Smart Money Concepts, focusing on:
Identifying Points of Interest on the Higher Time Frames (HTFs) 🕰️
Using those POIs to define a clear trading range 📐
Refining those zones on Lower Time Frames (LTFs) 🔎
Waiting for a Break of Structure (BoS) for confirmation ✅
This method allows me to stay precise, disciplined, and aligned with the market narrative, rather than chasing price.
💡 My Motto:
"Capital management, discipline, and consistency in your trading edge."
A positive risk-to-reward ratio, paired with a high win rate, is the backbone of any solid trading plan 📈🔐
⚠️ Losses?
They’re part of the mathematical game of trading 🎲
They don’t define you — they’re necessary, they happen, and we move forward 📊➡️
🙏 I appreciate you taking the time to review my Daily Forecast.
Stay sharp, stay consistent, and protect your capital
— FRNGT 🚀
OANDA:EURUSD

$ASTER (8-HOUR): FALLING WEDGE (target $2.19) or 65 cents NEXT?SEED_WANDERIN_JIMZIP900:ASTER is starting to look interesting for a potential reversal or a relief rally at least.
A FALLING WEDGE that started at the top of WAVE 2 (negative ELLIOT Wave count) and could be finishing at the bottom of a WAVE 5. Is this the bottom though?
My WAVE 5 has got a few targets deeper down, 65c or even 30c. A potential entry has to be precise for this reason remembering that #aster has just printed a LOWER LOW again.
Mega oversold RSI (9.5 on the 8-hour chart), solid OBV profile after a recent BULLISH divergence.
On-chain data: OPEN INTEREST has fallen from $5B+ to $3.01B, perp volumes stable and even picked up yesterday, but that's mainly new LIQUIDATIONS, sadly. Similar story with fees.
I said it a few weeks ago, that generally speaking, DEXes are going to struggle hard trying to grow their numbers after such liquidation events.
Not sure whether the correction is finished, no clear signs yet, but I definitely will try to buy some lower, LIMIT ORDERS spread between 64c and 67c (hoping for a fib 0.618 end to WAVE 5).
Another good strategy would be to LONG the FALLING WEDGE breakout above $1.02-$1.04.
Bloodshed continues.
💙👽

EURJPY On The Rise! BUY!
My dear friends,
Please, find my technical outlook for EURJPY below:
The price is coiling around a solid key level - 177.61
Bias - Bullish
Technical Indicators: Pivot Points Low anticipates a potential price reversal.
Super trend shows a clear buy, giving a perfect indicators' convergence.
Goal - 178.11
Safe Stop Loss - 177.34
About Used Indicators:
The pivot point itself is simply the average of the high, low and closing prices from the previous trading day.
Disclosure: I am part of Trade Nation's Influencer program and receive a monthly fee for using their TradingView charts in my analysis.
———————————
WISH YOU ALL LUCK

EURUSD: Strong Bearish Sentiment! Short!
My dear friends,
Today we will analyse EURUSD together☺️
The market is at an inflection zone and price has now reached an area around 1.15208 where previous reversals or breakouts have occurred.And a price reaction that we are seeing on multiple timeframes here could signal the next move down so we can enter on confirmation, and target the next key level of 1.15121.Stop-loss is recommended beyond the inflection zone.
❤️Sending you lots of Love and Hugs❤️

GBP-CAD Free Signal! Sell!
Hello,Traders!
GBPCAD formed a double-top around a horizontal supply area, showing clear distribution signs. Expecting continuation lower as liquidity under recent equal lows becomes the next draw.
-------------------
Stop Loss: 1.8436
Take Profit: 1.8325
Entry: 1.8392
Time Frame: 5H
-------------------
Sell!
Comment and subscribe to help us grow!
Check out other forecasts below too!
Disclosure: I am part of Trade Nation's Influencer program and receive a monthly fee for using their TradingView charts in my analysis.

EURAUD LOCAL LONG|
✅EURAUD tapped into a well-defined demand level and is showing signs of accumulation. With liquidity taken below previous lows, a short-term bullish reaction toward the next imbalance zone is likely. Time Frame 3H.
LONG🚀
✅Like and subscribe to never miss a new idea!✅

NZDJPY the 90.00 is target but after short-term fall first The broader technical structure for NZDJPY remains fundamentally bullish. However, our analysis suggests the pair may be due for a short-term corrective pullback before the primary uptrend resumes.
We are monitoring two potential scenarios:
Direct Continuation: The market could continue its upward momentum imminently, with an initial projected target offering a 200-pip gain from the current level.
Corrective then Impulsive (Preferred Scenario): A more probable path is a deeper 300-pip corrective decline towards a key support zone. This would create a more robust technical foundation. A strong bullish reversal from that support would then be expected to initiate the next significant impulsive wave, targeting a 500-pip advance toward the primary objective at the 90.00 psychological and technical resistance level.
A strategic approach would be to wait for a confirmed bullish reversal following any potential pullback, entering with a stop-loss placed below the identified support to define the risk clearly.
DISCLAIMER: ((trade based on your own decision))
<<press like👍 if you enjoy💚

$SOL (4-HOUR): LONG $187, reasoning. CRYPTOCAP:SOL has had $154M in #ETF inflows this week, not bad for the first few days on the market. But this is not a reason for a LONG ($187) I have just opened.
The original plan was to LONG the $205 breakout for a while, but a HIDDEN BEARISH RSI divergence flashed and the $205 resistance got retested, printing a LOWER HIGH again, and the price dipped to retest the 200 MA + the ascending trendline (confluence of SUPPORT).
It was the 4th retest this month and it has been solid, each time giving us a HIGHER LOW as well.
I highlighted in light-blue also a horizontal SUPPORT ZONE and #solana has been sitting inside of it, so there is plenty of support of all kinds, including a GOLDEN POCKET ($172 - $176).
A sequence of 2 HIDDEN BULLISH OBV divergences triggered this LONG at the end.
And below the pocket is where I would EXIT this trade — 2 or 3 candle closes (4-hour ones, not the daily ones) and I'm out.
I also highlighted an interesting fractal of price action: notice the Q4 2024 resemblance to the current behaviour — DOWNTREND toward the same horizontal support ZONE supported by the 200 MA, followed by a huge SURGE.
This is quite a risky trade due to the general market circumstances, and I will monitor the reaction very closely around $200 again, and possibly add to size on a BREAKOUT as originally intended.
💙👽
#long

BTC Ready for PUMP or what ?The BTC will increase 20k and reach to the top of the wedge in the coming DAYS.
Give me some energy !!
✨We spend hours finding potential opportunities and writing useful ideas, we would be happy if you support us.
Best regards CobraVanguard.💚
_ _ _ _ __ _ _ _ _ _ _ _ _ _ _ _ _ _ _ _ _ _ _ _ _ _ _ _ _ _ _ _
✅Thank you, and for more ideas, hit ❤️Like❤️ and 🌟Follow🌟!
⚠️Things can change...
The markets are always changing and even with all these signals, the market changes tend to be strong and fast!!
LINK It has good growth potential in midtermWhat I see now is that the price could correct to the PRZ and then pump again, and currently, there is no specific bullish pattern in the chart. which could cause the price to drop below 13.5 dollars.
Best regards CobraVanguard.💚

Western Digital Corporation (WDC) Up 8% in Premarket TradingThe price of Western Digital Corporation (WDC) broke out of a symmetrical triangle amidst market condition surging nearly 10% on early premarket trading on Friday.
With the RSI at 66 NASDAQ:WDC seems to capitalize om the bullish symmetrical triangle formed on the daily price chart.
On another news, Western Digital (WDC), opens new tab forecast second-quarter earnings above Wall Street estimates on Thursday, betting on higher demand for its data storage products as cloud providers increase data center capacity.
The company also increased the quarterly cash dividend on its common stock by 25% to $0.125 per share, sending its shares up nearly 10% in extended trading.
About WDC
Western Digital Corporation develops, manufactures, and sells data storage devices and solutions based on hard disk drive (HDD) technology in the United States, Asia, Europe, the Middle East, and Africa. The company offers internal HDDs, data center drives, data center platforms, external drives, portable drives, NAS for home and office, and accessories. It sells its data storage devices and solutions through its computer manufacturers, sales personnel, dealers, distributors, and retailers.

GBP/USD BULLISH BIAS RIGHT NOW| LONG
GBP/USD SIGNAL
Trade Direction: long
Entry Level: 1.313
Target Level: 1.332
Stop Loss: 1.301
RISK PROFILE
Risk level: medium
Suggested risk: 1%
Timeframe: 1D
Disclosure: I am part of Trade Nation's Influencer program and receive a monthly fee for using their TradingView charts in my analysis.
✅LIKE AND COMMENT MY IDEAS✅
