AUDNZD My Opinion! BUY!
My dear followers,
This is my opinion on the AUDNZD next move:
The asset is approaching an important pivot point 1.1391
Bias - Bullish
Safe Stop Loss - 1.1385
Technical Indicators: Supper Trend generates a clear long signal while Pivot Point HL is currently determining the overall Bullish trend of the market.
Goal - 1.1402
About Used Indicators:
For more efficient signals, super-trend is used in combination with other indicators like Pivot Points.
Disclosure: I am part of Trade Nation's Influencer program and receive a monthly fee for using their TradingView charts in my analysis.
———————————
WISH YOU ALL LUCK
Contains image

BITCOIN BULLS WILL DOMINATE THE MARKET|LONG
BITCOIN SIGNAL
Trade Direction: long
Entry Level: 106,482.62
Target Level: 113,901.05
Stop Loss: 101,549.96
RISK PROFILE
Risk level: medium
Suggested risk: 1%
Timeframe: 1D
Disclosure: I am part of Trade Nation's Influencer program and receive a monthly fee for using their TradingView charts in my analysis.
✅LIKE AND COMMENT MY IDEAS✅

Are you ready for a $BTC next leg?Bitcoin is preparing for a new upward wave towards the resistance zone, reacting to the rising wedge-on-uptrend formation.
This structure often signals a decisive moment after recent momentum.
The reaction to the resistance line will determine the next trend direction.
Staying on top of the trend is crucial during this period.

XAU/USD Intraday Plan|Fed Cut Fails to Lift GoldGold broke above the 3987 resistance yesterday but failed to reach the 4042 resistance level, reversing sharply after the FOMC announcement and dropping back below 3944. The move reflected post-event volatility as markets reacted to the Fed’s cautious tone.
Price is currently trading around 3964, trending just above the MA50 but still below the MA200, suggesting early signs of stabilization while the broader short-term outlook remains uncertain. A confirmed break above 3987 could open the way toward 4042 and 4095, while failure to stay above 3944 may lead to another drop toward 3884–3820, where dip-buyers may look to step in.
📌 Key levels to watch:
Resistance:
3987
4042
4095
4137
Support:
3944
3884
3820
3781
🔎 Fundamental Focus:
The Federal Reserve cut rates by 25bps, bringing the Federal Funds Rate to 4.00%, but Chair Powell’s cautious tone during the press conference dampened market optimism.
Markets reacted with volatility as traders weighed the potential for further easing later this year. Meanwhile, the ongoing U.S. government shutdown and lingering U.S.–China trade tensions continue to cloud sentiment, keeping gold supported on dips as uncertainty remains elevated.

BTC 4H ENGLISHBearish divergence forming. We're about to break the previous high. What's next? A pullback continues to rise, as the daily chart holds a bullish pattern. I'm not shorting that trade. I'm waiting for my next bullish entry to complete the daily chart's move.

Gold Intraday – Oct 30 (No.1)Scalping setup based on early London session volatility.
Expecting rejection near 2380 and possible short fade toward 2370 zone.
⚠️ Quick play — not advice, just sharing my intraday view.

AUD-NZD Bullish Bias! Buy!
Hello,Traders!
AUD-NZD is trading in an uptrend and the pair has swept all liquidity from the demand level below and is showing clear rejection so based on SMC analysis we will be expecting a further bullish move up. Time Frame 4H.
Buy!
Comment and subscribe to help us grow!
Check out other forecasts below too!
Disclosure: I am part of Trade Nation's Influencer program and receive a monthly fee for using their TradingView charts in my analysis.

Final Push into the 24MA weekly This could be the final Push into the 24MA before we slingshot higher. Time will tell first target should be 6500ish

History Repeats (Dot Com Bubble but this time AI Hype)Jan, 2028 will probably see the height of the bubble at around $966 for SPY. Recycle, Reuse, Rinse, Repeat. Looking forward to being right, moreso than generating about a 5x return. See you on the dark side of the moon.

EURUSD: The Market Is Looking Up! Long!
My dear friends,
Today we will analyse EURUSD together☺️
The price is near a wide key level
and the pair is approaching a significant decision level of 1.15880 Therefore, a strong bullish reaction here could determine the next move up.We will watch for a confirmation candle, and then target the next key level of 1.16123.Recommend Stop-loss is beyond the current level.
❤️Sending you lots of Love and Hugs❤️

USDJPY – ABCD Endzone | Smart Money Shift Begins📈 USDJPY – Big Picture
The broader structure shows the ongoing completion of an Elliott Wave 5, aligning with the D-target of a higher-timeframe ABCD pattern.
The market remains technically bullish as long as the C-pivot holds, yet early signs of exhaustion and Smart Money repositioning are emerging.
Around Point D (≈ 153.180- 153.620), several strong factors converge:
harmonic AB = CD target
Fib-extension cluster (1.272 – 1.618)
Orderblock / supply zone
potential momentum divergence
Smart Money distribution from institutional players
From 153.180, we start to build short swing positions,
aiming for a major correction toward 140.860, the lower green structure zone and demand block support.
Short-term: push toward D
Mid-term: rising volatility & reversal risk
Long-term: accumulation opportunity near 140.860

CHFJPY Set To Grow! BUY!
My dear friends,
CHFJPY looks like it will make a good move, and here are the details:
The market is trading on 190.75 pivot level.
Bias - Bullish
Technical Indicators: Supper Trend generates a clear long signal while Pivot Point HL is currently determining the overall Bullish trend of the market.
Goal - 191.50
About Used Indicators:
Pivot points are a great way to identify areas of support and resistance, but they work best when combined with other kinds of technical analysis
Disclosure: I am part of Trade Nation's Influencer program and receive a monthly fee for using their TradingView charts in my analysis.
———————————
WISH YOU ALL LUCK

AMD: Pre-Earnings 8% Surge Fuels 25% Upside in AI Chip MomentumAMD: Pre-Earnings 8% Surge Fuels 25% Upside in AI Chip Momentum – SWOT, Price Action, and Intrinsic Value Insights
📊 Introduction
As of October 30, 2025, Advanced Micro Devices (AMD) is building pre-earnings momentum with a bullish uptick, gaining 8% over the last week to trade around $262 in pre-market after closing at $264.33 yesterday, on heightened volume amid analyst upgrades. This price action coincides with viral anticipation for Q3 earnings expected next week, with #AMDQ3 trending on social media over 500K mentions following TipRanks' AI analyst raising the price target to $295.
Applying timeless investing principles to identify profitable setups, this highlights a potential mispricing in the semiconductor sector, driven by macroeconomic factors like $500B AI infrastructure investments and stable rates at 4.25%, while sector dynamics show AMD's AI GPU share rising to 20%, though challenged by supply chain tensions.
🔍 SWOT Analysis
**Strengths 💪**: AMD's AI-focused innovations, with quarterly revenue growth at 31.7% YoY and earnings surging 229% per Q2 filings, support a solid balance sheet with debt-to-equity at 6.51% and TTM revenue of $29.6B. These metrics have propelled recent price highs near $264, aligning with strategies to exploit growth asymmetries for sustained returns.
**Weaknesses ⚠️**: Reliance on third-party fabs like TSMC exposes to disruptions, contributing to 10-12% price corrections in volatile periods, while high R&D costs (25% of revenue) could pressure margins if growth moderates.
**Opportunities 🌟**: Q3 revenue projections around $8.7B (28% YoY growth) and AI chip demand, backed by partnerships like Microsoft Azure, position for 20-30% price breakouts post-earnings, with valuation metrics like forward P/E at 28.57 offering re-rating potential to compound gains through market expansion.
**Threats 🚩**: Intense competition from NVIDIA and potential earnings misses could trigger 15% pullbacks, as seen in prior downgrades, with regulatory export controls adding volatility—underscoring proven approaches to navigate threats for net-positive outcomes.
💰 Intrinsic Value Calculation
Employing a value investing approach to estimate intrinsic value, we use weighted book value per share plus EPS multiples, incorporating a margin of safety as emphasized in classic methodologies to ensure actionable, money-making insights. Inputs from recent quarterly data: Book value per share $36.78, TTM EPS $1.67, assumed growth rate 45% (based on AI-driven CAGR and consensus projections).
Formula: Intrinsic Value = (Book Value * Weight) + (EPS * Growth Multiplier)
- Weight for book value: 0.3 (tech-adjusted)
- Growth Multiplier: 98.5 (classic: 8.5 + 2*45)
Calculation:
(36.78 * 0.3) + (1.67 * 98.5) = 11.034 + 164.495 = 175.529
Adjusted for sector comparables (e.g., 40x P/E peers): Refined = 175.529 * 1.8 ≈ $315.95
Apply 20% margin of safety: $315.95 * 0.8 ≈ $252.76
At current ~$262 (despite the 8% surge), AMD appears fairly valued but undervalued by 20-25% to $316 fair value on growth realization—no major debt flags at 6.51%, with sustainability tied to EPS growth exceeding 40%. 📈 Undervalued.
🚀 Entry Strategy Insights
Rooted in time-tested disciplines for compounding wealth, target support zones at $250-255 (near 50-day SMA) for unleveraged, long-term positions via dollar-cost averaging, scaling in during 5-10% corrections post-earnings hype. Emphasize non-repainting signals for breakouts above $270, tying to news-driven volatility like Q3 results for viral, profitable timing.
⚠️ Risk Management
Cover position sizing at 1-5% allocation, diversification across tech and defensives, and long-term holding based on fundamental strength, drawing from principles that preserve capital while capturing upside. Include cautions on 15-20% swings from earnings reactions with ⚠️ for risks, to ensure sustainable profitability.
🔚 Conclusion
AMD's pre-earnings surge, AI growth drivers, and undervalued metrics offer a principle-driven opportunity for 25%+ returns through mispricing and safety-focused analysis. Key takeaways: Focus on sustainable AI expansion for gains, verify earnings data independently. Share your thoughts in comments – does this Q3 buzz change your view? #ValueInvesting #AIChips #Semiconductors #EarningsSeason #StockAnalysis
This is educational content only; not financial advice. Always conduct your own due diligence.

Trading is the Game of ProbabilitiesMost traders start with one simple goal ➜ to be right all the time
🔲Right about the trend.
🔲Right about the breakout.
🔲Right about the trade.
But here’s the truth - 'the market doesn’t care who’s right'.
↳ Even the best analysis fails sometimes.
↳ Even the weakest setup works sometimes.
Because trading isn’t a test of accuracy, it’s a test of managing what is more probable.
↳ Profitable traders don’t chase perfection.
↳ They focus on risk, reward, and consistency.
We can be wrong 6 times out of 10...
And still make money if our winners are bigger than our losers.
↳ Trading success is not about predicting.
↳ It’s about positioning and managing our trade.
We manage risk when the odds are low.
We maximize reward when the odds are high.
The shift happens when we stop trying to be right...
and start thinking in probabilities.
That’s when we stop gambling and start profitable trading.
Are you playing casino or managing your risk?
EURUSD Trading Opportunity! SELL!
My dear friends,
My technical analysis for EURUSD is below:
The market is trading on 1.1659 pivot level.
Bias - Bearish
Technical Indicators: Both Super Trend & Pivot HL indicate a highly probable Bearish continuation.
Target - 1.1623
About Used Indicators:
A pivot point is a technical analysis indicator, or calculations, used to determine the overall trend of the market over different time frames.
Disclosure: I am part of Trade Nation's Influencer program and receive a monthly fee for using their TradingView charts in my analysis.
———————————
WISH YOU ALL LUCK

Gold surges strongly after Fed decision – eyes on 4000+ breakout1. Market Movements
After the Federal Reserve cut interest rates by 0.25% and signaled a potential end to quantitative tightening (QT), gold extended its strong upward momentum.
Institutional and ETF buying continues to drive prices higher, with gold now testing the key psychological level at $4000/oz.
2. Technical Analysis
• Near-term Support: $3960 – $3970
• Deeper Support: $3935 – $3940 (pre-Fed accumulation zone & H4 EMA50)
• Immediate Resistance: $3988 – $4000
• Extended Resistance: $4025 – $4040 (mid-October technical high)
• Momentum: Both EMA20 and EMA50 on H1 and H4 are sloping upward, confirming strong bullish momentum. RSI remains elevated (70–75), signaling overbought but still strong trend conditions.
• Volume: Continues to rise steadily, showing sustained institutional inflows. However, short-term correction risks remain near $4000 due to overextension.
3. Outlook
The overall trend remains bullish, but caution is advised as gold approaches the $4000–$4040 resistance zone — a potential area of strong profit-taking.
If gold fails to break above $4040 decisively, a short-term pullback toward $3970 or $3940 is likely.
4. Suggested Trading Plan
🔺 BUY XAU/USD
Entry: $3925 – $3928
🎯 TP: 40 / 80 / 200 pips
🛑 SL: $3922
🔻 SELL XAU/USD
Entry: $4037 – $4040
🎯 TP: 40 / 80 / 200 pips
🛑 SL: $4043

Why Traders Lose Focus After Winning StreaksWinning streaks are dangerous.
They make you feel in control.
You stop thinking in probabilities and start thinking in outcomes.
That shift ends most profitable runs.
After several wins, your brain links confidence with success.
You assume the next trade will also work.
You increase risk, ignore signals, and force setups that do not fit your plan.
This is not trading. It is gambling with momentum.
Your goal is not to feel good.
Your goal is to execute a repeatable process.
Follow these steps:
• Keep your position size fixed for a set number of trades. This prevents emotional scaling.
• Log every trade with entry, exit, and reason. Review data, not emotions.
• Take one day off after three or more wins. It resets focus and stops greed loops.
• Set rules for re-entry after a big win. Do not revenge trade the market in reverse.
• Use alerts instead of constant chart watching. It reduces impulsive entries.
Example:
A trader wins five trades in a row. Balance rises from $10,000 to $11,500.
He increases size from $1,000 per trade to $2,000.
The next trade hits stop loss. He loses $400 instead of $200.
Confidence drops, he forces a recovery trade, loses again.
The account returns to $10,700. Three days of progress lost to one emotional decision.
The fix is mechanical execution.
Do not scale until data shows consistency across at least 30 trades.
Use statistics to guide size, not emotion.
Focus on staying neutral.
Your job is to follow process under pressure.
Discipline after wins separates traders from gamblers.

XAUUSD (GOLD) – ASIA SESSION ANALYSIS RESULTS4️⃣ High-Probability Trade Scenarios
📉 SELL Setup (Main Bias)
• Entry Zone: 3,955 – 3,964 (Golden Zone)
• Confirmation: 5M/15M bearish engulfing or CHoCH after liquidity sweep.
• TPs: 3,940 → 3,930 → 3,916 → 3,898 → 3,886
• SL: Above 3,976
💡 Rationale: Rejection from fib zone aligns with H1 structure continuation; best risk-reward short setup.

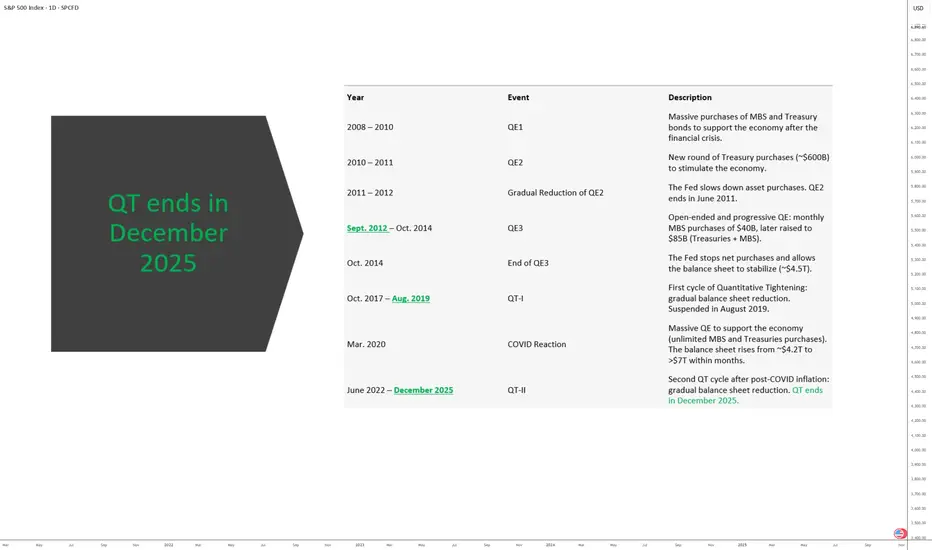
Fed Overview: The Good and the Not So GoodDriven by an euphoric phase, the S&P 500 has approached 7,000 points, nearing its 2000 valuation record, with six consecutive months of gains without retracement.
The key question for investors is now clear: has the Federal Reserve provided enough justification for this confidence, or does Jerome Powell’s caution mark the beginning of the end of this euphoric phase?
1) A Fed slowing the pace without complacency
On Wednesday, October 29, the Fed announced another 25-basis-point rate cut, bringing the federal funds rate into the 3.75%–4.00% range. This is the second consecutive reduction, aimed at countering the labor market slowdown.
However, the FOMC vote revealed strong internal divisions: one member wanted a deeper cut, another preferred no change. This reflects the delicate balance between supporting employment and avoiding renewed inflationary pressure.
Another key signal: the Fed decided to pause its balance sheet reduction (quantitative tightening) starting December 1st, in order to preserve financial system liquidity, as credit markets show early signs of stress. Powell clarified that this pause does not imply a lasting return to an expansionary stance.
Finally, Powell cooled expectations for another rate cut in December, stating that “nothing is guaranteed.” Money markets now price roughly a 70% chance of a hold in December, down from nearly 90% odds of a cut before the meeting.
2) Between monetary realism and market excess
The Fed is not ruling out further easing, but it refuses to fuel a bullish rally in the S&P 500 that is now considered excessive relative to fundamentals.
Current valuations rely heavily on expectations of continued rate cuts. If that narrative weakens, the likelihood of a technical correction in the S&P 500 rises.
At this stage, however, the index has not yet signaled a reversal.
DISCLAIMER:
This content is intended for individuals who are familiar with financial markets and instruments and is for information purposes only. The presented idea (including market commentary, market data and observations) is not a work product of any research department of Swissquote or its affiliates. This material is intended to highlight market action and does not constitute investment, legal or tax advice. If you are a retail investor or lack experience in trading complex financial products, it is advisable to seek professional advice from licensed advisor before making any financial decisions.
This content is not intended to manipulate the market or encourage any specific financial behavior.
Swissquote makes no representation or warranty as to the quality, completeness, accuracy, comprehensiveness or non-infringement of such content. The views expressed are those of the consultant and are provided for educational purposes only. Any information provided relating to a product or market should not be construed as recommending an investment strategy or transaction. Past performance is not a guarantee of future results.
Swissquote and its employees and representatives shall in no event be held liable for any damages or losses arising directly or indirectly from decisions made on the basis of this content.
The use of any third-party brands or trademarks is for information only and does not imply endorsement by Swissquote, or that the trademark owner has authorised Swissquote to promote its products or services.
Swissquote is the marketing brand for the activities of Swissquote Bank Ltd (Switzerland) regulated by FINMA, Swissquote Capital Markets Limited regulated by CySEC (Cyprus), Swissquote Bank Europe SA (Luxembourg) regulated by the CSSF, Swissquote Ltd (UK) regulated by the FCA, Swissquote Financial Services (Malta) Ltd regulated by the Malta Financial Services Authority, Swissquote MEA Ltd. (UAE) regulated by the Dubai Financial Services Authority, Swissquote Pte Ltd (Singapore) regulated by the Monetary Authority of Singapore, Swissquote Asia Limited (Hong Kong) licensed by the Hong Kong Securities and Futures Commission (SFC) and Swissquote South Africa (Pty) Ltd supervised by the FSCA.
Products and services of Swissquote are only intended for those permitted to receive them under local law.
All investments carry a degree of risk. The risk of loss in trading or holding financial instruments can be substantial. The value of financial instruments, including but not limited to stocks, bonds, cryptocurrencies, and other assets, can fluctuate both upwards and downwards. There is a significant risk of financial loss when buying, selling, holding, staking, or investing in these instruments. SQBE makes no recommendations regarding any specific investment, transaction, or the use of any particular investment strategy.
CFDs are complex instruments and come with a high risk of losing money rapidly due to leverage. The vast majority of retail client accounts suffer capital losses when trading in CFDs. You should consider whether you understand how CFDs work and whether you can afford to take the high risk of losing your money.
Digital Assets are unregulated in most countries and consumer protection rules may not apply. As highly volatile speculative investments, Digital Assets are not suitable for investors without a high-risk tolerance. Make sure you understand each Digital Asset before you trade.
Cryptocurrencies are not considered legal tender in some jurisdictions and are subject to regulatory uncertainties.
The use of Internet-based systems can involve high risks, including, but not limited to, fraud, cyber-attacks, network and communication failures, as well as identity theft and phishing attacks related to crypto-assets.
EUR/USD – Triangle Breakout After Fed’s Cautious CutThe Fed cut rates by 25 bps, but Powell’s cautious tone killed the dovish mood — hinting this might be the last cut for a while. That shift powered the USD back up, leaving the euro on the defensive.
Technically, EUR/USD broke out below a contracting triangle that had been squeezing price for days. The breakout near 1.1615 shows that the range has resolved to the downside, confirming fresh bearish momentum. As long as the pair trades below 1.1650, I’m eyeing 1.1550–1.1530 as the next target zone.
For me, both sides align perfectly — fundamental disappointment + technical breakout = clean bearish setup.

DXY FRGNT Daily Forecast - Q4 | W44 | D30| Y25 |📅 Q4 | W44 | D30| Y25 |
📊 DXY FRGNT Daily Forecast
🔍 Analysis Approach:
I’m applying Smart Money Concepts, focusing on:
Identifying Points of Interest on the Higher Time Frames (HTFs) 🕰️
Using those POIs to define a clear trading range 📐
Refining those zones on Lower Time Frames (LTFs) 🔎
Waiting for a Break of Structure (BoS) for confirmation ✅
This method allows me to stay precise, disciplined, and aligned with the market narrative, rather than chasing price.
💡 My Motto:
"Capital management, discipline, and consistency in your trading edge."
A positive risk-to-reward ratio, paired with a high win rate, is the backbone of any solid trading plan 📈🔐
⚠️ Losses?
They’re part of the mathematical game of trading 🎲
They don’t define you — they’re necessary, they happen, and we move forward 📊➡️
🙏 I appreciate you taking the time to review my Daily Forecast.
Stay sharp, stay consistent, and protect your capital
— FRNGT 🚀
TVC:DXY

The Interconnected Role of Banks and Financial Markets1. The Foundation: Banking and Market Structures
At the heart of the financial system lie two major components—banks and financial markets—that collectively mobilize and allocate resources.
Banks are institutions that accept deposits and extend loans, serving as a bridge between surplus and deficit units. They play a key role in transforming short-term deposits into long-term credit—a process known as maturity transformation.
Financial markets, on the other hand, provide direct channels for capital raising. Investors buy securities issued by corporations or governments, thus providing funds without the need for traditional bank intermediation.
While both systems perform similar economic functions—mobilizing savings, facilitating investment, and managing risks—the mechanisms differ. Banks rely on balance-sheet intermediation, whereas markets depend on price mechanisms and investor behavior. Over time, the boundary between them has blurred due to financial innovation, deregulation, and globalization.
2. Complementary Functions in Capital Allocation
Banks and financial markets complement each other in channeling funds to productive sectors.
Banks specialize in relationship-based finance. They lend to small and medium-sized enterprises (SMEs), consumers, and sectors where creditworthiness is difficult to assess using market signals. Through continuous relationships, banks monitor borrowers, reduce information asymmetry, and support long-term projects.
Financial markets excel in allocating large-scale capital efficiently. Public corporations issue shares or bonds to raise funds from a diverse investor base, allowing broader participation and liquidity. Market prices serve as signals that guide resource allocation—firms with strong prospects can attract funds easily, while weaker firms face higher costs.
This complementarity ensures that both traditional lending and market-based finance coexist, offering a diversified funding ecosystem. For instance, in emerging markets, banks often dominate due to limited capital market development. In contrast, in advanced economies like the U.S., markets play a larger role, but banks remain critical in supporting households and smaller firms.
3. Interdependence through Financial Instruments
The interaction between banks and markets is not merely functional—it is structural. Banks are active participants in financial markets as investors, borrowers, and intermediaries.
As investors, banks hold government securities, corporate bonds, and even equities as part of their portfolios. These assets help manage liquidity, meet regulatory requirements, and generate income.
As borrowers, banks raise funds in the interbank and bond markets, issuing certificates of deposit (CDs), commercial papers, or subordinated debt.
As intermediaries, they facilitate client transactions, underwrite securities, and provide market-making services.
The development of securitization—where banks pool loans (like mortgages) and sell them as securities—further integrates banks with capital markets. This process frees up bank capital for new lending but also links their balance sheets to market fluctuations. The 2008 Global Financial Crisis demonstrated how deep this interconnection had become: when market liquidity dried up, banks’ asset values plummeted, and credit supply froze, leading to a systemic collapse.
4. Role in Monetary Policy Transmission
The central bank’s monetary policy relies heavily on the interconnectedness of banks and financial markets. Policy instruments such as interest rates, reserve requirements, and open market operations influence both sectors simultaneously.
Through banks, lower policy rates reduce borrowing costs, encouraging credit expansion. Higher rates, conversely, tighten lending and cool demand.
Through financial markets, interest rate changes impact bond yields, stock valuations, and investor sentiment. A cut in rates typically boosts equity prices and lowers bond yields, improving firms’ ability to raise funds.
The policy transmission mechanism, therefore, operates via both the bank-lending channel and the asset-price channel. If either sector weakens—say, if banks are undercapitalized or markets are illiquid—the effectiveness of monetary policy diminishes. Hence, a well-integrated and stable relationship between banks and markets is essential for maintaining macroeconomic stability.
5. Risk Sharing and Financial Stability
A major benefit of interconnectedness is diversified risk sharing. Financial markets distribute risks among a broad base of investors, while banks absorb and manage credit risks internally.
However, this interlinkage can also amplify vulnerabilities. Banks’ exposure to market risks—interest rate, liquidity, and credit spread risks—means that shocks in markets can directly hit bank balance sheets. For example, a sudden rise in bond yields can devalue banks’ holdings, reducing their capital adequacy. Similarly, a decline in stock or real estate prices can increase default risks among borrowers.
To mitigate such contagion, financial regulators emphasize macroprudential policies, stress testing, and capital buffers. The Basel III framework, for instance, requires banks to maintain higher liquidity and leverage ratios to withstand market shocks. Simultaneously, market regulators enforce disclosure and transparency norms to prevent mispricing of risks.
6. The Shift Toward Market-Based Finance
In recent decades, there has been a structural shift from bank-dominated systems to market-based finance, particularly in advanced economies. The rise of institutional investors—such as pension funds, mutual funds, and insurance companies—has reduced firms’ dependence on bank loans. Securitization and shadow banking have expanded credit creation outside the traditional banking system.
This evolution enhances financial flexibility but also introduces new systemic risks. Market-based institutions are less regulated and more sensitive to investor sentiment. During crises, sudden capital outflows or liquidity shortages can trigger chain reactions that eventually affect banks. Hence, central banks now monitor not only banking indicators but also non-bank financial intermediation (NBFI) activities to assess systemic health.
7. Globalization and Cross-Border Interlinkages
Global financial integration has deepened the ties between banks and markets across borders. International banks operate in multiple jurisdictions, participating in global bond, currency, and derivative markets. Capital flows move rapidly in response to policy changes or market shocks, linking domestic systems to global cycles.
For example, when the U.S. Federal Reserve tightens rates, emerging markets often experience capital outflows, currency depreciation, and tighter liquidity conditions. Banks in these countries face funding pressures, while local bond markets witness volatility. The 1997 Asian Financial Crisis and the 2008 Global Financial Crisis both highlighted how cross-border linkages can transmit shocks worldwide.
This interconnectedness calls for international coordination in financial regulation and crisis management. Institutions such as the IMF, BIS, and FSB play vital roles in promoting stability through policy frameworks and global standards.
8. Digitalization and Financial Innovation
The digital era has redefined how banks and markets interact. Fintech, blockchain, and digital payments have blurred traditional boundaries even further. Banks use algorithmic trading, robo-advisory, and tokenized assets to access markets efficiently. Meanwhile, online platforms offer market-based credit (peer-to-peer lending) that competes with bank loans.
While innovation enhances efficiency and inclusion, it also introduces cybersecurity risks, data privacy concerns, and regulatory challenges. Central banks are exploring Central Bank Digital Currencies (CBDCs) to ensure that digital finance remains integrated with the formal monetary system. The next phase of interconnectedness will likely involve hybrid models—where banks act as gateways to decentralized markets while maintaining regulatory oversight.
9. The Role During Economic Crises
During economic downturns or financial crises, the interdependence of banks and markets becomes most visible. When one system falters, the other provides temporary stability—though sometimes at a cost.
In crises like 2008, central banks injected liquidity into both sectors through quantitative easing (QE)—purchasing bonds and securities to stabilize markets and ensure banks had access to funds.
Conversely, when markets freeze, banks become the primary credit providers, cushioning the economy through lending backed by government guarantees.
The COVID-19 pandemic reaffirmed this relationship. As markets crashed, banks played a stabilizing role by extending credit lines, while policy interventions restored confidence in capital markets. Such coordination ensures the continuity of capital flow and prevents systemic collapse.
10. Emerging Market Perspectives
In emerging economies like India, Brazil, and Indonesia, banks traditionally dominate the financial system due to underdeveloped markets. However, the trend is gradually changing as equity and bond markets expand and retail participation grows.
For instance, in India, the rise of corporate bond markets, mutual funds, and Sovereign Gold Bonds (SGBs) has diversified funding channels. Yet, banks remain central to infrastructure financing and SME lending—areas where markets are less effective. The integration between banks and markets is therefore essential for mobilizing long-term capital, especially for nation-building projects.
Regulatory bodies like the Reserve Bank of India (RBI) and SEBI coordinate to align monetary and market policies, ensuring balance between credit growth and capital market stability.
11. Policy Implications and the Need for Balance
The interconnectedness between banks and markets creates both opportunities and risks. Policymakers must strike a balance between efficiency, innovation, and stability.
Excessive dependence on banks can limit credit diversification and expose economies to concentrated risks.
Overreliance on markets can lead to speculative bubbles and volatility.
Thus, a hybrid financial architecture—where banks and markets complement each other—is most desirable. Regulations should encourage market deepening while ensuring that banks remain well-capitalized and resilient.
Coordinated oversight, robust information systems, and global cooperation are crucial. Transparency in both banking operations and market transactions helps prevent contagion and enhances investor confidence.
12. Conclusion: An Integrated Financial Ecosystem
The relationship between banks and financial markets is not one of competition, but of mutual reinforcement. Together, they form an integrated ecosystem that fuels economic growth, manages risks, and supports innovation. Their interconnection ensures that savings are efficiently transformed into investments, liquidity is maintained across sectors, and monetary policy reaches its intended targets.
As the global economy evolves—driven by technology, globalization, and sustainability—this partnership will become even more intricate. The challenge for regulators, investors, and policymakers is to harness the benefits of this interconnectedness while minimizing systemic vulnerabilities. A stable, transparent, and adaptive financial system—where banks and markets coexist harmoniously—is the cornerstone of a resilient global economy.

Why the Eurodollar Market Became a Financial HavenIntroduction
The Eurodollar market stands as one of the most significant and transformative developments in modern finance. Despite its name, the term “Eurodollar” has little to do with Europe as a continent or the euro as a currency. Instead, it refers to U.S. dollar-denominated deposits held in banks outside the United States, particularly in Europe during its early days. What began as a niche market in the post-World War II era gradually evolved into a global financial haven—an offshore ecosystem of liquidity, flexibility, and innovation that reshaped international finance.
Understanding why the Eurodollar market became a financial haven requires examining the historical context, regulatory framework, and the incentives driving global capital flows. It was not merely a byproduct of globalization; it was the very foundation that allowed global finance to operate efficiently across borders, free from the constraints of national monetary policies.
1. Origins of the Eurodollar Market
The roots of the Eurodollar market trace back to the late 1940s and 1950s, when geopolitical tensions and economic transformations began reshaping the financial landscape. After World War II, the United States emerged as the world’s dominant economic power, with the U.S. dollar becoming the global reserve currency under the Bretton Woods system.
During this time, many foreign banks and corporations began holding dollar deposits outside the United States, particularly in European banks. One of the first major holders of such deposits was the Soviet Union, which sought to protect its dollar holdings from potential U.S. sanctions during the Cold War. By placing dollars in European banks, the Soviets could still conduct trade and financial transactions in dollars—without the risk of U.S. authorities freezing their assets.
As European economies rebuilt under the Marshall Plan, dollar-based trade expanded rapidly. European banks found themselves flush with dollar deposits, which they began lending out to other international borrowers. This marked the birth of the Eurodollar market—a decentralized, unregulated offshore market for U.S. dollars.
2. Regulatory Arbitrage: The Core Catalyst
The Eurodollar market thrived largely because it existed outside U.S. regulatory jurisdiction. Domestic banks in the United States faced strict regulations under the Federal Reserve System, including reserve requirements and interest rate ceilings imposed by Regulation Q. These restrictions limited how much interest U.S. banks could pay on deposits and constrained their lending flexibility.
In contrast, offshore banks—mainly in London—were not subject to U.S. banking regulations. This regulatory arbitrage created a competitive advantage: Eurodollar deposits could offer higher interest rates, and Eurodollar loans could be made more flexibly and at lower costs.
Borrowers and depositors around the world quickly recognized the benefits. Multinational corporations preferred Eurodollar loans for their international operations, and investors sought Eurodollar deposits for better yields. The absence of reserve requirements meant that Eurobanks could leverage their funds more aggressively, enhancing liquidity in the market.
This unregulated freedom made the Eurodollar system an ideal haven—a place where capital could move freely, unencumbered by the constraints of national borders and domestic monetary policies.
3. The London Advantage: The World’s Financial Hub
London’s role as the birthplace and hub of the Eurodollar market was no coincidence. The city had centuries of experience as a global financial center, connecting Europe, America, and the Commonwealth. By the 1950s, the British government encouraged offshore banking activity to boost its post-war economy and maintain London’s global relevance.
The Bank of England adopted a hands-off approach toward Eurodollar transactions, seeing them as foreign currency operations that did not affect domestic monetary stability. This permissive environment, combined with London’s strategic time zone (bridging Asia and America), created a perfect breeding ground for 24-hour international finance.
As a result, London became the nerve center of global dollar liquidity, with Eurodollar deposits circulating seamlessly between Europe, Asia, and the Americas. By the 1970s, Eurodollar markets had become the cornerstone of global finance—fueling trade, investment, and speculation on an unprecedented scale.
4. The Rise of Global Liquidity and Flexibility
The Eurodollar market’s greatest strength was its ability to provide liquidity when and where it was needed most. Unlike domestic banking systems, which were often constrained by national policies and reserve rules, Eurobanks operated in a borderless environment.
Corporations used Eurodollar loans to fund trade, mergers, and acquisitions, while central banks and sovereign wealth funds used Eurodollar deposits as a store of value. The market also became a vital source of funding for governments, especially developing nations seeking to borrow in dollars without going through the tightly regulated U.S. market.
By the late 1960s, the Eurodollar market had grown into a massive pool of offshore liquidity. When the Bretton Woods system collapsed in 1971 and exchange rates began to float, the Eurodollar market became even more essential. It offered a global mechanism for hedging, borrowing, and investing across currencies—laying the foundation for today’s interconnected financial system.
5. Freedom from Monetary Control
Another key reason the Eurodollar market became a financial haven lies in its freedom from central bank control. In the U.S., the Federal Reserve could regulate domestic money supply, influence interest rates, and impose capital controls. However, it had little jurisdiction over offshore dollar transactions.
This meant that even when the Fed tightened domestic credit conditions, international borrowers could still access dollar liquidity through Eurobanks. In essence, the Eurodollar market allowed global finance to operate independently of U.S. monetary policy.
This autonomy had far-reaching implications. It weakened the effectiveness of national monetary controls and allowed financial institutions to bypass domestic credit restrictions. The result was a truly globalized money market—one that operated beyond the reach of any single government, creating a self-sustaining ecosystem of private credit creation.
6. Innovation and Market Instruments
The Eurodollar market also became a laboratory for financial innovation. As competition intensified, banks developed new instruments to manage risk and enhance returns. These included floating-rate loans, syndicated lending, and short-term Eurodollar certificates of deposit.
The introduction of the London Interbank Offered Rate (LIBOR) in the 1960s provided a standardized benchmark for pricing Eurodollar loans. LIBOR quickly became the most important reference rate in global finance, underpinning trillions of dollars in loans, derivatives, and securities.
These innovations transformed the Eurodollar market into a complex web of interbank relationships and credit channels. It was not just a deposit market—it was a full-fledged financial system operating parallel to, but distinct from, domestic banking systems.
7. Safe Haven for Capital and Sovereigns
For many investors and nations, the Eurodollar market became a safe haven for several reasons:
Currency Stability: The U.S. dollar was (and remains) the world’s most trusted currency. Holding dollar assets offshore allowed investors to preserve value even when local currencies faced inflation or devaluation.
Confidentiality: Offshore banking jurisdictions often offered privacy and discretion, making them attractive to corporations, governments, and wealthy individuals seeking to protect their assets from political risks.
Political Neutrality: During the Cold War and beyond, the Eurodollar market offered a politically neutral ground for transactions between entities that might not otherwise cooperate through U.S.-regulated channels.
Diversification: Holding Eurodollar assets provided global investors with diversification away from domestic financial risks.
These features reinforced the Eurodollar market’s reputation as a financial sanctuary, a place where money could flow freely and securely amid global uncertainty.
8. The Eurodollar Market and Global Financial Power
Over time, the Eurodollar system reshaped the balance of financial power. It gave rise to massive offshore banking networks, enabled shadow banking, and facilitated the globalization of credit.
By the 1980s and 1990s, Eurodollar deposits had become an integral part of international capital markets. They funded corporate expansions, sovereign debt issuance, and speculative investments across continents. Even today, a significant portion of the world’s dollar liquidity exists outside U.S. borders—testament to the enduring legacy of the Eurodollar market.
In essence, the Eurodollar market made the U.S. dollar truly global—not just a national currency, but the lifeblood of international finance. Ironically, while it strengthened the dollar’s dominance, it simultaneously limited America’s ability to control its own currency’s global circulation.
9. Challenges and Risks
While the Eurodollar market offered flexibility and freedom, it also introduced new risks. The absence of regulation meant there was no lender of last resort for Eurobanks. During periods of financial stress, such as the 2008 Global Financial Crisis, the shortage of dollar liquidity in offshore markets amplified global instability.
Moreover, the market’s opacity made it difficult for regulators to monitor systemic risk. Interbank exposures, derivative linkages, and maturity mismatches often went undetected until crises struck. Despite these challenges, the Eurodollar market’s scale and interconnectedness made it impossible to dismantle—it had become too central to the functioning of global finance.
10. The Modern Eurodollar Landscape
Today, the Eurodollar market continues to play a vital role, even as financial technology and regulations evolve. Although LIBOR is being phased out and replaced by alternative benchmarks like SOFR (Secured Overnight Financing Rate), the fundamental dynamics of offshore dollar liquidity remain intact.
From Asian financial hubs like Singapore and Hong Kong to Middle Eastern centers like Dubai, the Eurodollar spirit lives on through global dollar lending and deposit activities. The rise of digital finance and offshore capital markets further extends the reach of the Eurodollar ecosystem—making it an indispensable pillar of the global financial architecture.
Conclusion
The Eurodollar market became a financial haven because it embodied freedom, efficiency, and trust in a world increasingly shaped by regulation and geopolitics. Its unregulated origins offered participants higher yields and greater flexibility, while its global reach turned the U.S. dollar into a universal instrument of trade, investment, and security.
From Cold War strategies to modern financial globalization, the Eurodollar market represents more than just offshore banking—it represents the world’s pursuit of monetary independence beyond political borders.
Even in the 21st century, the Eurodollar system remains the invisible backbone of global liquidity, silently powering international finance. It is both a sanctuary for capital and a mirror of our interconnected economic reality—a financial haven born from innovation, trust, and the unstoppable flow of money across nations.
