NZD/USD BULLS ARE GAINING STRENGTH|LONG
Hello, Friends!
NZD/USD pair is trading in a local downtrend which we know by looking at the previous 1W candle which is red. On the 4H timeframe the pair is going down too. The pair is oversold because the price is close to the lower band of the BB indicator. So we are looking to buy the pair with the lower BB line acting as support. The next target is 0.575 area.
Disclosure: I am part of Trade Nation's Influencer program and receive a monthly fee for using their TradingView charts in my analysis.
✅LIKE AND COMMENT MY IDEAS✅
Contains image

Price Action: Long Term, Mid Term, Short Term Trend Explained
In this article, I will teach you the basics of market trend analysis.
We will discuss Long Term, Mid Term and Short Term trends.
I will show you how to identify and apply them properly.
Please, note that we will execute the trend analysis strictly on a daily time frame.
For the trend identification, we will rely on classics price action analysis rules.
We will say that the trend is bullish if the price forms at least 2 consequent bullish impulses with a retracement leg between them, so that the price would set at least 2 higher highs and a higher low between them.
We will say that the trend is bearish if the price forms at least 2 consequent bearish impulses with a retracement leg between them, so that the price would set at least 2 lower lows and a lower high between them.
If none of these conditions are met, we will say that the market is consolidating .
Long Term Trend
Long term trend is based on the analysis of a price action over 1 year.
To identify a long-term trend, start by analyzing the price action over a period of one year from the current trading day.
Analyze highs and lows.
According to the rules, the long term trend on USDCAD is consolidation.
Mid-Term Trend
Mid-term trend is based on the analysis of a price action over the last 5 months.
To identify a mid-term trend, start by analyzing the price action over a period of 5 months from the current trading day.
Analyze highs and lows.
According to our rules, the mid term trend on the pair is bearish.
Short Term Trend
Short term trend is based on the analysis of a price action over the last 2 months.
To identify a short-term trend, start by analyzing the price action over a period of 2 months from the current trading day.
Analyze highs and lows.
According to our rules, the short term trend on the pair is bearish.
According to our trend analysis,
long term trend is a consolidation,
mid-term trend is bearish,
short term trend is bearish.
Combining these 3 trends, we can derive that the pair is trading
in a huge range . After the price reached a resistance of the range, the price started to trade both in a short term and midterm bearish trends.
We can anticipate a bearish continuation till the price reaches a support of a long term range.
That is how you execute a trend analysis with price action.
❤️Please, support my work with like, thank you!❤️
I am part of Trade Nation's Influencer program and receive a monthly fee for using their TradingView charts in my analysis.

GBPCHF Is Bullish! Buy!
Take a look at our analysis for GBPCHF.
Time Frame: 4h
Current Trend: Bullish
Sentiment: Oversold (based on 7-period RSI)
Forecast: Bullish
The market is approaching a key horizontal level 1.058.
Considering the today's price action, probabilities will be high to see a movement to 1.062.
P.S
Overbought describes a period of time where there has been a significant and consistent upward move in price over a period of time without much pullback.
Like and subscribe and comment my ideas if you enjoy them!

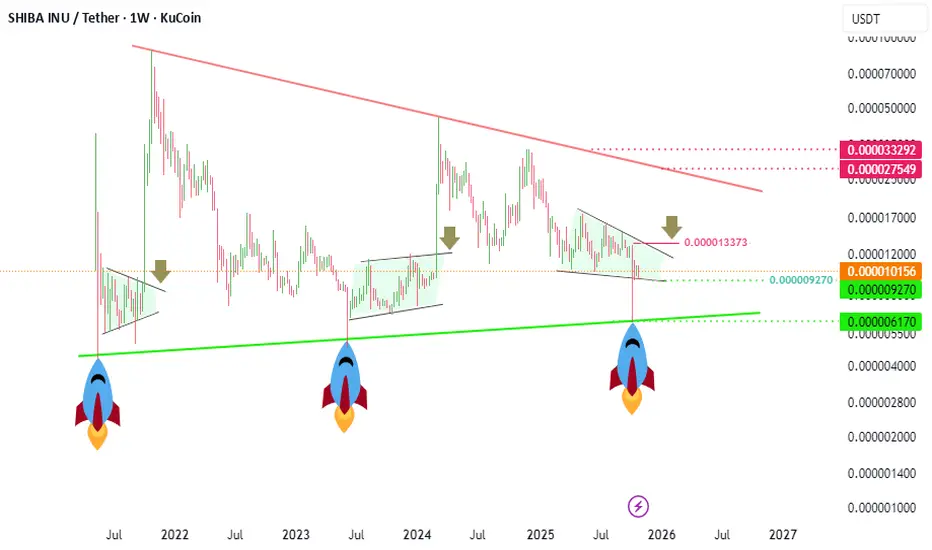
#SHIBUSDT ( pump ? )Whenever it hits the green support line,
it becomes a rocket.
Before it becomes a rocket,
it also formed a green compression pattern and
reached the ceiling by breaking out of the ceiling of the pattern.
The Fundamental Inverse Relationship: Gold (XAU) vs. USD The Fundamental Inverse Relationship: Gold (XAU) vs. The Dollar (USD)
The "rule" that Gold and the USD move inversely (one goes up, the other goes down) is based on three core principles:
💲 1. The Pricing Mechanism
This is the most direct reason. On the global market, Gold (XAU) is priced in US Dollars (USD). The ticker XAU/USD literally represents this: "How many US Dollars does it take to buy one ounce of Gold?"
If the USD gets stronger (its value rises): It now takes fewer dollars to buy that same ounce of gold. As a result, the price of XAU/USD falls.
If the USD gets weaker (its value falls): It now takes more dollars to buy that same ounce of gold. As a result, the price of XAU/USD rises.
This mechanical relationship also affects foreign buyers. If the USD is strong, it becomes more expensive for investors holding Euros, Yen, or Pounds to buy Gold, which can reduce demand and lower the price.
💲 2. The "Safe-Haven" Competition
In times of economic or geopolitical stress, investors flee to safety. The two most traditional "safe-haven" assets are Gold and the US Dollar. They are often in direct competition for this safe-haven capital.
When the fear is about the global economy (but the US is stable): Investors often buy USD, seeing it as the most stable and liquid "cash" in the world. In this scenario, the USD rises, and demand for Gold (as an alternative) may fall.
When the fear is about the US economy (high inflation, weak growth, political instability): Investors lose confidence in the USD. They sell Dollars and buy Gold, which is seen as a non-political, tangible store of value that cannot be devalued by a central bank. This is the classic inverse relationship: USD down, Gold up.
💲 3. Store of Value and Inflation
Gold is considered the ultimate store of value and an inflation hedge. The USD is a fiat currency—its value is based on faith in the US government and Federal Reserve.
High Inflation: When inflation in the US rises, each dollar buys less (its purchasing power decreases). Investors anticipate this and move their wealth from "cash" (which is losing value) into "hard assets" like Gold (which holds its value against inflation). This action—selling USD to buy XAU—drives the dollar down and gold up.
Interest Rates (The Fed): This is the engine that drives the relationship.
When the Fed raises rates: It makes holding USD more attractive (you earn higher interest). Investors buy USD to get this "yield." Gold, which pays zero interest, becomes less attractive by comparison (it has an "opportunity cost"). Money flows out of Gold and into the Dollar. (USD up, Gold down).
When the Fed cuts rates: Holding USD becomes less attractive (low yield). The "opportunity cost" of holding Gold disappears. Low rates also often signal economic weakness or are intended to create inflation, both of which are very bullish for Gold. (USD down, Gold up).
🛡️ How This Relationship Impacts the Global Economy
This isn't just a chart for traders; this relationship is a powerful signal that has real-world economic consequences.
💸 1. It Acts as a Global Confidence Barometer
The XAU/USD price is a very clear and instant report card on the market's confidence in the US economy and its monetary policy.
A high or rising Gold price combined with a falling USD is a strong signal of low confidence. It tells the world that investors are worried about US inflation, debt, or political stability. This fear can become self-fulfilling, as it may discourage foreign investment in US stocks and bonds, slowing the economy.
💸 2. It Directly Impacts International Trade
The value of the dollar (the "D" in XAU/USD) dictates the price of goods for the entire world.
A Strong Dollar (Weak Gold): This makes US-made goods (exports) more expensive and less competitive for the rest of the world. It can hurt US manufacturers and farmers. However, it makes imports cheaper for Americans, which helps keep US inflation low.
A Weak Dollar (Strong Gold): This makes US exports cheaper and more attractive, which can boost the US manufacturing sector and GDP. However, it makes all imported goods (like electronics, cars, and especially oil) more expensive for Americans, which can cause or worsen domestic inflation.
💸 3. It Influences Central Bank Policy
Foreign central banks (like those in China, India, Russia, and Europe) hold trillions of US Dollars in their foreign exchange reserves. They are constantly managing their exposure.
Loss of Faith in USD: If these central banks fear the USD will lose its value (e.g., they see Gold rising), they will actively diversify their reserves. They will sell their USD-denominated assets (like US Treasury bonds) and buy physical Gold.
The Consequence: This selling of US bonds forces US interest rates to go up (to attract new buyers). This makes it more expensive for the US government to borrow money and for American citizens to get mortgages or car loans, which slows down the entire US economy.
💸 4. It Determines the Price of Critical Commodities
Because the USD is the world's reserve currency, most major commodities—especially oil—are priced in dollars.
When the USD is weak (Gold is often strong), oil becomes cheaper for other nations to buy in their local currency. This can stimulate global economic growth.
When the USD is strong (Gold is often weak), oil becomes extremely expensive for the rest of the world. This can slow global manufacturing, increase shipping costs, and act as a major drag on the entire global economy.

$btc idea for weekend big range to play ! BTC has big range bounce off at 0.78 fib level
1- bullish : if we can take one level of higher low around 111.7K and change this structure there is change we move higher from here likely sunday pump
2-bearish: if we have slow price action over weekend with slow bleed get below 108.4K we might sweep low of range or touch 0.786 level once again
what you think happen first ?

Bitcoin Update – November 1, 2025 - Revised 2026 target $46KBitcoin and Crypto Market Update – November 1, 2025
Bitcoin has completed its cup-and-handle pattern , hitting the technical target near $118,000 before rolling over into a fresh rising-wedge formation . The new structure is supported by declining volume , hinting at fading momentum and a potential pullback toward $46,000 .
Today’s move mirrors broader macro caution—the Fed’s pause on rate cuts and Trump–Xi trade tensions have triggered a wave of risk-off sentiment. Bitcoin is down 3.8% to $110,063 , Ethereum −3.6% ($3,853), and XRP −4.1% ($2.51).
Despite the dip, ETF inflows remain strong (BTC +$202 M, ETH +$246 M), showing institutions still buying the weakness. November historically delivers +42.5% average gains, but traders should stay alert as the rising wedge matures.
Technical summary:
* ✅ Cup & Handle target ≈ $118 K (completed)
* ⚠️ Rising Wedge forming → Target ≈ $46 K
* 📉 Volume decline = weakening trend strength
* 🟢 Institutional inflows = long-term support, volume declining over 5-10 year cycle
📊 Posted by Market Monkey — decoding the market’s next move.

Will Ethereum’s tight range lead to a breakout? | Day 34☃️ Welcome to the cryptos winter , I hope you’ve started your day well.
⏰ We’re analyzing BTC on the 1-Day timeframe .
👀 Ethereum on the daily timeframe. Ethereum is currently inside a box-like structure in a trading range format. The top of this trading range is in the $4,161 area, and the bottom of this trading range is in the $3,801 price area, where by breaking these zones, Ethereum can start a stronger and more impulsive leg of movement.
🧮RSI oscillator, which has now formed two important oscillation zones for us — one around 54, which overlaps with our long trigger, and the other around 40, which overlaps with our short trigger. The fluctuation limit crossing these zones can give more momentum to Ethereum’s next move on the daily timeframe.
🕯 Ethereum’s volume, after the flash crash the market experienced, has increased sharply, but the tendency has been pushed toward selling pressure, which has caused Ethereum’s corrections to always come with selling pressure.
📈 For Ethereum positioning, the specified zones have high price action validity, where you can set alerts so that if the price reaches these zones, you can open a position. Or, in the multi-timeframe, you can find the identified support and resistance zones and open positions with lower risk around these areas, moving toward anticipating higher or lower levels, so that in each level, you can add some risk to your position.
❤️ Disclaimer : This analysis is purely based on my personal opinion and I only trade if the stated triggers are activated .

Understanding the Concept of Exotic OptionsIntroduction: Beyond the Vanilla Options
In the world of derivatives trading, options are among the most powerful instruments available to investors. Traditional or “vanilla” options—such as calls and puts—are already versatile tools for hedging and speculation. However, as financial markets evolved, traders and institutions began to seek more sophisticated instruments that could offer customized payoffs, align with complex risk management needs, or exploit specific market views. This need gave birth to a more advanced class of derivatives known as exotic options.
Exotic options go beyond the standard payoff structure of vanilla options. They can depend on multiple underlying assets, trigger conditions, time periods, or paths that prices follow. These options have become integral in structured products, risk management, and tailored investment strategies, particularly in global forex, commodity, and equity-linked markets.
This essay explores the concept, types, valuation, applications, advantages, and risks of exotic options—providing a comprehensive understanding of how these instruments work in modern finance.
1. What Are Exotic Options?
Exotic options are non-standard derivative contracts that have complex features differentiating them from traditional options. While vanilla options grant the right to buy (call) or sell (put) an asset at a predetermined strike price before or at expiration, exotic options can alter how and when payoffs are determined.
They may:
Depend on the path of the underlying asset’s price, not just its final value.
Have multiple exercise or settlement dates.
Involve different underlying assets or currencies.
Include barriers, averages, or digital features that modify payouts.
For instance, a barrier option may only become active (“knock-in”) or inactive (“knock-out”) if the underlying price crosses a specified level. Similarly, an Asian option’s payoff depends on the average price of the underlying over time, reducing volatility effects.
Exotic options are thus tailored to specific investor needs—allowing hedgers or speculators to fine-tune their exposure to price movements, volatility, and time decay.
2. Evolution and Market Use
The development of exotic options traces back to the late 1970s and 1980s, when financial innovation surged alongside advances in computing and quantitative finance. Early forms appeared in the foreign exchange and commodity markets, where traders needed customized hedging tools to manage complex exposures.
By the 1990s, exotic options became a cornerstone of structured finance, used by investment banks to create tailor-made products for corporate clients and high-net-worth investors.
Today, exotic options are found across:
Currency markets (FX options): Commonly used for hedging exchange rate risks.
Commodity markets: To manage exposure to volatile prices.
Equity-linked notes and structured products: For customized return profiles tied to indices or stock baskets.
Interest rate and credit derivatives: To hedge rate movements or credit events.
Exotic options have thus evolved from niche instruments into mainstream financial engineering tools—allowing traders to achieve precise risk-return outcomes that vanilla options cannot offer.
3. Key Characteristics of Exotic Options
Exotic options differ from vanilla options through unique features such as:
a. Path Dependency
In vanilla options, only the final price of the underlying asset matters. In exotic options, however, the entire price path may influence the payoff.
Example: In an Asian option, the payoff depends on the average price over time, not the terminal price at expiration.
b. Conditional Payoffs
Many exotic options include “if-and-only-if” conditions. For instance:
Barrier options activate or deactivate based on price thresholds.
Lookback options depend on the maximum or minimum price achieved during the option’s life.
c. Multi-Asset Dependence
Some exotic options depend on more than one underlying, such as currency pairs, indices, or stock baskets.
Example: A basket option may be based on the average performance of multiple assets.
d. Complex Exercise Rules
Unlike American or European options, some exotics allow customized exercise schedules or partial exercises tied to specific market events.
e. Tailored Payout Structures
Payoffs can be linear, binary, capped, or floored—allowing unique risk-reward combinations suited to specific strategies.
4. Major Types of Exotic Options
There are numerous exotic options, but the following categories are among the most common and important:
a. Barrier Options
Barrier options are activated or extinguished when the underlying asset hits a certain level.
Types include:
Knock-in options: Become active only if the price crosses the barrier.
Knock-out options: Become void if the barrier is breached.
Double-barrier options: Have both upper and lower thresholds.
These are popular in currency and commodity markets due to their cost-effectiveness and targeted exposure.
b. Asian Options
Also known as average options, these derive their value from the average price of the underlying over a period.
They are used to smooth out volatility and reduce the impact of short-term price swings—ideal for commodities or volatile assets.
c. Lookback Options
Lookback options allow the holder to “look back” over the life of the option to determine the optimal strike or payoff.
For instance, the holder of a lookback call can buy at the lowest price observed during the option period.
These are valuable for volatility trading and performance-linked bonuses, but are more expensive due to the flexibility they provide.
d. Binary (Digital) Options
Binary options provide all-or-nothing payouts. If a condition is met (for example, the asset price exceeds the strike), a fixed amount is paid; otherwise, nothing is received.
They are used in speculative trading and hedging against specific events (like rate announcements or price thresholds).
e. Compound Options
A compound option is an option on another option. There can be four variants—call on call, call on put, put on call, and put on put.
These are primarily used by institutional investors managing portfolios of options or structured exposures.
f. Chooser Options
These allow the holder to decide, at a future date, whether the option will be a call or put.
They are ideal for hedging uncertainty, especially in situations where the future direction of prices is unclear.
g. Rainbow or Basket Options
These depend on multiple underlying assets. The payoff may be linked to the best or worst performer, or an average of all.
Used widely in equity-linked structured products to diversify exposure.
h. Barrier-Rebate and Range Options
In these, the payoff depends on whether the price stays within a certain range or hits a barrier, sometimes offering a rebate if deactivated.
5. Pricing and Valuation Challenges
Pricing exotic options is more complex than pricing vanilla ones because of path dependency and non-linear payoffs. Traditional Black-Scholes models are insufficient for many exotics. Instead, advanced methods such as:
Monte Carlo simulation (for path-dependent options),
Binomial or trinomial tree models (for barrier options),
Finite difference methods (for solving partial differential equations),
are used for accurate valuation.
Moreover, the valuation must incorporate:
Volatility skew and smile effects,
Interest rate differentials (especially in FX exotics),
Time decay and path volatility, and
Counterparty credit risks.
Due to these complexities, exotic option trading is typically limited to institutional investors and quantitative traders with access to robust pricing models and computing power.
6. Strategic Applications in Markets
Exotic options play several strategic roles in modern finance:
a. Risk Management
Corporations use them to hedge specific exposures that vanilla options cannot cover efficiently. For example:
A company importing oil may use an Asian call to hedge against the average price rather than the spot price.
Exporters use barrier options to hedge currency risks only if extreme price movements occur.
b. Yield Enhancement
Investors seeking higher returns may purchase structured products embedding exotic options (like range accrual notes) that provide enhanced coupons tied to certain price conditions.
c. Speculation and Arbitrage
Traders exploit exotic options to speculate on volatility, correlations, or price ranges rather than pure direction.
For instance, digital options allow bets on whether a price will surpass a level by expiration.
d. Structured Product Design
Exotic options form the building blocks of many structured investment products—such as equity-linked notes, autocallables, and principal-protected instruments—allowing issuers to customize payoffs.
7. Advantages of Exotic Options
Customization: Can be precisely structured to match unique market views or hedge specific risks.
Cost Efficiency: Often cheaper than vanilla options offering similar exposures due to conditional triggers.
Strategic Flexibility: Allow exposure to volatility, time, or correlation rather than simple price direction.
Diversification: Multi-asset or path-based structures provide diversification benefits.
Creative Payoffs: Enable innovative investment products appealing to both retail and institutional investors.
8. Risks and Limitations
While attractive, exotic options carry significant risks:
a. Complexity Risk
The intricate payoff structures make them hard to value or understand, leading to potential mispricing.
b. Liquidity Risk
Most exotic options are over-the-counter (OTC) products, not exchange-traded, hence low liquidity and wider bid-ask spreads.
c. Counterparty Risk
Since many trades are bilateral, there is always the possibility of default by the counterparty.
d. Model Risk
Valuation depends on complex models and assumptions about volatility, correlation, and interest rates. Incorrect assumptions can lead to misestimation of fair value.
e. Regulatory and Transparency Issues
Post-2008, regulators have tightened rules around complex derivatives, requiring greater disclosure and collateralization. Yet, transparency remains limited compared to exchange-traded instruments.
9. Real-World Examples
Currency Knock-Out Options: Commonly used by multinational corporations to hedge FX exposure cost-effectively.
Asian Options in Oil Markets: Used by airlines to manage jet fuel price volatility.
Autocallable Notes: Retail structured products embedding digital and barrier options that offer enhanced coupons but risk early termination.
These examples show how exotic options have integrated into mainstream hedging and investment frameworks, providing flexibility and innovation.
10. The Future of Exotic Options
With the rise of AI, quantitative finance, and data-driven analytics, the design and pricing of exotic options are becoming increasingly sophisticated. Innovations in machine learning, stochastic volatility models, and blockchain-based smart derivatives promise to make exotic options more transparent and accessible.
However, the challenge remains balancing complexity with clarity. Regulators and financial educators are emphasizing the need for greater transparency and investor awareness to prevent misuse or misunderstanding of such instruments.
Conclusion
Exotic options represent the pinnacle of financial innovation—a class of derivatives that blend mathematics, creativity, and risk management into one. They extend beyond the simplicity of vanilla options, allowing investors to capture nuanced market scenarios, hedge complex exposures, or design innovative return profiles.
However, their sophistication also brings inherent risks—especially in valuation, liquidity, and counterparty exposure. As global markets evolve, the role of exotic options continues to expand, bridging the gap between customized investment strategies and advanced financial engineering.
In essence, understanding exotic options is not merely about mastering a financial product—it’s about appreciating how modern finance tailors risk, reward, and imagination into instruments that shape the dynamics of the global derivatives market.
The Future of Exchange Rate Dynamics in a Globalized EconomyIntroduction: Understanding Exchange Rate Dynamics
In an increasingly globalized economy, exchange rate dynamics play a pivotal role in shaping international trade, investment flows, and overall financial stability. Exchange rates—essentially the value of one currency relative to another—act as the backbone of the global economic system. They determine the competitiveness of nations, influence inflation and interest rates, and affect everything from tourism to multinational corporate profits.
As the world becomes more interconnected through trade, technology, and capital mobility, exchange rate fluctuations have grown more complex. Traditional economic fundamentals like inflation differentials and interest rates still matter, but modern factors—such as geopolitical tensions, algorithmic trading, and digital currencies—are increasingly dictating the rhythm of exchange rate movements. The future of exchange rate dynamics will therefore depend on how these evolving forces interact within an ever-shifting global landscape.
1. Historical Context: From Fixed to Floating Systems
The evolution of exchange rate systems provides critical insights into their future trajectory.
Bretton Woods Era (1944–1971): After World War II, global currencies were pegged to the US dollar, which itself was backed by gold. This system provided stability but limited flexibility for countries facing economic imbalances.
Post-1971 Floating Regime: When the US abandoned the gold standard, currencies began to “float,” meaning their values were determined by market forces. While this allowed for greater flexibility, it also introduced volatility and speculation into currency markets.
Modern Hybrid Systems: Many economies now operate under managed floats, where central banks occasionally intervene to stabilize excessive fluctuations.
The future of exchange rate dynamics is likely to involve an even more flexible yet managed structure, influenced by digital technologies, algorithmic trading, and the policies of major economic blocs.
2. The Forces Shaping Modern Exchange Rate Movements
Exchange rate movements are no longer driven solely by trade balances or interest rate differentials. Instead, they are shaped by a combination of economic, political, and technological forces.
Monetary Policies: Central banks, through their interest rate and quantitative easing decisions, continue to be major influencers of currency strength. Diverging policies between major economies—such as the US Federal Reserve, the European Central Bank, and the Bank of Japan—regularly trigger global capital shifts.
Capital Flows and Investment Sentiment: In an era of globalized finance, trillions of dollars move daily across borders seeking higher returns. These flows can rapidly appreciate or depreciate a currency, sometimes detached from underlying fundamentals.
Geopolitical Tensions: Trade wars, sanctions, and political instability can cause rapid depreciation or appreciation. The ongoing rivalry between the US and China, for example, often manifests in currency movements, with the yuan sometimes used strategically as an economic tool.
Technological and Algorithmic Trading: Artificial intelligence and high-frequency trading algorithms now dominate forex markets, executing transactions within milliseconds. These technologies can amplify volatility but also enhance market efficiency.
Commodity Price Fluctuations: For resource-dependent nations, changes in oil, gas, or metal prices can heavily influence exchange rates. For example, rising oil prices typically strengthen currencies like the Canadian dollar or the Norwegian krone.
3. Globalization and Exchange Rate Interdependence
Globalization has interwoven national economies into an intricate web of financial interdependence. Exchange rate changes in one major economy can ripple across the globe within hours.
Trade Interdependence: When a major exporter like China adjusts its exchange rate, it impacts the competitiveness of other export-driven economies.
Financial Integration: Capital markets are now more connected than ever. A policy move by the US Federal Reserve can lead to capital inflows or outflows in emerging markets within seconds.
Global Supply Chains: Exchange rate changes influence production costs, profit margins, and even the geographical decisions of manufacturing hubs.
In this interconnected world, the future of exchange rates will depend on how nations manage these linkages without sacrificing domestic economic priorities.
4. The Rise of Emerging Market Currencies
Historically, global exchange rate movements were dominated by a few key currencies: the US dollar, euro, yen, and pound sterling. However, emerging market currencies are becoming increasingly influential.
Countries such as India, Brazil, Indonesia, and Mexico are gaining global trade and investment relevance. Their currencies are also becoming more actively traded. This trend signifies a gradual multipolar shift in global currency dynamics.
The Indian Rupee: With India’s rapid economic growth and rising foreign investment, the rupee’s stability and convertibility are under continuous evolution.
The Chinese Yuan (Renminbi): Already included in the IMF’s Special Drawing Rights (SDR) basket, the yuan’s influence will likely expand as China continues internationalizing its currency through trade settlements and financial partnerships.
The future will likely see a diversified forex market where multiple regional currencies share global influence, reducing overreliance on the US dollar.
5. The Digital Transformation of Currency Markets
Digitalization is revolutionizing how exchange rates are determined and traded.
Central Bank Digital Currencies (CBDCs): More than 130 countries are exploring or developing digital versions of their currencies. CBDCs could reshape how international transactions are settled, reducing friction, improving transparency, and potentially altering exchange rate mechanisms.
Cryptocurrencies and Stablecoins: While still volatile and speculative, cryptocurrencies like Bitcoin and stablecoins pegged to fiat currencies are emerging as parallel mediums of exchange and stores of value. They could challenge traditional currency dominance in specific cross-border applications.
Blockchain and Instant Settlements: Blockchain technology enables real-time currency settlement without intermediaries, potentially making currency markets more efficient and less prone to manipulation.
In the future, digital currencies may lead to a more decentralized and transparent forex ecosystem, though regulation and cybersecurity will remain key challenges.
6. The Role of Artificial Intelligence and Big Data
Artificial intelligence (AI) and big data analytics are transforming the predictive and operational aspects of exchange rate management.
Predictive Modeling: AI systems can analyze vast datasets—ranging from macroeconomic indicators to social media sentiment—to forecast short-term currency movements with remarkable accuracy.
Risk Management: Corporations and financial institutions now use AI-based models to hedge currency exposure dynamically, adjusting positions in real time.
Central Bank Policy Design: Some central banks are adopting machine learning models to better anticipate inflation and currency pressures, enhancing their decision-making processes.
As AI-driven systems become more sophisticated, they will likely increase the precision and speed of exchange rate adjustments, though they might also amplify short-term volatility during times of stress.
7. Challenges in Managing Exchange Rate Volatility
Despite technological and institutional advancements, exchange rate volatility remains a major concern for policymakers, investors, and businesses.
Key challenges include:
Speculative Attacks: With instant global communication and high leverage, currencies can face rapid speculative pressures, especially in emerging markets.
Policy Conflicts: Countries face a “trilemma”—they cannot simultaneously maintain fixed exchange rates, free capital movement, and independent monetary policy.
Global Shocks: Events like pandemics, wars, or financial crises can cause widespread exchange rate instability, as seen during the 2008 crisis and the COVID-19 pandemic.
Inflation and Trade Imbalances: Persistent inflation differentials or large current account deficits can weaken currencies, creating long-term instability.
Future exchange rate management will thus require a balance between flexibility and stability, with central banks using both traditional and technological tools to mitigate extreme swings.
8. The Future of the U.S. Dollar’s Dominance
The US dollar currently serves as the world’s primary reserve currency, underpinning most global trade and finance. However, several trends could reshape this dominance:
Diversification by Central Banks: Many central banks are gradually reducing their dollar holdings in favor of gold, the euro, or the yuan.
Geopolitical Fragmentation: The rise of regional trade blocs and alternative payment systems (like China’s CIPS) could reduce dependence on dollar-based systems such as SWIFT.
Digital Currency Alternatives: The introduction of digital euros or yuan-based CBDCs could offer faster, cheaper settlement options for international trade.
While the dollar is likely to remain dominant in the near term due to trust, liquidity, and network effects, the long-term future points toward a multipolar currency world.
9. Sustainable Global Finance and Exchange Rates
Sustainability concerns are now influencing global economic and financial systems, including currency markets.
Green Investments: As nations pursue climate goals, capital is increasingly flowing into green assets, affecting exchange rates through capital reallocation.
Carbon Pricing and Trade: Carbon taxes and environmental regulations can alter production costs and trade competitiveness, indirectly influencing currency values.
ESG-Linked Monetary Policies: Some central banks are integrating environmental criteria into their operations, which could gradually reshape how exchange rates respond to economic policies.
The future of exchange rates may thus reflect not just financial fundamentals, but also environmental and social priorities.
10. The Road Ahead: What the Future Holds
Looking forward, the future of exchange rate dynamics in a globalized economy will be defined by adaptation and innovation.
Greater Currency Diversification: The world is moving toward a more balanced system with multiple influential currencies.
Technological Integration: AI, blockchain, and digital currencies will redefine transaction speed, transparency, and predictability.
Adaptive Policy Frameworks: Central banks will need to be more agile, using data-driven insights and flexible tools to manage volatility.
Geopolitical Realignment: Currency power will increasingly mirror global political and trade realignments, with Asia playing a central role.
Sustainability Linkages: Environmental and social factors will become embedded in long-term exchange rate assessments.
The result will be a dynamic, data-driven, and digitally interconnected currency ecosystem—one that is more complex, but also potentially more efficient and inclusive.
Conclusion
The future of exchange rate dynamics in a globalized economy is a story of transformation. Economic fundamentals will remain important, but they will be reshaped by technology, geopolitics, and sustainability imperatives. As digital currencies, AI, and cross-border innovations continue to evolve, the very nature of money and exchange will change.
In this new era, stability will depend not merely on traditional economic management but on global cooperation, technological resilience, and adaptive policymaking. The next decade will thus redefine how nations and markets perceive value, manage volatility, and maintain balance in a truly interconnected financial world.
Risks and Limitations of ETF and Index Trading1. Market Risk: The Core Challenge
ETFs and index funds are designed to track the performance of a specific index, such as the Nifty 50, S&P 500, or NASDAQ-100. This means that if the underlying market declines, the ETF or index fund will also lose value.
Example:
During the 2020 pandemic crash, the Nifty 50 ETF lost over 35% of its value in a matter of weeks. Investors holding the ETF had no protection against this decline because ETFs are market-linked instruments.
Key takeaway:
ETFs are not immune to market downturns. While diversification helps reduce company-specific risks, systemic or market-wide risks cannot be avoided.
2. Tracking Error Risk
One of the most important limitations of ETFs and index funds is tracking error—the difference between the ETF’s performance and its benchmark index.
Causes of tracking error include:
Management fees: Even a 0.2% expense ratio can add up over time.
Dividends and cash holdings: If the ETF manager holds cash instead of being fully invested, returns will lag.
Rebalancing frequency: Delays or inefficiencies in adjusting to index changes can cause mismatches.
Transaction costs: Buying and selling underlying assets incur brokerage and spread costs.
Impact:
For instance, if the Nifty 50 gives a 10% return in a year but the ETF delivers only 9.6%, the 0.4% difference represents a tracking error.
Investor note:
While small tracking errors are normal, persistent or large deviations indicate poor fund management or structural inefficiencies.
3. Liquidity Risk
Liquidity plays a vital role in ETF and index trading. It refers to how easily you can buy or sell an ETF without significantly affecting its price.
Types of liquidity:
Primary liquidity: Based on the liquidity of the underlying securities.
Secondary liquidity: Based on the trading volume of the ETF itself.
The risk:
Some ETFs, especially thematic or sectoral ones, have low trading volumes. This means:
Wider bid-ask spreads.
Price gaps between the ETF and its net asset value (NAV).
Difficulty exiting positions during market stress.
Example:
During volatile market conditions, ETFs linked to small-cap indices or niche sectors may see spreads widen sharply, leading to losses even when the underlying index hasn’t fallen as much.
4. Counterparty Risk in Synthetic ETFs
Certain ETFs—known as synthetic ETFs—do not hold the actual securities of the index. Instead, they use derivatives (like swaps) to replicate performance. This introduces counterparty risk, meaning if the derivative provider defaults, investors may face losses.
Example:
If a European bank issues a swap-based ETF on the NASDAQ-100 and later faces financial distress, the ETF might fail to deliver accurate returns, even if the U.S. index performs well.
Lesson:
Always check whether an ETF is physical (holds real securities) or synthetic (uses swaps). Physical ETFs are generally safer for long-term investors.
5. Over-Concentration in Certain Sectors or Stocks
While ETFs offer diversification, index concentration remains a key limitation. Many indices are market-cap weighted, meaning larger companies dominate performance.
Example:
In the Nifty 50, the top five companies—Reliance Industries, HDFC Bank, ICICI Bank, Infosys, and TCS—often account for over 50% of the index weight.
So, if these few companies underperform, the entire index (and related ETFs) suffers, regardless of how other constituents perform.
Implication:
Investors mistakenly believe ETFs provide balanced diversification, but in practice, they may be overexposed to a handful of large-cap stocks or sectors, such as technology or banking.
6. Limited Upside Potential
ETFs and index funds are passive investment vehicles. They mirror the index and do not attempt to outperform it. Therefore, investors miss out on potential alpha generation that skilled active fund managers might deliver.
Scenario:
If a fund manager identifies high-growth small-cap stocks before they are included in an index, active portfolios may outperform. Meanwhile, index ETFs will only benefit once the stock becomes large enough to enter the index—by which time much of the growth may already be priced in.
Key understanding:
ETFs are ideal for steady, market-level returns, not for those seeking high, alpha-driven profits.
7. Volatility and Short-Term Fluctuations
ETFs are traded intraday, just like stocks. While this provides flexibility, it also introduces short-term volatility risk.
Risks include:
Sudden price swings during high volatility periods.
Emotional trading decisions due to frequent price visibility.
Potential divergence between ETF price and actual NAV.
Example:
During sharp market corrections, ETFs can trade temporarily below their NAV as panic selling sets in—known as price dislocation. Investors who sell at such times may lock in unnecessary losses.
8. Management and Operational Risk
Despite being “passive,” ETFs are not fully automated. They require management oversight, creation and redemption processes, and operational execution.
Any failure in these processes can harm investors.
Risks include:
Error in replication: Wrong index tracking or delayed rebalancing.
System failures: Trading halts or delayed settlements.
Custodian issues: Safekeeping errors in underlying assets.
Example:
If a fund fails to rebalance after an index change (say, replacing a stock in the Nifty 50), the ETF may not accurately reflect index performance, leading to return mismatches.
9. Currency Risk in International ETFs
When investors buy international or global ETFs (such as U.S. ETFs listed in India), currency fluctuations can significantly affect returns.
Example:
If an Indian investor buys an S&P 500 ETF and the U.S. dollar weakens against the Indian rupee, the investor’s return in INR terms will decline—even if the S&P 500 index itself rises.
Key takeaway:
Investors must consider currency hedging strategies or accept that forex volatility can amplify or reduce total returns.
10. Taxation Complexity
ETF taxation depends on the asset class—equity or debt—and the jurisdiction of the fund.
Investors often underestimate how tax treatment can affect net returns.
Example (India):
Equity ETFs: Short-term capital gains (STCG) taxed at 15%, long-term at 10% (beyond ₹1 lakh).
Debt ETFs: Taxed at slab rates, with no indexation benefit after 2023 tax law changes.
This can make debt-based ETFs less tax-efficient, particularly for short-term investors.
Lesson:
Taxation is not always straightforward, especially with international ETFs that may also face withholding taxes on dividends.
11. The Illusion of Safety and Simplicity
Many investors treat ETFs as inherently “safe” because they represent diversified indices. However, ETFs can carry hidden risks, such as:
Exposure to overheated sectors.
Dependence on market sentiment.
Herd behavior leading to bubbles.
Example:
During 2021–2022, heavy inflows into technology ETFs led to inflated valuations in the NASDAQ. When tech stocks corrected, investors faced double-digit losses despite believing ETFs were low-risk instruments.
12. Structural Risks in Leveraged and Inverse ETFs
Some ETFs use leverage (2x, 3x) or inverse strategies (profit from declines). These products are meant for short-term trading, not long-term investment.
Risks include:
Compounding effect: Over time, leveraged ETFs can diverge significantly from expected returns.
Decay in value: Rebalancing daily magnifies losses in volatile markets.
Example:
A 2x leveraged ETF on the NASDAQ might gain 20% if the index rises 10% in a day. But if the index falls 10% the next day, the ETF’s loss will exceed 20%, leading to long-term erosion even if the index later recovers.
13. Systemic and Contagion Risks
ETFs have grown to represent a large portion of total market capitalization globally. Some analysts worry that ETFs could amplify systemic risks during market stress.
How it happens:
Heavy ETF redemptions can trigger mass selling of underlying assets.
Algorithmic rebalancing can worsen volatility.
Liquidity mismatches between ETFs and underlying securities can lead to market distortions.
Example:
During the March 2020 market panic, corporate bond ETFs traded at steep discounts to their NAVs, highlighting liquidity mismatches and systemic vulnerabilities.
14. Behavioral Risks: Investor Misuse
One of the less-discussed limitations of ETFs is not structural—but behavioral. Many retail investors use ETFs incorrectly:
Overtrading due to intraday availability.
Chasing momentum during bull runs.
Ignoring long-term compounding benefits by switching ETFs frequently.
Example:
An investor repeatedly switching between sectoral ETFs (banking, IT, pharma) based on short-term news may end up losing more to timing errors than they gain from diversification.
15. Regulatory and Structural Limitations
ETFs operate under specific market regulations. Sudden rule changes or restrictions can impact trading or returns.
Examples include:
Restrictions on foreign ETFs or limits on overseas investment by Indian investors.
Changes in capital gain taxation.
Trading halts due to market circuit breakers.
Such regulatory interventions, while rare, can disrupt ETF trading or temporarily distort pricing.
16. Over-Diversification and Diluted Returns
While diversification reduces risk, too much diversification can dilute returns. Index ETFs often hold hundreds of stocks, many of which contribute little to performance.
Example:
In a broad global ETF tracking 1,000+ companies, top performers’ impact gets diluted by hundreds of underperforming or stagnant ones—resulting in “average” returns.
Conclusion:
Diversification helps stability, but excessive breadth can limit meaningful gains.
Conclusion: Balancing Opportunity with Awareness
ETFs and index trading have democratized investing, providing easy access to global markets, diversified exposure, and transparent pricing. Yet, investors must remember that “simple does not mean risk-free.”
From market and tracking errors to liquidity, counterparty, and behavioral risks, each factor can impact returns differently depending on market conditions and investor behavior.
The key to success in ETF and index investing lies in understanding these risks and managing them wisely:
Choose ETFs with high liquidity and low tracking error.
Diversify across asset classes and regions—not just within one index.
Avoid leveraged or complex ETFs unless you understand their mechanics.
Stay disciplined—ETFs reward long-term consistency, not short-term speculation.
In short, ETFs and index trading are powerful tools—but like any tool, they require knowledge, caution, and strategy to use effectively.
Investors who respect these limitations and plan accordingly can enjoy stable, sustainable returns while minimizing unnecessary risks.
AI and Big Data Driving Market PredictionsIntroduction: The Rise of Data-Driven Markets
In today’s digital economy, markets are no longer just driven by human instincts, experience, or traditional financial models. Instead, they’re increasingly influenced by artificial intelligence (AI) and Big Data analytics — two powerful technologies that are reshaping how investors, institutions, and even governments understand, predict, and act in financial markets.
Every second, terabytes of data flow through global markets — from social media posts and trading volumes to corporate earnings, satellite imagery, and even weather patterns. This explosion of information is too vast for human analysts to process. That’s where AI and Big Data step in — together, they transform raw, unstructured data into actionable intelligence, allowing for faster, smarter, and more accurate market predictions.
The Data Revolution in Financial Markets
To understand the power of AI in market prediction, we must first understand the foundation it stands on — Big Data.
Financial markets generate massive volumes of data every millisecond — including:
Market data: Price movements, trading volumes, bids and asks.
Economic data: GDP growth, inflation rates, employment reports.
Alternative data: Social media sentiment, news headlines, online reviews, weather updates, and even satellite images of shipping ports.
Traditionally, analysts would rely on limited financial metrics like P/E ratios, earnings reports, or macroeconomic indicators. But Big Data allows analysts to incorporate millions of non-traditional data points, creating a far more detailed and dynamic picture of the market.
For example, an AI model can analyze millions of tweets about a company to gauge public sentiment before its earnings release. It can track credit card spending patterns to anticipate retail sales or use satellite images to estimate oil stockpiles — all in real time.
This shift has given rise to a new era of quantitative and algorithmic trading, where AI-powered systems can detect micro trends, predict price movements, and execute trades faster than any human could.
How AI Transforms Market Prediction
AI (Artificial Intelligence) acts as the “brain” that interprets and learns from Big Data. In financial markets, AI algorithms process data to identify patterns, correlations, and anomalies — and then make predictive models based on these insights. Here’s how it works:
1. Machine Learning (ML)
Machine learning enables systems to learn from past data and improve predictions over time.
For example:
Supervised learning models use historical market data (inputs) and price outcomes (outputs) to predict future price changes.
Unsupervised learning models cluster similar assets or traders based on hidden relationships in the data.
Reinforcement learning helps algorithms “learn by doing” — just like human traders testing strategies.
Through millions of iterations, these models refine themselves and make predictions with growing accuracy — predicting stock prices, volatility, or macroeconomic shifts.
2. Natural Language Processing (NLP)
Financial markets are highly sensitive to language — especially in news headlines, analyst reports, and central bank statements.
NLP allows AI to read, interpret, and quantify human language to assess market sentiment.
For example:
Detecting positive or negative tones in company news.
Monitoring Twitter or Reddit for crowd sentiment (as seen in meme stock movements like GameStop).
Parsing Federal Reserve speeches to predict interest rate decisions.
This gives traders a real-time sentiment score that influences trading decisions and market predictions.
3. Neural Networks and Deep Learning
Neural networks mimic the human brain by processing data through layers of interconnected nodes.
Deep learning models can detect highly complex, non-linear patterns that traditional models miss.
For instance, they can analyze minute-by-minute changes in trading volumes, market depth, and volatility to predict short-term price fluctuations — something essential for high-frequency trading firms.
Applications of AI and Big Data in Market Predictions
The integration of AI and Big Data isn’t theoretical — it’s already transforming multiple areas of the financial ecosystem.
1. Stock Price Forecasting
AI models analyze historical stock data alongside alternative data — like social sentiment, macroeconomic news, and global supply chain metrics — to forecast price movements.
For example, hedge funds like Renaissance Technologies or Two Sigma use AI-driven predictive models to manage billions of dollars, often outperforming traditional funds.
2. Risk Management
Predicting market trends also involves anticipating risks.
AI can detect early signs of market stress, liquidity crises, or systemic shocks by continuously monitoring thousands of variables.
It can forecast volatility spikes, credit defaults, or currency fluctuations — giving traders and institutions the foresight to manage risks proactively.
3. Algorithmic and High-Frequency Trading
AI has revolutionized algorithmic trading. Modern algorithms can execute thousands of trades per second, adjusting instantly to new information.
They analyze real-time data, predict micro-trends, and make split-second decisions that exploit even tiny inefficiencies in the market.
In fact, AI now accounts for nearly 70–80% of trading volume in developed markets like the U.S.
4. Portfolio Optimization
AI tools also help investors construct better portfolios.
They consider not only traditional financial metrics but also alternative data, market sentiment, and macroeconomic conditions to balance risk and return dynamically.
AI-driven robo-advisors like Wealthfront or Betterment use these techniques to provide personalized, automated investment strategies for retail investors.
5. Predicting Macroeconomic Trends
AI systems can forecast larger market cycles by analyzing data on global trade flows, inflation trends, commodity prices, and geopolitical news.
By recognizing long-term correlations between macro indicators and market behavior, AI can predict recessions, bull runs, or sector rotations well in advance.
6. Sentiment and Behavioral Analysis
Markets are driven by human psychology as much as numbers.
AI-powered sentiment analysis tracks the emotional tone of market participants — from optimism to panic — across millions of online conversations.
This behavioral data helps institutions anticipate potential rallies, sell-offs, or bubbles before they become visible on charts.
Big Data: The Fuel Behind AI Predictions
While AI provides the intelligence, Big Data provides the fuel.
Here’s how Big Data enhances market prediction accuracy:
1. Volume
Financial markets produce petabytes of data daily. The more data AI has, the better it can identify rare but powerful patterns that drive market movements.
2. Variety
Data isn’t limited to price charts anymore. It includes text, audio, video, geolocation, and even biometric signals.
For example, hedge funds use satellite images to count cars in retail store parking lots — predicting sales before official earnings reports.
3. Velocity
Markets move in milliseconds, so real-time data streams are crucial.
AI systems continuously ingest and analyze live feeds from exchanges, news outlets, and APIs to deliver up-to-the-second predictions.
4. Veracity
High-quality, verified data improves model reliability. Big Data systems use advanced filtering and validation to eliminate noise, fake news, or biased data sources — ensuring predictions remain credible.
Case Studies: AI and Big Data in Action
1. BlackRock’s Aladdin Platform
BlackRock’s Aladdin is a sophisticated AI and Big Data platform that monitors market conditions, analyzes risk exposures, and simulates economic scenarios.
It manages trillions in assets by identifying trends and warning fund managers about potential shocks — all through predictive analytics.
2. JPMorgan’s LOXM
JPMorgan developed LOXM, an AI-based execution algorithm that uses historical and real-time trading data to determine the best execution strategies.
It minimizes market impact and optimizes trade timing — outperforming human traders in efficiency.
3. Google and Predictive Search for Economics
Google has used search data to predict economic trends, like unemployment rates or housing demand.
By analyzing search patterns, economists and traders gain early insight into shifts in consumer behavior — long before official data releases.
Benefits of AI and Big Data in Market Predictions
Speed and Efficiency: AI can analyze millions of data points in seconds, offering instant insights.
Accuracy and Adaptability: Machine learning models continuously refine themselves with new data, improving predictive accuracy.
Reduced Human Bias: Algorithms operate purely on data, reducing emotional trading errors.
Comprehensive Insights: Integration of traditional and alternative data gives a 360° market view.
Early Warning Systems: AI can flag risks before they escalate, protecting portfolios from shocks.
Challenges and Limitations
While powerful, AI and Big Data are not without challenges.
Data Overload: Not all data is useful — filtering noise remains difficult.
Model Overfitting: AI models may perform well on historical data but fail in real-world scenarios.
Black Box Problem: Many AI systems are opaque — even developers can’t always explain why they make certain predictions.
Ethical and Regulatory Issues: The use of alternative data (like social media or geolocation) raises privacy concerns.
Market Feedback Loops: When too many traders use similar AI strategies, markets can become synchronized — leading to flash crashes.
The Future of AI-Driven Market Predictions
The future lies in combining AI, quantum computing, and decentralized data networks.
Quantum AI could process complex financial models at lightning speed, solving predictive problems beyond current capability.
Explainable AI (XAI) will make algorithms more transparent and accountable.
Federated data systems will enable firms to share insights without compromising privacy.
Moreover, as AI models become more integrated with blockchain data, they’ll bring transparency to global financial flows and improve risk forecasting in digital asset markets.
In the next decade, financial institutions won’t just use AI as a tool — they’ll become AI-driven organizations, where every investment decision, risk assessment, and strategic move is guided by intelligent algorithms trained on global data streams.
Conclusion: Data is the New Alpha
The age of intuition-based investing is rapidly giving way to an era of data-driven intelligence.
AI and Big Data have democratized predictive power — enabling not just hedge funds, but even retail traders, to forecast markets with unprecedented precision.
Yet, as powerful as these tools are, human judgment remains essential. The best results come from combining human insight with machine intelligence — intuition guided by data.
In financial markets, information has always been power.
But in today’s landscape, data — interpreted by AI — has become the ultimate competitive edge, driving the next frontier of market prediction, efficiency, and innovation.
Historical Perspective: Previous Commodity Supercycles and Their1. Understanding the Concept of Commodity Supercycles
Before diving into history, it’s important to define what a commodity supercycle is. Unlike short-term price spikes caused by supply disruptions or speculative behavior, supercycles are long-duration upward trends in commodity prices — typically lasting 20 to 30 years — driven by massive structural demand changes.
These cycles reflect the interplay between:
Industrial demand (from large-scale urbanization and industrial growth)
Supply constraints (due to underinvestment in production)
Global economic transitions (such as post-war reconstruction or technological revolutions)
During the upward phase, rapid industrialization boosts demand for raw materials like oil, copper, steel, and agricultural goods. As prices rise, producers expand capacity — often overshooting — which eventually leads to a long-term correction and a downcycle.
2. The 19th Century: The First Modern Commodity Supercycle (1815–1873)
The earliest known commodity supercycle occurred during the Industrial Revolution of the 19th century. Following the Napoleonic Wars (1803–1815), Europe entered a period of peace and rapid industrial expansion, setting the stage for the first global surge in commodity demand.
Key Triggers:
Industrialization in Britain and Western Europe:
Britain’s industrial revolution accelerated demand for coal, iron, and steel. The invention of the steam engine and expansion of railways required massive quantities of these resources.
Urbanization and Infrastructure Development:
Rapid urban growth and the construction of factories, bridges, and transportation networks fueled consumption of metals, timber, and coal.
Global Trade Expansion:
The 19th century saw an unprecedented globalization of trade, driven by colonial expansion and improvements in shipping technology. This increased both the supply and the reach of commodities.
Outcome:
From the 1820s to the 1860s, prices for key commodities such as iron, copper, and coal rose sharply. However, the cycle ended around 1873, coinciding with the Long Depression, as supply caught up with demand and economic growth slowed. Nonetheless, this period laid the foundation for modern industrial economies and global commodity markets.
3. The Early 20th Century Supercycle (1899–1939)
The next significant supercycle unfolded between 1899 and 1939, overlapping with major historical events — including World War I, the Great Depression, and the early stages of the Second Industrial Revolution.
Key Triggers:
Technological Innovations and the Second Industrial Revolution:
Advances in electricity, the internal combustion engine, and chemical manufacturing spurred enormous demand for copper (for wiring), oil (for engines), and steel (for infrastructure and weapons).
Global Urbanization and the Automobile Era:
The rise of automobiles created a new and massive demand for oil and rubber. Countries like the U.S. became both producers and consumers of these resources at unprecedented scales.
World War I (1914–1918):
The war generated extreme demand for metals, food, and energy. Governments mobilized vast industrial capacity to supply military needs, creating temporary price booms.
Post-War Reconstruction:
After the war, Europe required significant rebuilding, further pushing up commodity prices in the early 1920s.
Outcome:
The 1920s witnessed strong commodity prices, but the Great Depression (1929–1939) brought the supercycle to a crashing halt. Overproduction, financial instability, and protectionist policies caused global trade to collapse, sending prices plummeting. This cycle demonstrated how financial crises and overcapacity could abruptly end periods of prosperity.
4. The Post-World War II Supercycle (1946–1973)
After the devastation of World War II, the world embarked on a massive phase of reconstruction and modernization, which fueled one of the most well-documented commodity supercycles.
Key Triggers:
Post-War Reconstruction (Marshall Plan):
Europe and Japan undertook extensive rebuilding efforts financed by the United States through the Marshall Plan (1948–1952). This drove global demand for steel, cement, copper, and machinery.
The Rise of Consumer Economies:
The mid-20th century saw the emergence of middle-class consumption in Western economies. Automobiles, housing, and appliances required vast amounts of raw materials and energy.
Decolonization and Global Integration:
Newly independent nations began industrializing, expanding agricultural and mining activities, and increasing trade participation.
Oil Demand and Energy Expansion:
The oil industry experienced explosive growth during this period. Petroleum became the lifeblood of modern economies, fueling transport, industry, and electricity generation.
Outcome:
This supercycle peaked in the early 1970s, when strong global growth and tight oil supply culminated in the 1973 Oil Crisis. The OPEC oil embargo sent prices skyrocketing, marking both the climax and the collapse of the post-war boom. The subsequent stagflation of the late 1970s and early 1980s signaled the end of this cycle. Yet, it transformed the global energy landscape and established oil as the most strategically vital commodity.
5. The 2000s Supercycle: The China-Led Boom (2000–2014)
The most recent and perhaps most influential supercycle in modern memory began around 2000 and lasted until roughly 2014. It was primarily driven by the rapid industrialization and urbanization of China, along with strong growth across emerging markets.
Key Triggers:
China’s Industrial Expansion:
China’s entry into the World Trade Organization (WTO) in 2001 catalyzed a historic wave of manufacturing and infrastructure investment. The country became the world’s largest consumer of steel, copper, coal, and cement.
Urbanization Across Emerging Economies:
Beyond China, countries like India, Brazil, and Indonesia experienced rising urbanization, boosting demand for construction materials and energy.
Financialization of Commodities:
The early 2000s saw increased investor participation in commodity markets through ETFs and futures. Commodities became a mainstream asset class, amplifying price movements.
Energy Demand and the Rise of Oil Prices:
Oil prices surged from around $20 per barrel in 2000 to over $140 per barrel in 2008, driven by strong global demand and geopolitical tensions in the Middle East.
Underinvestment in Supply:
The previous two decades of low commodity prices had discouraged exploration and investment. When demand spiked, supply was unable to keep pace, intensifying the price surge.
Outcome:
The 2008 Global Financial Crisis temporarily interrupted the supercycle, but prices rebounded quickly due to China’s massive stimulus package and infrastructure spending. However, by 2014, oversupply — especially in oil and metals — combined with slowing Chinese growth, ended the cycle. This period reshaped the global commodity market, making China the central player in global demand dynamics.
6. Common Triggers and Patterns Across Supercycles
While each supercycle is unique, historical analysis reveals recurring themes and triggers:
Industrialization and Urbanization:
Every major supercycle coincided with rapid industrial expansion — whether in 19th-century Europe, post-war America, or 21st-century China.
Technological Transformation:
Breakthroughs like steam power, electricity, and automobiles dramatically shifted commodity usage and demand profiles.
Demographic and Economic Expansion:
Population growth and income rises fuel demand for housing, transport, and consumer goods — all resource-intensive sectors.
Supply Lag and Investment Cycles:
Commodity supply responds slowly due to long project lead times in mining, energy, and agriculture. This delay amplifies the effects of demand surges.
Geopolitical and Military Events:
Wars, embargoes, and trade disruptions often accelerate price booms by constraining supply and increasing uncertainty.
Financialization and Speculation:
In modern times, increased participation by institutional investors has made commodity markets more sensitive to financial sentiment.
7. Lessons from Historical Supercycles
A. The Role of Structural Demand Shifts
Sustained demand growth — not temporary shocks — is essential for a true supercycle. Industrial revolutions and global reconstruction phases have consistently been the key demand drivers.
B. The Danger of Overinvestment
Each boom phase has historically been followed by a glut as producers overexpand capacity. This overinvestment eventually depresses prices and leads to prolonged downturns.
C. The Importance of Policy and Global Coordination
Government policy, trade agreements, and geopolitical stability can either extend or shorten a supercycle. For example, the Bretton Woods system and post-war cooperation helped sustain the 1950s–1970s boom.
D. The Cyclical Nature of Commodities
Despite new technologies and financial instruments, the commodity market remains inherently cyclical. Prices eventually revert as supply catches up and demand matures.
8. Could We Be Entering a New Supercycle?
Many analysts argue that the 2020s could mark the beginning of a new commodity supercycle, driven by factors reminiscent of past booms but adapted to modern realities:
Green Energy Transition: Demand for lithium, copper, nickel, and rare earth elements is soaring due to renewable energy technologies and electric vehicles.
Infrastructure Stimulus: Governments worldwide are investing heavily in post-pandemic recovery and infrastructure modernization.
Supply Constraints: Years of underinvestment in mining and oil exploration could limit supply just as demand accelerates.
Geopolitical Realignments: Conflicts, trade tensions, and resource nationalism are reshaping supply chains and commodity flows.
If history is a guide, the combination of these structural forces suggests that another long-term uptrend in commodities may be emerging — though, as always, the balance between supply and demand will ultimately determine its longevity.
Conclusion
The history of commodity supercycles is, in essence, the story of human progress — from steam engines to skyscrapers, from oil booms to electric revolutions. Each supercycle reflects a period when global society undergoes transformative change, demanding vast quantities of raw materials to fuel development.
From the 19th-century Industrial Revolution to the China-led boom of the early 21st century, the triggers have remained consistent: industrial growth, technological innovation, and demographic expansion. Yet, each cycle has also taught hard lessons about overproduction, economic imbalance, and the limits of natural resources.
As the world moves toward a low-carbon, technology-driven future, the next supercycle may look very different — centered around green commodities and sustainable growth — but it will still be governed by the same fundamental forces that have shaped markets for over two centuries.
The Booming Era of the Trading Market1. The Evolution of Trading: From Open Outcry to Algorithmic Intelligence
The trading market has evolved far beyond its traditional roots. A few decades ago, stock trading primarily occurred in noisy exchange floors where traders used hand signals and shouted bids and offers — the famous “open outcry” system. Today, most of the trading volume globally is executed electronically within milliseconds.
Digital transformation has been the key catalyst. With the introduction of online brokerage platforms in the early 2000s and the integration of high-speed internet, trading became faster, cheaper, and more transparent. Now, with the advent of algorithmic and AI-based trading, markets operate almost continuously with unmatched precision.
Moreover, retail traders — ordinary individuals — have entered the scene in unprecedented numbers. Armed with smartphones, access to real-time data, and social platforms like X (formerly Twitter), YouTube, and Reddit, retail investors are influencing trends once dominated by institutional giants.
This shift marks a true democratization of financial markets, setting the foundation for this booming era.
2. The Expansion of Global Participation
One of the defining traits of today’s trading boom is the global participation in markets. Millions of new investors from India, Southeast Asia, Africa, and Latin America have joined global financial systems.
For instance, India’s stock market participation has witnessed an explosion in the last five years — with Demat accounts surpassing 150 million, and daily trading volumes hitting record highs across exchanges like NSE and BSE. The United States continues to lead in global liquidity, but emerging markets are becoming hotbeds of new capital and innovation.
This participation is driven by a few major factors:
Financial Literacy & Awareness: Global campaigns, social media, and financial influencers have simplified complex trading concepts.
Ease of Access: Mobile-based apps like Zerodha, Robinhood, and eToro have removed barriers to entry.
Low Brokerage Costs: Zero-commission trading has opened doors for small investors.
Global Connectivity: Investors can now trade U.S. stocks from India or crypto assets from anywhere in the world.
This democratization means that the markets are no longer controlled by a few — they reflect the collective psychology of millions of investors worldwide.
3. The Technology Revolution: AI, Blockchain, and Beyond
Technology is the engine that drives the modern trading market. Over the past decade, artificial intelligence (AI) and machine learning (ML) have fundamentally changed how trades are executed, analyzed, and managed.
AI-powered systems can now scan market data, detect hidden patterns, and predict short-term movements far faster than human traders. These tools have increased efficiency, liquidity, and accuracy — but they’ve also created new challenges in terms of volatility and fairness.
Simultaneously, blockchain technology has introduced decentralized trading — most notably through cryptocurrencies and tokenized assets. Decentralized exchanges (DEXs) like Uniswap and PancakeSwap allow peer-to-peer trading without intermediaries, reflecting a shift toward transparent, open systems.
Automation, cloud computing, and real-time analytics have made it possible for retail traders to use advanced tools once reserved for hedge funds. As a result, today’s markets are more interconnected, data-driven, and intelligent than ever before.
4. The Rise of Retail Investors
Perhaps no force has been as transformative in this boom as the rise of retail investors. The pandemic years (2020–2022) served as a turning point — when millions of individuals began trading from home, often encouraged by stimulus measures, social media discussions, and free time during lockdowns.
Retail traders now account for a significant share of daily trading volume in markets like India, the U.S., and China. Platforms like Zerodha, Groww, and Upstox in India, and Robinhood in the U.S., have completely changed the investment landscape.
Retail investors’ growing influence has made markets more sentiment-driven, leading to rapid movements around trending stocks, meme stocks, and thematic investments like EVs, renewable energy, and AI-driven companies.
This retail revolution has reshaped market psychology — adding new layers of momentum, emotion, and community-driven trading.
5. The Rise of Alternative Assets
Another hallmark of the booming trading era is the diversification of investment instruments. Beyond equities, traders now have access to derivatives, commodities, forex, ETFs, mutual funds, cryptocurrencies, and even tokenized real estate.
These diverse instruments have broadened both risk and opportunity:
Cryptocurrencies: Digital assets like Bitcoin and Ethereum have become global trading instruments, influencing investor sentiment and institutional strategy alike.
Commodities: The post-pandemic period has revived interest in gold, oil, and agricultural products as inflation hedges.
Derivatives and Options: Retail interest in options and futures has surged due to the potential for quick profits and hedging flexibility.
Exchange-Traded Funds (ETFs): ETFs have made it easier for retail investors to access diversified portfolios with a single click.
This diversification has made markets more resilient but also more interconnected — meaning that movements in one segment (say crypto) can ripple through global equities or commodities.
6. The Policy and Regulatory Environment
A booming trading market also depends on a strong regulatory foundation. Governments and central banks have taken crucial steps to stabilize markets and encourage participation, especially after crises like the 2008 financial meltdown and the COVID-19 shock.
Regulators such as the SEBI (India), SEC (U.S.), and ESMA (Europe) are actively implementing frameworks for investor protection, transparency, and fair market practices. Meanwhile, new policies on digital assets, ESG investing, and data security are shaping the future of financial ecosystems.
At the same time, monetary policies — including low-interest environments and liquidity infusions — have historically fueled market expansions. However, as inflation and rate hikes reemerge, markets are learning to balance growth with caution.
The ability of policymakers to maintain equilibrium between innovation and regulation will determine how sustainable this boom truly is.
7. The Impact of Globalization and Interconnected Economies
In the 21st century, no market exists in isolation. Events in one part of the world — a rate hike in the U.S., a geopolitical tension in the Middle East, or a policy shift in China — can ripple instantly across continents.
This interconnectedness has turned global markets into a web of opportunity and risk. For traders, this means constant vigilance, as currencies, commodities, and equity indices now move in tandem more than ever.
Global trade agreements, digital payment systems, and cross-border platforms are strengthening this integration further. The result is a world where capital moves freely, and traders can access opportunities that were once geographically limited.
8. Behavioral Shifts: From Long-Term Investing to Active Trading
Investor behavior has evolved dramatically in the booming trading era. Earlier generations preferred long-term investing — holding blue-chip stocks or mutual funds for decades. Today’s traders are far more active, agile, and data-driven.
With real-time price updates, social media-driven narratives, and algorithmic strategies, short-term trading has gained immense popularity. Swing trading, scalping, and intraday strategies now dominate daily volumes.
This shift reflects a generational change — where financial markets are viewed not just as wealth creators but as dynamic ecosystems for daily income, learning, and community participation.
However, this hyperactive behavior also increases exposure to volatility and emotional decision-making — making education and discipline more vital than ever.
9. Emerging Markets: The Next Growth Frontier
Emerging markets, especially in Asia and Africa, are leading this trading revolution. India, in particular, has become one of the fastest-growing equity markets globally, with record-breaking IPOs, SME listings, and FII inflows.
Countries like Vietnam, Indonesia, and Nigeria are also seeing surges in retail participation and fintech innovation. As domestic consumption rises and economies digitalize, local capital markets are set to play a larger role in global wealth creation.
This regional diversification ensures that the trading boom is not limited to Wall Street or London, but is instead becoming a truly global phenomenon.
10. Challenges and Risks in the Booming Market
Despite the optimism, the booming era of trading is not without challenges. The very factors driving growth — speed, technology, and retail participation — also introduce new risks.
Key concerns include:
Volatility: Rapid movements can lead to flash crashes or panic-driven selloffs.
Speculation: Over-leveraged traders often face severe losses.
Cybersecurity: As more trading shifts online, data breaches and scams rise.
Regulatory Gaps: Fast innovation sometimes outpaces regulation, especially in crypto and AI trading.
The sustainability of the boom depends on balancing enthusiasm with prudence — ensuring that innovation does not lead to instability.
11. The Future Outlook: Intelligent, Inclusive, and Sustainable
Looking ahead, the trading market’s next chapter will likely be defined by intelligence, inclusion, and sustainability.
Intelligent Trading: AI, predictive analytics, and quantum computing will refine strategies and risk management.
Inclusive Growth: Financial inclusion will deepen as more people gain access to low-cost trading and investment tools.
Sustainable Finance: ESG investing, green bonds, and socially responsible portfolios will shape investor preferences.
Markets will increasingly reflect not only financial goals but also societal and environmental consciousness. As technology advances and access broadens, the line between traditional investing and modern trading will continue to blur.
Conclusion: The Golden Age of Global Trading
The current era marks a golden age of trading — one where technology, innovation, and participation are converging to create limitless possibilities. From Wall Street to Dalal Street, from cryptocurrencies to commodities, markets are more alive and dynamic than ever.
This boom is not merely a product of capital flows; it is a reflection of human ambition, digital transformation, and the universal desire for financial empowerment.
However, sustaining this growth will depend on balance — between innovation and regulation, risk and reward, speed and stability.
If guided wisely, the booming era of trading will not only create wealth but also redefine the global financial landscape for decades to come.

Understanding Reserve Currency and Its Global RoleIntroduction: The Foundation of Global Financial Stability
In the intricate web of international finance, few concepts hold as much influence as the reserve currency. It is the lifeblood of global trade, the benchmark for economic stability, and a powerful symbol of national economic strength. A reserve currency is not merely a means of exchange—it is a cornerstone of global confidence. Countries around the world hold large quantities of certain currencies in their foreign exchange reserves to manage international trade, stabilize their domestic currencies, and meet external obligations.
Today, the U.S. dollar stands as the dominant reserve currency, though history has witnessed transitions—from the British pound sterling’s supremacy during the 19th and early 20th centuries to the dollar’s reign after World War II. However, with the world moving toward a multipolar economic system and technological innovations such as digital currencies reshaping finance, the concept and dominance of reserve currencies are being re-examined.
What Is a Reserve Currency?
A reserve currency is a foreign currency held by central banks and major financial institutions as part of their foreign exchange reserves. It is used to settle international transactions, influence exchange rates, and maintain financial stability. When a nation imports goods or services, settles debt, or intervenes in the forex market, it often uses a globally accepted currency like the U.S. dollar or the euro.
In simpler terms, it’s the currency other countries trust enough to use for global trade and as a store of value. A reserve currency must be stable, liquid (easy to buy and sell), and backed by a strong and credible economy.
Key examples of reserve currencies today include:
U.S. Dollar (USD)
Euro (EUR)
Japanese Yen (JPY)
British Pound Sterling (GBP)
Chinese Yuan (CNY) (gradually increasing in share)
Historical Evolution of Reserve Currencies
The evolution of reserve currencies mirrors global power shifts:
The British Pound Era (19th Century to Early 20th Century):
During the 1800s, the British Empire was at the height of its global influence. The pound sterling, backed by the gold standard and the vast colonial trade network, became the world’s primary reserve currency. It was trusted for its convertibility and Britain’s robust financial system.
The U.S. Dollar Ascendancy (Post-World War II):
After World War II, the Bretton Woods Agreement (1944) established the U.S. dollar as the central pillar of the global monetary system. The dollar was pegged to gold, and other currencies were pegged to the dollar. The U.S. economy’s post-war strength and stability made the dollar the most reliable global asset.
The End of the Gold Standard (1971):
In 1971, President Richard Nixon ended the dollar’s convertibility into gold—creating the modern fiat currency system. Despite this, the dollar maintained its dominance due to the size of the U.S. economy, military power, and the global acceptance of dollar-denominated assets such as U.S. Treasury bonds.
Emerging Competition (21st Century):
Over the past two decades, the euro and Chinese yuan have made gradual gains. However, no currency has yet displaced the dollar’s dominance, which remains unmatched in terms of global liquidity, trust, and network effects.
Why Reserve Currencies Matter
A reserve currency serves multiple purposes in global economics:
Facilitating International Trade:
Global trade is mostly conducted in reserve currencies. For instance, commodities like oil and gold are priced in U.S. dollars. This common currency standard simplifies transactions between countries and reduces exchange rate risk.
Store of Value for Central Banks:
Central banks hold reserve currencies to safeguard their economies from volatility. These reserves act as a financial cushion during crises—allowing countries to stabilize their currencies or pay for imports when domestic conditions are unstable.
Debt and Investment:
Governments and corporations issue bonds in reserve currencies, attracting global investors. This access to global capital reduces borrowing costs for countries whose currencies are considered stable.
Influence and Power Projection:
The nation issuing a reserve currency gains significant geopolitical leverage. The U.S., for example, can impose financial sanctions effectively because global trade and finance depend on dollar transactions.
The U.S. Dollar: The Reigning Reserve Currency
As of 2025, the U.S. dollar accounts for roughly 58–60% of global foreign exchange reserves, according to the International Monetary Fund (IMF). This dominance stems from several key factors:
Economic Strength:
The United States has the world’s largest economy, making the dollar a natural choice for trade and investment.
Deep and Liquid Financial Markets:
U.S. Treasury bonds are considered among the safest and most liquid assets in the world. Central banks and investors can buy and sell them easily, which increases confidence in the dollar.
Network Effect:
The more widely the dollar is used, the more attractive it becomes. This creates a self-reinforcing cycle that cements its dominance.
Military and Political Stability:
The U.S. government’s stability and global influence enhance trust in its currency, even in times of global uncertainty.
However, this dominance is not without challenges. The dollar’s centrality means that U.S. monetary policy—such as interest rate changes by the Federal Reserve—has global ripple effects, impacting borrowing costs, inflation, and trade balances worldwide.
The Euro and Other Contenders
The euro, introduced in 1999, was designed to rival the dollar’s supremacy. It represents a large economic bloc with a strong regulatory framework and deep capital markets. However, internal divisions among European Union members and debt crises in the region have limited its rise.
The Japanese yen and British pound remain important but secondary reserve currencies. Meanwhile, the Chinese yuan (renminbi) is gradually growing in use—thanks to China’s massive trade network and initiatives like the Belt and Road Initiative and the Asian Infrastructure Investment Bank (AIIB).
However, the yuan’s international acceptance is still constrained by capital controls, lack of full convertibility, and limited transparency in China’s financial markets.
Benefits for a Reserve Currency Issuing Nation
Holding the world’s reserve currency provides significant advantages to the issuing country:
Lower Borrowing Costs:
Global demand for U.S. Treasury securities allows the U.S. government to borrow at lower interest rates.
Trade Advantages:
The U.S. can purchase imports using its own currency, essentially creating demand for its dollars without needing foreign reserves.
Geopolitical Power:
The ability to impose sanctions, freeze assets, or cut off nations from the global dollar-based system gives the U.S. extraordinary influence in international affairs.
Financial Stability:
During crises, global investors often seek safety in dollar assets, reinforcing the U.S. financial system’s resilience.
Challenges and Criticisms of Reserve Currency Dominance
While being a reserve currency issuer has benefits, it also brings challenges:
The Triffin Dilemma:
Economist Robert Triffin highlighted that to supply the world with dollars, the U.S. must run trade deficits—exporting more dollars than it imports. However, persistent deficits can undermine confidence in the dollar’s long-term value.
Global Dependence on U.S. Policy:
When the Federal Reserve raises interest rates, capital often flows from emerging markets to the U.S., causing volatility and currency depreciation in those countries.
Weaponization of Finance:
The U.S. has increasingly used its control over the dollar-based system for sanctions. While effective politically, this has prompted other nations to seek alternative payment systems.
Emerging De-Dollarization Efforts:
Countries like China, Russia, and members of BRICS are actively exploring ways to reduce dependence on the U.S. dollar—such as bilateral trade in local currencies or creating shared digital currency systems.
The Rise of “De-Dollarization”
“De-dollarization” refers to the global movement to reduce reliance on the U.S. dollar for trade, finance, and reserves. This trend gained momentum after the U.S. imposed sweeping sanctions on Russia in 2022, freezing its dollar assets. In response, several nations began exploring alternative systems.
China and Russia have increased trade settlements in yuan and rubles.
India has initiated rupee-based trade mechanisms with select partners.
BRICS countries are discussing a potential common currency for trade and investment.
While these moves indicate gradual diversification, replacing the dollar entirely remains highly challenging due to its entrenched role in global finance and the lack of a fully equivalent alternative.
Digital Currencies and the Future of Reserve Systems
The next chapter in global currency evolution may be shaped by digital innovation. Central Bank Digital Currencies (CBDCs)—such as China’s Digital Yuan (e-CNY) and the potential Digital Euro—are being explored as tools for more efficient cross-border settlements.
These digital versions of national currencies could challenge traditional reserve systems by enabling direct international payments without intermediaries like SWIFT. If widely adopted, they could gradually reduce the dominance of traditional reserve currencies.
However, for digital currencies to serve as global reserves, they must ensure stability, convertibility, and global trust—conditions that currently remain under development.
A Multipolar Reserve Currency World
The global economy is slowly moving toward multipolarity, where several currencies share reserve roles instead of one dominant currency. This could enhance global stability by reducing overreliance on a single nation’s policies.
In such a system:
The U.S. dollar may remain dominant but with reduced share.
The euro and yuan could gain influence in regional trade.
Digital and commodity-backed currencies may emerge as alternative reserves.
However, such a transition would require decades of trust-building, regulatory cooperation, and geopolitical stability.
Conclusion: The Future of Global Monetary Balance
The concept of a reserve currency lies at the heart of global financial order. From the pound sterling’s imperial dominance to the U.S. dollar’s current reign, it has always reflected economic might, trust, and political influence.
Today, as globalization deepens and digital transformation accelerates, the future of reserve currencies may evolve beyond traditional boundaries. While the dollar’s supremacy remains intact for now, the push toward diversification, regional alternatives, and digital finance signals the dawn of a more balanced, interconnected, and resilient global monetary system.
The coming decades may not witness the fall of the dollar—but rather the rise of a more pluralistic reserve world, where power is shared, trust is distributed, and financial sovereignty becomes more evenly spread across nations.

Understanding Currency Derivatives: The Basics ExplainedIntroduction: The Global Dance of Currencies
In today’s interconnected world, where goods, services, and capital flow across borders in milliseconds, currencies have become the lifeblood of global commerce. Yet, the value of currencies doesn’t stand still — it moves constantly due to economic events, interest rate decisions, inflation data, and geopolitical developments.
For multinational corporations, importers, exporters, investors, and even governments, this constant movement brings both opportunity and risk. A small change in exchange rates can dramatically affect profits, pricing, and competitiveness. To manage this uncertainty, financial markets offer powerful instruments known as currency derivatives — contracts whose value is derived from underlying currencies or currency pairs.
Currency derivatives allow market participants to hedge against currency risk, speculate on currency movements, or even arbitrage price differences between markets. Whether you’re a trader on Dalal Street or a treasurer at an export company, understanding currency derivatives is essential for navigating the modern financial ecosystem.
1. What Are Currency Derivatives?
A currency derivative is a financial contract whose value depends on the exchange rate of one currency relative to another.
For instance, if you agree to buy US dollars (USD) against Indian rupees (INR) at a future date, the value of that contract will rise or fall depending on how the USD/INR exchange rate moves.
In simpler terms:
Currency derivatives are tools used to lock in, speculate on, or manage exposure to future movements in foreign exchange rates.
They are widely used in foreign exchange markets (Forex), which are among the largest and most liquid markets in the world — with over $7 trillion traded daily, according to BIS (Bank for International Settlements) data.
2. Why Are Currency Derivatives Needed?
Currency values fluctuate due to a range of factors:
Changes in interest rates
Inflation differentials between countries
Trade balances and current account deficits
Political instability or economic data releases
Central bank policies
These movements can pose serious challenges for:
Exporters, who receive payments in foreign currency but have domestic expenses
Importers, who need to pay foreign suppliers in other currencies
Investors, who hold foreign assets
Travelers or students abroad, who are exposed to exchange rate swings
Let’s take an example:
An Indian exporter signs a deal to sell software to a U.S. company for $1 million, payment due in three months. If the current USD/INR rate is ₹83, the expected receipt is ₹8.3 crore.
But if the rupee strengthens to ₹81 in three months, the exporter would receive only ₹8.1 crore — losing ₹20 lakh due to exchange rate fluctuation.
To avoid such losses, the exporter can enter into a currency derivative contract to lock the exchange rate at ₹83, securing profits and eliminating uncertainty.
3. Types of Currency Derivatives
Currency derivatives come in several forms, each with distinct characteristics, uses, and risk profiles. The four most common types are:
A. Currency Futures
A currency future is a standardized contract traded on an exchange (like NSE or BSE in India) to buy or sell a specific amount of currency at a fixed exchange rate on a specified future date.
Key features:
Traded on regulated exchanges
Standardized contract size (e.g., $1,000 or $10,000 per lot)
Daily mark-to-market settlement
Requires a margin deposit
Example:
An importer expects to pay $100,000 to a U.S. supplier in one month. To hedge against a possible rise in USD/INR, they can buy USD-INR futures. If the dollar strengthens, the profit from the futures position offsets the higher cost of payment.
Advantages: Transparent, regulated, and liquid.
Disadvantages: Less flexible than forwards (due to fixed contract sizes and dates).
B. Currency Forwards
A currency forward is a customized over-the-counter (OTC) contract between two parties to buy or sell a currency at a pre-agreed rate on a specific future date.
Example:
An Indian importer and a bank agree to buy $1 million in 90 days at ₹83.5 per dollar. No money changes hands until the settlement date.
Key characteristics:
Customized contract (amount, date, rate can all be negotiated)
Not traded on exchange (OTC)
Carry counterparty risk (since one party could default)
Advantages: High flexibility and tailored to business needs.
Disadvantages: Lack of transparency and potential credit risk.
C. Currency Options
A currency option gives the holder the right, but not the obligation, to buy or sell a currency at a predetermined exchange rate on or before a specific date.
Types:
Call option: Right to buy a currency.
Put option: Right to sell a currency.
Example:
An exporter can buy a USD-INR put option (right to sell USD) to protect against a falling dollar. If the rupee appreciates, the option’s value increases; if not, the exporter can simply let it expire.
Advantages:
Flexibility — no obligation to exercise.
Limited downside risk (premium paid).
Disadvantages:
Options require upfront premium payment.
D. Currency Swaps
A currency swap involves two parties exchanging principal and interest payments in different currencies.
Example:
An Indian company borrowing in USD but needing INR cash flow can swap its dollar liability for a rupee-based one with another firm.
Purpose:
Manage currency and interest rate exposure
Obtain cheaper financing
Hedge long-term liabilities
Swaps are typically used by large corporations or institutions rather than small traders.
4. How Currency Derivatives Are Traded in India
In India, currency derivatives are actively traded on major exchanges such as:
NSE (National Stock Exchange)
BSE (Bombay Stock Exchange)
MCX-SX (Multi Commodity Exchange – Stock Exchange)
Commonly traded pairs:
USD/INR
EUR/INR
GBP/INR
JPY/INR
Lot sizes: Usually standardized — for example, 1 lot = $1,000 in USD-INR futures.
Trading hours: Typically from 9:00 AM to 5:00 PM (IST).
Participants include:
Hedgers: Exporters, importers, investors, and corporates.
Speculators: Traders betting on currency movements.
Arbitrageurs: Those exploiting price differences between spot and futures markets.
5. The Role of RBI and SEBI
Currency derivatives in India are tightly regulated to maintain market integrity.
RBI (Reserve Bank of India) oversees currency policies, authorized participants, and foreign exchange risk management guidelines.
SEBI (Securities and Exchange Board of India) regulates exchange-traded currency derivatives, ensuring transparency and investor protection.
Key regulations include:
Limits on open positions (to prevent speculation overload)
Margin requirements for traders
Daily price bands to avoid excessive volatility
This ensures a stable, liquid, and transparent marketplace.
6. How Currency Derivatives Help Different Market Participants
A. Exporters and Importers
They use derivatives to hedge currency risk and protect profit margins.
For example, exporters hedge against rupee appreciation, while importers hedge against rupee depreciation.
B. Corporates and Institutions
They manage cross-border financing, loans, and foreign investments through swaps and forwards.
C. Traders and Speculators
They take positions based on expected market movements, profiting from short-term volatility.
D. Arbitrageurs
They exploit pricing discrepancies between spot, forward, and futures markets for risk-free profits.
7. Benefits of Currency Derivatives
Risk Management: Protects against adverse currency movements.
Price Discovery: Futures markets reveal expectations about future exchange rates.
Liquidity: Exchange-traded derivatives offer easy entry and exit.
Leverage: Small margin can control large positions.
Transparency and Regulation: Exchange-traded contracts ensure fair play.
8. Risks and Limitations
While currency derivatives offer many advantages, they also carry risks:
A. Market Risk
Unexpected exchange rate movements can lead to losses, especially for speculative positions.
B. Leverage Risk
Small price changes can cause large gains or losses due to leverage.
C. Counterparty Risk
In OTC contracts, one party may default on obligations.
D. Liquidity Risk
In less-traded pairs or contracts, exiting a position may be difficult.
E. Operational and Regulatory Risk
Complex documentation, errors, or regulatory changes can affect derivative positions.
Thus, derivatives demand sound understanding, discipline, and proper risk controls.
9. Practical Example: Hedging an Importer’s Exposure
Let’s take a practical case:
An Indian importer must pay $500,000 to a U.S. supplier in three months.
Current USD/INR = ₹83.00
Concern: The rupee may depreciate (USD may rise) to ₹85.
Solution:
Importer buys USD-INR futures at ₹83.00.
If USD/INR rises to ₹85:
The importer pays more rupees in the spot market.
But gains ₹2 per dollar on the futures position → ₹10 lakh profit.
This offsets the extra rupee cost — a perfect hedge.
10. Global Perspective on Currency Derivatives
Globally, currency derivatives play a massive role in financial markets. The Chicago Mercantile Exchange (CME), Euronext, and Singapore Exchange (SGX) are major platforms.
Emerging markets like India have also witnessed strong growth due to increasing foreign trade, global investment flows, and the rise of retail participation.
Trends shaping the future:
Digital platforms and algorithmic trading
Blockchain-based settlement systems
Expansion into exotic currency pairs
Greater participation by SMEs and startups for hedging
11. How to Get Started with Currency Derivatives Trading
For individuals or businesses in India:
Open a trading and DEMAT account with a registered broker (enabled for currency segments).
Understand contract specifications (lot size, tick value, expiry date).
Deposit margins as per exchange norms.
Study market fundamentals — interest rates, global data, and central bank actions.
Start small and maintain strict stop-loss levels.
Remember — derivatives amplify both gains and losses. So, use them strategically, primarily for hedging, not uncontrolled speculation.
12. The Future of Currency Derivatives in India
With India’s global trade volumes expanding and the rupee becoming increasingly relevant in international settlements, the currency derivatives market is poised for strong growth.
The RBI’s move to allow rupee-settled trade and internationalization of INR could further deepen the market. Also, the inclusion of more currency pairs and products (like cross-currency options) will provide more flexibility for hedging.
Moreover, with digital adoption and algorithmic tools, even retail traders can now access real-time forex data, execute trades swiftly, and manage risk efficiently.
Conclusion: Empowering Global Financial Stability
Currency derivatives are not just speculative instruments — they are the foundation of global financial stability. They empower businesses to plan better, reduce uncertainty, and maintain profit stability in a volatile world.
Whether you’re an exporter in Mumbai, a fund manager in London, or a trader in Singapore, currency derivatives offer the means to navigate the dynamic world of exchange rates safely and efficiently.
As the world continues to globalize, and India’s role in global trade expands, understanding and effectively using currency derivatives will become not just useful — but essential.
If You're Not Just Hearing About Options —But Actually Diving InYou’ve moved beyond indicators and noise.
You’re stepping into the world where smart money operates.
Because options are not just tools for betting.
They’re a mirror of institutional intent — of hedges, positioning, and hidden signals.
And if you learn to listen to this market, you gain a real edge — even if you never trade an option yourself.
You’ll see what’s coming on spot Forex, gold, or indices — before the crowd notices anything.
This isn’t theory from a textbook.
It’s a practical guide forged from over 5 years of daily analysis of CME reports, exchange data, and real-world observation.
Let’s break it down — step by step.
🔍 Step 1: Can You Identify the Player by Option Delta?
Yes — and it starts with understanding delta.
Delta = Sensitivity of an option’s price to changes in the underlying asset.
0.05–0.10 (5–10%) → Deep out-of-the-money (far OTM)
0.15–0.30 (15–30%) → Moderately OTM
~0.50 (50%) → At-the-money (ATM)
>0.50 → In-the-money (ITM)
Now — who trades what, and why?
0.05–0.10 ->Tail-risk hedgers, "lottery" traders
Protection against black swans or cheap speculative bets
0.10–0.20 ->Aggressive speculators, potential insiders
Betting on explosive moves — possibly with inside conviction
0.20–0.35 -> Regular speculators, funds
Expecting moderate rallies — balanced risk/reward
0.40–0.60 - >
Institutions, hedge funds
Portfolio hedging, delta-neutral strategies
>0.60
Arbitrageurs, hedgers
Deep ITM options as synthetic positions
⚠️ Important Nuance:
Delta is not absolute.
Large players may use deep OTM options — but not for speculation.
These could be tail-risk hedges (e.g., protection against crash scenarios).
🔮 Predictive Power Isn’t Just About the Trade — It’s About the Timing
The forecast value of an individual option increases dramatically when you ask:
When did this position appear — relative to price action?
✅ Before a move? → High predictive power
❌ After a big rally? → Likely FOMO or profit-taking
✅ On a pullback? → Could signal support/resistance
IMPORTANT! Timing turns noise into signal.
📌 To be continued in the next update…

BTCUSD | MARKET SETUP & GAME PLAN 🟢 BTCUSD | Market Setup & Game Plan
Trend: Bullish overall, short-term retracement expected
📍 Market Context:
BTC has shifted into a clear bullish structure after breaking multiple lower highs (BOS + CHoCH).
Now price is reacting from a short-term supply zone (109.8k – 110.5k), which could trigger a temporary pullback before continuation to the upside.
🎯 Main Scenario (BUY setup)
Entry Zone: 108.0k – 108.5k (Demand + FVG area)
Reason: Price likely to retrace into the unmitigated demand zone before resuming the bullish momentum. Structure remains intact as long as 107.4k holds.
🔴 Alternate Scenario (SELL setup – short-term retracement)
Entry Zone: 109.8k – 110.5k (Current Supply Zone)
Reason: Short-term sell from supply zone for a corrective move before the next bullish leg.
💬 Summary:
Momentum still favors the bulls. I’ll look for a clean reaction from 108k demand to rejoin the uptrend. A pullback is healthy — not a reversal.

DIS Falling WedgeDis rallied from April '25 until July '25 and then consolidated around $120, forming a bullish falling wedge. The red line is the 200-day moving average which is acting as support at $110. It has been bounced off twice. The seasonals look bullish going into the last 2 months of the year when considering 2023 and 2024 price movement. The P/E ratio is 17.66 which is almost a 3rd of its 2-year moving average which is 47.43, indicating a low valuation with lots of room for upside. The aqua line is the 50-day sma which needs to be closed beyond along with the top side of the rising wedge before this thing can really take off. Fundamentals look bullish as well, with an uptrend in annual revenue growth and downtrend in debt/equity.

$RENDER (3-DAY): WYCKOFF distribution instead of BULLMARKET$RENDER is another one of those cases which, like CRYPTOCAP:DOT pretty much, seems to exist only for DISTRIBUTION purposes.
I published the #dot WEEKLY chart earlier on, showing its full life that has essentially been a variant of WYCKOFF distribution schematics.
And #RENDER is very similar in the current 'BULL MARKET', an attached 3-DAY chart shows the whole of the price action since JANUARY 2024.
Take a look at the DISTRIBUTION SCHEMATIC #2 pasted above the PA. Textbook almost. This absolute collapse could have been predicted, clearly. After this year's JANUARY blow-off top ($12), I saw what was forming and completely lost interest in this asset.
Learn your WYCKOFFS guys, and avoid coins that are looking like this one — you will save yourself a lot of money. And that’s my official financial advice, actually. Lol
💙👽
#wyckoff

NZD-USD Long From Demand Area! Buy!
Hello,Traders!
NZDUSD tapped into a horizontal demand area with strong rejection wicks. Expecting a short-term bullish reaction toward the next liquidity pocket at the target level.Time Frame 2H.
Buy!
Comment and subscribe to help us grow!
Check out other forecasts below too!
Disclosure: I am part of Trade Nation's Influencer program and receive a monthly fee for using their TradingView charts in my analysis.

40% November Candle coming!!!Welcome to the second part of my thesis. This section takes a short-term view of price action. Several key factors support a +40% ETH rally in November, let's break them down:
LIQUIDITY: The past two months have delivered choppy price action. ETH repeatedly swept prior lows while failing to print higher highs. This reinforces short-term bearish sentiment, yet the long-term uptrend remains intact. Such consolidation is classic liquidity engineering in a bull market, its sole purpose is to harvest stops and shake out weak hands.
Key KPI: Record Liquidations – Over $2.1B in total crypto liquidations since September (per Coinglass), with $1.4B longs wiped in October alone—the highest two-month cascade on record. This flushed leveraged bulls and primed sideline capital. Short-term sentiment is now deeply pessimistic (Fear & Greed Index at 25), positioning the market for a mean-reversion squeeze.
I don’t expect a vertical moonshot. A steady grind of fifteen +3% days (average daily gain needed: 1.8%) compounds to +40% by month-end—entirely achievable in a low volatility breakout.
INCREASING SHORT INTEREST: Crypto is a short-horizon arena dominated by retail and algo traders. Prolonged sideways action erodes conviction, pushing participants to flip bearish out of boredom. Rising short interest creates upside liquidity pools—the market always hunts the crowd.
Key KPI: Perpetual futures funding rates flipped negative (-0.05% 8h avg on Binance/Bybit) for the first time since July, while open interest rose 12% amid flat price. Uptober bulls are capitulating; short interest hit a 3-month high (45% of OI on major exchanges). Exhaustion of sell pressure is imminent.
HIGHER LOW: ETH defended the mid October low on multiple retests, forming a clear higher low on the daily timeframe. This signals bearish momentum exhaustion, dips are now absorption zones, not breakdowns.
In summary: Extreme liquidations have cleared the runway, negative funding rates stack shorts for a squeeze, and structural higher lows prove demand dominance. November’s catalyst stack (Pectra + post-election clarity) meets a technically washed-out market. The +40% move isn’t hope, it’s probability.

GBPAUD – Bear Flag Setting Up for the Next Move?GBPAUD has been dropping hard lately — sellers have been completely in control, pushing the market lower with strong momentum.
But now, things have slowed down a bit. After that heavy fall, price has started to climb gradually, forming a rising channel — a classic bear flag pattern. It’s the market taking a breather after the big move.
You can see buyers trying to fight back, but it’s not convincing. Each little push higher feels weak and keeps getting met with more selling pressure. It looks like sellers are just waiting for the right moment to step back in.
If price breaks below the flag structure with strength, that could be the confirmation we need for another impulsive leg down, with my next target sitting around 1.9856.
For setups like this, the stop-loss usually makes sense just above the flag — that way, if it fails, you’re protected.
As always, this is just an idea, not financial advice. I’m simply sharing how I see the chart — let’s see if the market decides to follow through.
What do you think? Will GBPAUD roll over for another drop, or could buyers surprise us this time? 👇
