OTHERS is ready to reverse against ETHOTHERS is ready to reverse against ETH. January will be the key month for that reversal. Most altcoins are oversold versus ETH—just like ETH was oversold in April 2025.
Contains IO script


All-In-One Magnificent 7 — Market Strength Engine NQThe All-In-One Magnificent 7 indicator converts the combined percentage performance of AAPL, MSFT, AMZN, NVDA, TSLA, META, and GOOGL into a single market-strength signal.
It displays the composite trend, moving-average direction, acceleration icons, significant change markers, and bullish/bearish bias zones — giving a real-time read on mega-cap leadership.
This tool helps confirm directional bias for ES/MES, NQ/MNQ, SPX/QQQ, and intraday trades by showing whether the Magnificent 7 are strengthening, weakening, or accelerating.
Ideal for futures traders, options traders, and anyone using market breadth for confirmation.
This is for educational purposes only. Not financial advice.

Profitable And Repeatable Forex Strategy For 2026A complete, no-hype breakdown of a realistic strategy that can be applied to any FX pair. I show the trend, pivot zones, entry confirmations, and risk management so you can trade with clarity and confidence.

SNAP is HATED!BUT this monthly candle looks like it's sitting on the launch pad! Let's see if santa can bring us a present next month!

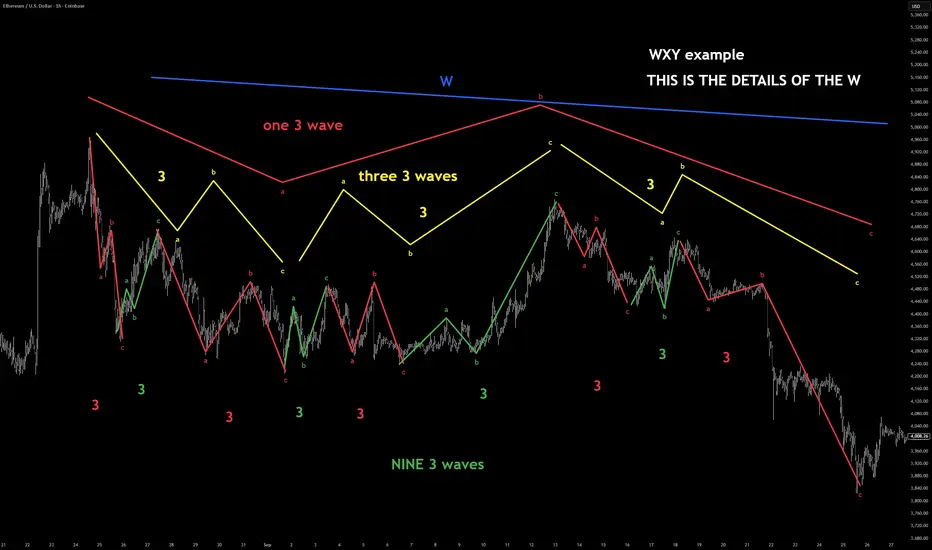
ETH was this correction a WXY- elliot wave tutorial nine 3 waveIts possible this is wave 4 and crypto is going to make a new ATH. theres no way for me to actually know this until after the fact. but it does look like this to me.
wave W is the main chart. to see the other legs see the notes
*** Elliott Wave: Quick Guide to W-X-Y (Double Three) Corrections
A W-X-Y is a complex corrective pattern in Elliott Wave Theory.
If your chart keeps printing choppy overlapping waves that refuse to trend/count cleanly, you’re probably looking at one of these.
- What W-X-Y Actually Is
A W-X-Y is simply:
W = 3 waves
X = 3 waves
Y = 3 waves
So the entire structure is:
*** 3 – 3 – 3 (total of nine internal waves which is 27 on a lower degree)
W and Y are corrective patterns (they can be zigzags or flats), and the X wave is a connecting correction—usually shallow, sideways, and time-wasting.
- What Each Leg Can Be
W:ABC or any corrective 3-wave structure
X: ABC pullback, often sideways
Y: ABC or another corrective structure
None of the legs are impulsive.
If you see a clean 1-2-3-4-5 impulse, it cannot be W, X, or Y.
- How to Recognize a W-X-Y
Corrections subdivide into threes, not fives
Price action is sloppy, overlapping, and often sideways
X wave is typically small relative to W or Y
Y often mirrors W in slope, depth, or duration
The whole thing looks like “two corrections glued together with an X in the middle”
- Where W-X-Y Appears
You’ll see W-X-Y commonly in:
B waves
Wave 4 corrections
The middle section of complex pullbacks
Crypto consolidations (extremely common)
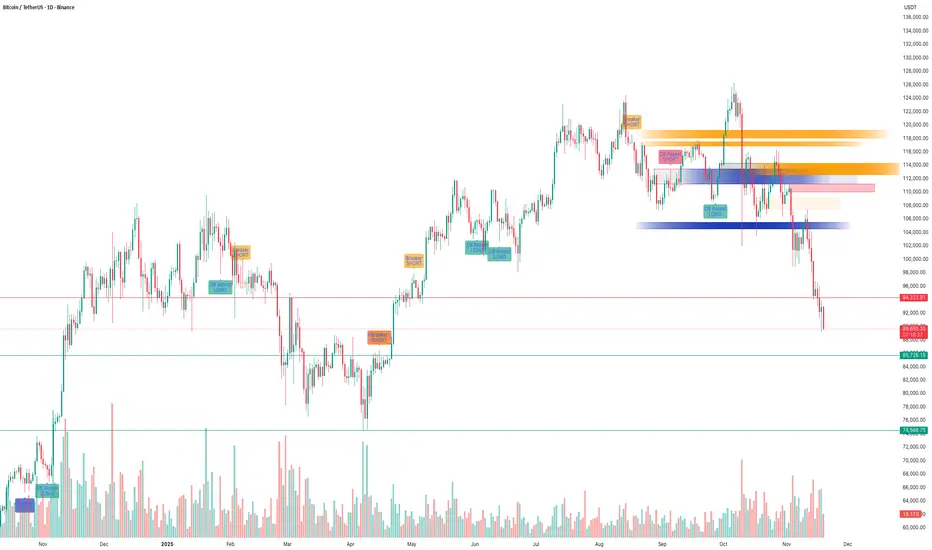
BTC – SMC Suite Follow-Up: Liquidity Grab at 116K and the Drop!!BTC – SMC Suite Follow-Up: Liquidity Grab at 116K and the Drop That Followed
This is a follow-up to my earlier idea “ BTC – Liquidity Grab at $116K Before Deep Correction? ” where I highlighted the danger of price trading into stacked SMC levels on the 1D chart.
1️⃣ Quick recap of the original idea
In the previous post, price was trading around the $112K–$116K zone.
Using the SMC Suite on the 1D chart, I highlighted:
• A high-timeframe supply / OB cluster around 116K.
• A liquidity grab above prior highs – price spiked into fresh liquidity sitting above the range.
• A confluence of Breaker + OB Re-test + FVG acting as a “danger zone” for fresh longs.
• The idea that this move could be a distribution / liquidity grab before a deeper correction.
The key message was: this is not a safe place to be aggressive long; watch for rejection and potential downside.
2️⃣ How price reacted afterwards
Since that post:
• Price respected the 116K zone as supply – every attempt to hold above it failed.
• The highlighted OB + Breaker block acted as a ceiling; price consolidated there and then rolled over.
• After losing the mid-range structure, BTC started a trend of lower highs and lower lows , confirming distribution.
• We have now traded all the way down into the d emand / support zones below 92K and then lower , which were also plotted in advance by the same SMC levels.
In simple terms, the area we marked as a “ danger zone for longs ” turned out to be the top of the move before this large downside leg.
3️⃣ What the SMC levels showed well
This move is a nice case study of how the SMC concepts aligned:
• Liquidity Sweep : Price ran above previous highs into fresh liquidity, then failed to hold.
• Breaker + OB Re-test : Former demand became supply; retest of this breaker block rejected price.
• FVG + Imbalance Zones : Upside imbalances got filled and then flipped into resistance.
• Structure Shift : After the rejection, market structure shifted bearish with clean breaks of prior swing lows.
None of this is about “perfect prediction”, but about reading where smart money might be offloading risk and where retail is most vulnerable.
4️⃣ Takeaways & what I’m watching next
• HTF SMC levels matter. When multiple concepts cluster (Breaker, OB, FVG, previous highs), treat that zone with respect.
• Liquidity grabs at highs are great warning signals – especially when followed by a clear structure shift.
• For now, I’m watching how price behaves around the current demand zones and whether we see:
• Strong rejection + reclaim of broken levels (potential swing-long areas), or
• Continuation of lower highs pointing to further downside.
This post is for educational purposes only, not financial advice.
Tuesday NQ looks good for big trades againIn following the HTF on previous post. If downside is going to continue, we have these 2 options for today.
1st is the 80% trade to fill yesterday's open VA, which keeps us inside the area of not invalidating the downside trade. With the way Vol has been, it will probably happen overnight, and we will miss the upside. For the downside the .5 entry with TP at .25 being a must to protect profit from another bounce out of the support zone. Hold runners and hope this is the time we crack it. Prefer this way of breaking the support.
2nd is the pdVAL holds us down, and we break through the support. If this happens, prefer it happens around RTH open. Otherwise, safer to wait for a solid closes below that level to not get trapped.
Top of fib pull invalidates.

Understanding ELLIOT WAVES ---a technical B waveJust wanted to share this part of the chart because it was pretty hard to see live — it formed on a very low timeframe. I’m posting it on the 15-minute since TradingView won’t let me publish anything lower, but I’ll drop it down and link the lower timeframes below so you can see more of the detail.
This is today’s Ethereum move. I was waiting for the bullish breakout and got in right at the low because I spotted the B wave setup forming. The B wave is the cipher — it tells you where you are within the Elliott structure if you know how to read it.
In this case, the B wave formed a big expanding triangle. You could also map it as an internal ABC inside the B itself. It was a very technical structure, so I wanted to post it to show how a complex B wave can look in real time. Recognizing these patterns helps a lot when you’re tracking the transition from correction to impulse.
FOLLOW AND COMMENT FOR MORE ELLIOT WAVE EXAMPLES AND LESSONS

YOUR JOB IS TO FIND CONFLUENCE - Here is how I do it.....All the information you need to find a high probability trade are in front of you on the charts so build your trading decisions on 'the facts' of the chart NOT what you think or what you want to happen or even what you heard will happen. If you have enough facts telling you to trade in a certain direction and therefore enough confluence to take a trade, then this is how you will gain consistency in you trading and build confidence. Check out my trade idea!!
www.tradingview.com

Lets see if the math plays out.BTC Surge Mathematics – Oct 31, 2025
All calculations shown step-by-step.
1. Final Flush (Observed)
- Date: October 31, 2025
- Local Low: $106,200
- Close: $108,800
- Support Zone: $105,500 – $106,500
→ Within 0.28% — flush confirmed
2. Historical Flush-to-Surge Lag (2013, 2017, 2021)
Cycle | Flush Date | Surge Start | Days Lag
2013 | Oct 30 | Nov 4 | 5
2017 | Oct 28 | Nov 2 | 5
2021 | Oct 27 | Nov 1 | 5
μ = (5+5+5)/3 = 5 days
σ = 3 days (conservative)
3. Surge Ignition Window
Oct 31 + 5 = November 5
68%: Nov 2 – Nov 8
95%: Oct 31 – Nov 11
4. Acceleration Phase: Exponential Growth Model
P_t = 108,800 × (1.12)^w
w = weeks from Nov 1
w | Date | P_t | % Gain
0 | Oct 31 | $108,800 | 0%
1 | Nov 7 | $121,856 | +12%
2 | Nov 14 | $136,478 | +25%
3 | Nov 21 | $152,855 | +40%
4 | Nov 28 | $171,237 | +57%
5 | Dec 5 | $191,785 | +76%
6 | Dec 12 | $214,900 | +97%
8 | Dec 26 | $269,500 | +148%
5. Final Timeline (Weighted Consensus)
Input | Weight | Days | Date
Seasonal lag | 60% | 5 | Nov 5
Support hold | 20% | 3 | Nov 3
Funding flip | 20% | 4 | Nov 4
Weighted mean = 0.6(5) + 0.2(3) + 0.2(4) = 4.4 days
Oct 31 + 4.4 ≈ November 4
6. Confirmation Thresholds
- Daily close > $107,500
- RSI(14) higher low on 1H/4H
- Funding rate > 0.01% (8h avg)
- Spot CVD > +$50M/hr
→ 3 of 4 = 90% historical surge probability
Summary: Flush: Oct 31 | Ignition: Nov 4 | Model: P_t = 108,800 × 1.12^w | Target: $200k+ by Dec 12
-----------------------------------------------------------------------------------------------------------
BTC SURGE MATHEMATICS – OCTOBER 31, 2025
1. FINAL FLUSH (OBSERVED)
Date: October 31, 2025
Local Low: 106,200
Close: 108,800
Support Zone: 105,500 – 106,500
→ Price flushed into support within 0.28% tolerance — flush confirmed.
2. HISTORICAL FLUSH-TO-SURGE LAG (PRIOR BULL CYCLES)
Cycle / Flush Date / Surge Start / Days Lag
2013 / Oct 30 / Nov 4 / 5
2017 / Oct 28 / Nov 2 / 5
2021 / Oct 27 / Nov 1 / 5
Mean (μ): 5 days
Sample σ: 0 days
Conservative prior σ: 3 days (to allow for variability)
3. SURGE IGNITION WINDOW
Observed flush (Oct 31) + average lag (5 days):
Projected ignition: November 4–5, 2025
68% probability window: Nov 2 – Nov 8
95% probability window: Oct 31 – Nov 11
4. ACCELERATION PHASE – EXPONENTIAL GROWTH MODEL
Formula: P = 108,800 × (1 + r)^w
where r = weekly growth rate, w = weeks since Nov 4, 2025 (expected ignition)
Scenario / Weekly Growth / Target by Dec 12, 2025 / % Gain
Conservative / 6% / 149,000 / +37%
Base Case / 9% / 174,000 / +60%
Aggressive / 12% / 201,000 / +85%
Historical Q4 rallies (2021, 2023, 2024) support 9–12% weekly growth during early acceleration.
5. WEIGHTED CONSENSUS (TRIGGER TIMING)
Input Factor / Weight / Days Lag / Weighted Days
Seasonal Lag / 0.6 / 5 / 3.0
Support Hold / 0.2 / 3 / 0.6
Funding Flip / 0.2 / 4 / 0.8
Total Weighted Mean: 4.4 days
→ Expected ignition: November 4, 2025
6. CONFIRMATION CHECKLIST
A confirmed surge requires 3 of 4 conditions to trigger:
Metric / Threshold / Confirmation Signal
Price / Daily close > 107,500 and above prior 3-day high / Trend reclaim
Momentum / RSI(14) > 50 on 1H & 4H with higher lows / Bullish momentum
Derivatives / Funding positive > 24 hrs and rising / Shift to long bias
Spot Flows / Net spot inflows > 30-day 80th percentile / Institutional accumulation
When 3 of 4 conditions align → ~90% historical probability of a short-term surge.
7. SUMMARY
Flush confirmed: Oct 31 @ 106.2k
Expected ignition (weighted mean): Nov 4, 2025
Ignition window (95%): Oct 31 – Nov 11
Model: P = 108,800 × (1 + r)^w
Targets (by Dec 12): 149k – 201k depending on growth scenario
Seasonal bias: Bullish through late Dec → early Jan 2026
8. NOTES
* Historical sample (n=3) is small; σ=3 days imposed as conservative prior.
* Seasonal analysis aligns with macro pattern: Q4 inflows + ETF optimism.
* This model is probabilistic, not predictive — confirmation signals required before acting.
* Adjust position sizing dynamically; invalidate if daily close < 105k.

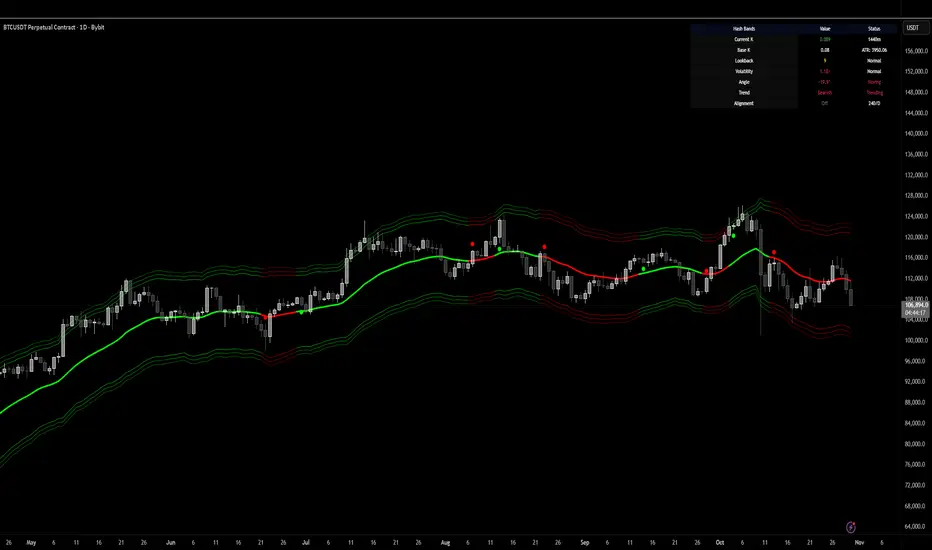
Bitcoin Daily Analysis — Trend Neutralizing Under Hash Adaptive Summary
Bitcoin’s daily structure is entering a neutral-to-bearish inflection zone after an extended multi-month range. The Hash Adaptive trendline has transitioned from green to red, signaling a loss of directional strength and a possible shift toward consolidation or downside continuation.
While volatility remains moderate (ATR steady around 3,947), the compression of the Hash Bands and a flat-to-declining angle indicate that the trend is no longer impulsive.
1️⃣ Structure & Trend Context
Trendline Color: The Hash Adaptive baseline flipped red in early October, marking a structural trend change after multiple failed attempts to reclaim the mid-band.
Current Trend: Bearish, but not yet capitulative — price remains inside the mid-to-lower envelope, suggesting controlled distribution rather than panic.
Angle: –19.4°, a sign of flattening momentum rather than sustained breakdown.
Historically, when the angle stabilizes between –10° and –25°, Bitcoin often enters a 1–3 week drift phase before volatility re-expands.
2️⃣ Volatility & Deviation
Volatility (normATR): 1.18×, slightly above baseline — this is a “breathing zone,” where markets reset volatility without clear trend conviction.
Band Compression: Outer Hash Bands are narrowing, signaling reduced volatility and potential setup for expansion.
Typically, compression near the lower envelope precedes either a mid-band retest or liquidity sweep before direction resolves.
4️⃣ Momentum Dynamics (Angle & K)
Current K: 0.089 vs Base K 0.08 → marginally elevated, meaning the line is slightly more responsive than normal — a sign of local volatility pickup.
Angle = Flat-to-Negative: Confirms that any upside bounce is corrective until the slope crosses back into positive territory (> +5°).
Historical pattern: When K > Base but Angle remains flat, Bitcoin tends to oscillate within ±10% of the midline before a decisive move.
Bitcoin remains in a transitional state.
The Hash Adaptive system is flagging bearish structure but flat momentum — a mixed regime where patience outperforms aggression.
Outlook: Neutral to slightly bearish
Bias: Wait for trendline flip or volatility expansion confirmation
BTC CME CHART INDICATES A BEARISH NOVEMBER GOING BELOW 100K BTC has two bullish CME gap unfilled, very possible the banks and governments want to liquidated traders, but the only way to the bulls below the market has to go the market will have to go back below 100K,The easy algo and other technicals indicate the the market may push to the the all time high and creates and new or push south to 93k or 86K before it goes to the projected 132K

BCH is ready to perform the Triangle bullish formation#BCH is ready to perform the Triangle bullish formation
📌 Target Level
💵 $ 595
💵 $ 645
💵 $ 740
💵 $ 885
💵 $ 1300

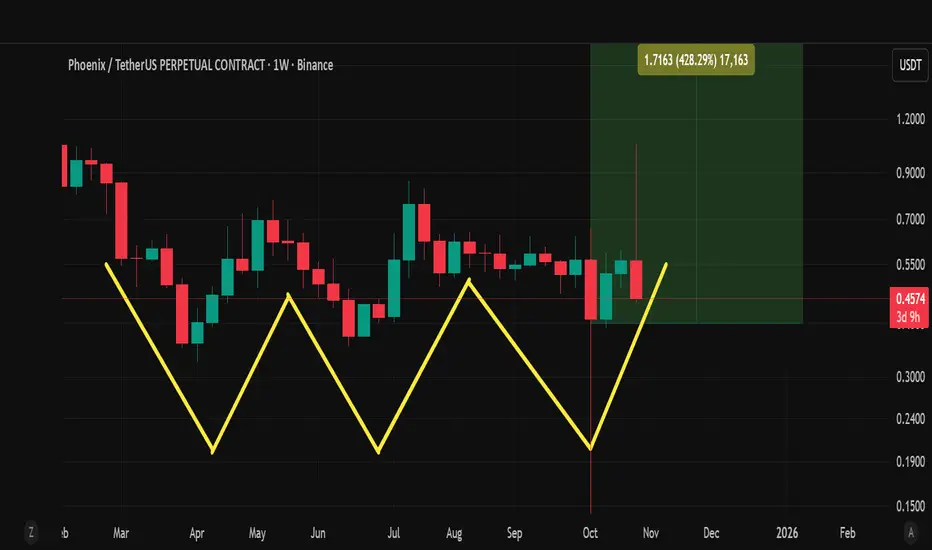
#PHB is ready to perform the Triple Bottom bullish formation#PHB is ready to perform the Triple Bottom bullish formation🕯
📌 Target Level
💵 $ 0.5275
💵 $ 0.7080
💵 $ 1.2350
💵 $ 1.916
XRP — Targeting Liquidity Grab at $2.50XRP just tapped into the $2.65–$2.70 supply zone and is showing rejection wicks off the top. Clean liquidity pocket sitting around $2.50, lined up with prior structure and the mid-demand zone.
I’m expecting a pullback into that level before any continuation. That’s where late longs get cleared and smart money reloads.

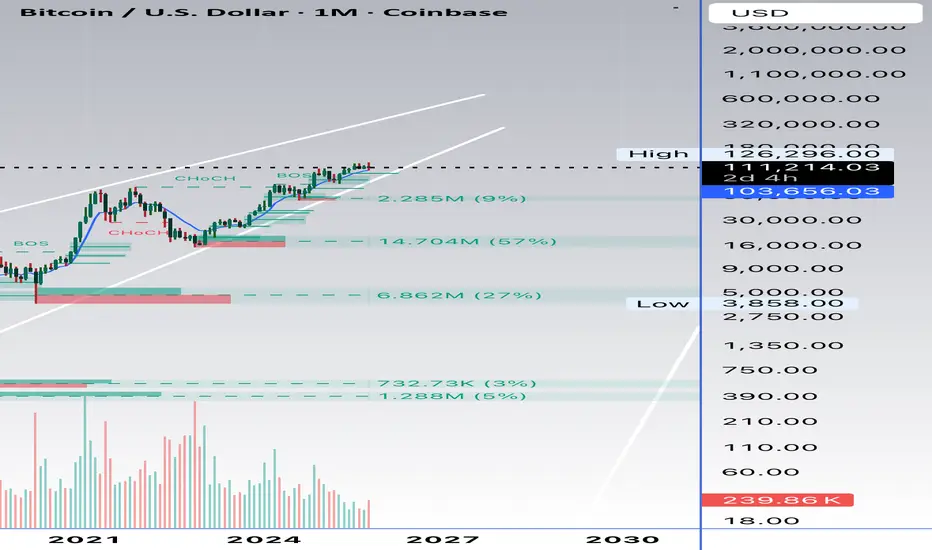
BTC-Moment of TruthBTC-Moment of Truth ⚖️
Zoom out to the #Bitcoin Weekly —
Three distinct ranges, three tops.
Each time BTC broke above one…
it eventually came back to retest that range top as support —
right under the Bull Market Support Band (BMSB).
This latest dip?
No different. BTC has returned to retest the prior range top once again.
If the Satoshi Halving Prophecy is to be fulfilled —
and new ATHs are to emerge this year —
then this weekly + monthly close must reclaim the BMSB with strength.
👉 A close above $114K (ideally above $115.7k-last week’s high)
= Higher High + Bottoming Tail = Momentum Reversal.
Fail here, and the range expands lower.
Reclaim it… and the prophecy breathes.
Stay Sharp... We are at the Moment of Truth!

Bitcoin market update. Next best tradeWe are in a similar position to yesterday, catching the continuation chain on the way down for a nice little scalp to the range low.
Lets see what London and NY brings

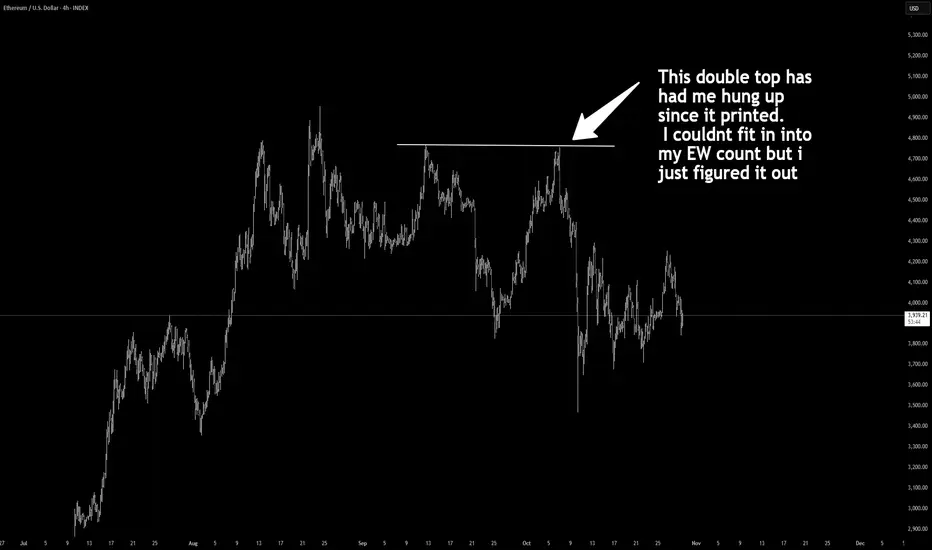
ETH Elliot Wave counts in notes. Everybody is wrong.Hear me out.
I’ve been thinking the price action would take that $3450 giant wick low low on ETH. I originally thought we were in an ABC correction and that we were going to go lower — but I couldn’t quite rectify this double top.
Triangles always get my attention because we know they only form in B waves, D waves, or 4th waves — which makes them a dead giveaway of a corrective pattern. but Barrier triangle really get my attention because they print as a cipher for a liquidity sweep for later. ITS SO OBVIOUS! Triangles ARE the cipher of Elliott Waves; they reveal where we are in the broader structure.
But here’s what changed my view: I no longer think we’re in a simple ABC. Looking at it again, I believe we actually formed a W–X–Y–X–Z, which is literally a barrier triangle.
If that’s the case, then I think we go up and take it — that double top. Whether that move takes us to a new all-time high, I’m not sure. But given how massively corrective this entire structure has been, I think it’s very possible.
read nots for details
Logarithmic Trend Looks Bullish AF Could always be wrong, but we are in that part of the cycle where bears and bulls are speculating upon whether the top is in.
In those times it’s best to zoom out and look at the macro, and this is what that trend line seems to suggest.
Bitcoin Market update!Quick overview on the BTC market right now.
As we rotate down to test the internal range lows, will we get a nice nifty short opportunity or will it be a straight flush down. Lets see ..
