ETH movement according to planOn October 26, Ethereum showed a clear upward movement on the 4-hour chart from the 4043.78 level. I entered on the next candle after confirmation and gradually closed positions at three profit-taking levels. I distributed the deposit across these zones and collected around 5 percent profit with 1.5x leverage.
The key is not greed but structure. Thanks to a secret proprietary strategy, it was possible to clearly see the levels and avoid emotional reactions. Many traders at that moment tried to chase the market, entering too late, but precise calculations and visualized levels allowed me to act calmly and without haste.
I often notice that even experienced traders make mistakes by ignoring their plan and technical references. But discipline is what separates chaotic trading from a system. Each level was predetermined, and the price moved exactly according to the calculations.
Contains IO script

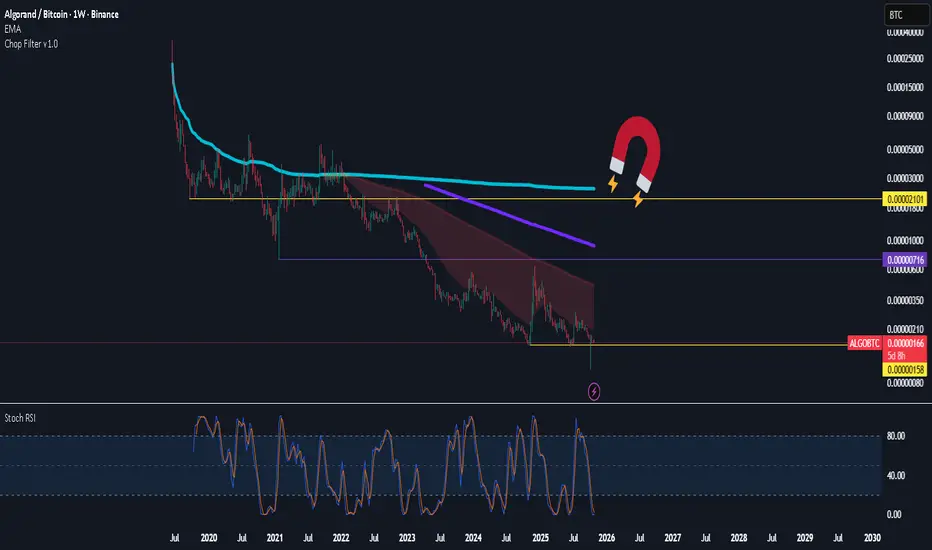
$algo -Phoenix another few days for the weekly and get ready for the impulse up through this cluster of heavy resistance above
logical first target is the 200 ema and blue line or previous range low then on our flip we go for the magnet
D2 chart on USD is close to reclaiming the 7 ema or what i like to use as the first sign of coming back to life and establishing a trend ..
monthly close expect volatilitly so save some coins to load up on the dip may just full send from here
to be confirmed either way Santa rally incoming as for the FA its got good stuff to build hype for retail to sell into later on ... remember in bear markets the dip keeps dipping and vice versa . eye on the ball

LTC: long position!The month of trading proved to be good (LTC).
The general trend shows an increase in prices, with the last buy signal being given in the range of 92-94 USDT, after which the price continued to move up to the current level of about 102.39 USDT

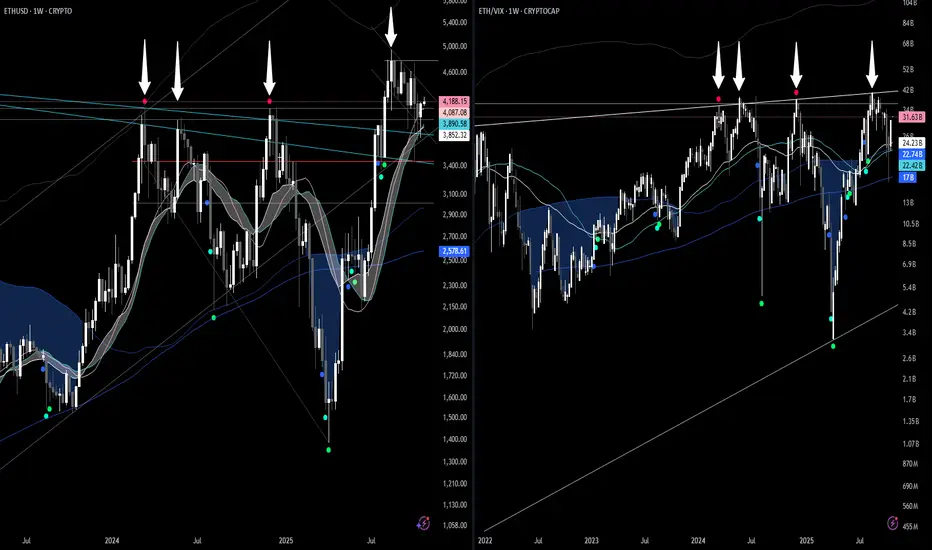
ETH and ETH/VIX Trend LineGoing to toss out a little free alpha for everyone... use the ETH/VIX ratio (works also for BTC and BTC/VIX ratio) to look for local tops. It has been 100% reliable this cycle. Likely will be accurate for the cycle top as well.

$BTCUSDT.P - Looking very bullish but..I'm waiting for the pullback. After higher high and probable pivot reversal for making pullback from the 1.618 fib projection are mitigating old CME GAP and after that taking out latest CME GAP below is pretty high probability play before continuation towards new ATH.
I'm very bullish but not hopping into long trade at this stage.
What you think?

Current SPY ConditionsI will use this chart to identify any important technical setups. This is th 60 Min Chart

EurUSD 100% Fibonnacci MoveHi Traders,
Todays EURUSD trade
Entry 1.16350
Profit Target 1.17700
Stop Loss 1.15800

US vs China: should we be worried?Another ''Buy the rumor''? What EVERY trader should have in mind amid US-China Trade talks:
1. Beijing balks at enforcement or verification terms
China could reject U.S.‑demanded mechanisms for monitoring compliance, such as agricultural purchase tracking or fentanyl control checkpoints.
Past talks collapsed over the same issue, the U.S. insisting on verification, China citing sovereignty .
If Beijing signals “framework only, no enforcement,” Washington may treat it as stalling and re‑activate the 155 % tariff threat for Nov 1 .
2. Rare‑earth or tech export retaliation
China still holds leverage through critical‑mineral exports. If it re‑tightens rare‑earth or semiconductor‑material shipments, Washington could impose new export controls on Chinese tech, reigniting escalation.
That “supply‑chain weaponization” was what caused the early‑October market sell‑off and would likely repeat—hurting metals, EV, and chip stocks first.
3. Unexpected Trump pivot under political pressure
Analysts warn that Trump tends to shift abruptly when domestic optics change.
A new social‑media statement accusing Beijing of backsliding could nullify the deal narrative overnight .
Morgan Stanley’s Mike Wilson noted that any such reversal could trigger a 10–15 % equity correction due to “positioning unwind and tariff risk repricing” .
4. National‑security or Taiwan language slips
The framework explicitly avoids defense issues, but if Trump or Xi reference Taiwan or South China Sea policy during press remarks, it could politicize the summit and freeze trade clauses .
5. Market complacency and over‑positioning
Even with a signed “mini‑deal,” markets may have already priced it in.
JPMorgan research warns that a “buy‑the‑rumor, sell‑the‑news” reaction is likely if investors had pre‑emptively rotated into cyclicals .
Thin liquidity plus leveraged optimism could amplify any disappointment.
Bottom line:
Unless both leaders explicitly confirm a tariff suspension and avoid new geopolitical flashpoints, markets remain only one headline away from reversal. The biggest red flags to watch this week are (1) a stalled verification clause, (2) talk of renewed tech or rare‑earth restrictions, or (3) Trump implying that tariffs will still “go forward pending review.” Any of these could instantly shift sentiment from optimism to a fresh wave of selling.
#trade #correction #economy #finance #us #china #tariff #bitcoin #crypto #stocks #equities #trading

NQ OUTLOOK FOR UP COMINGWe broke an all-time high last week, and we are currently above the 50/200 EMA. A fair value gap is present on the one-hour/4-hour time frame that is close to the previous resistance or break of structure, and TP2 is in play. If it breaks and closes above the last week high, look for the fair value gap to touch for an buy entry. If the market close above the previous 4-hour candle from last week, look for it to take out the current month high, technically it works OK, but if the president says or does something, throw the technicians out the window, stop your loss, and don't be greedy.

Bearish ModelI would love to see this bearish model play out early next week for GJ.
If not, I'd like to see price break above medium BSL before retesting it and eventually going up further.

Axis Bank opportunity for long. 75-min chartPrice maintains a strong higher-high, higher-low pattern.Local pivot supports lie near ₹1,220 (VWAP + short-term trend line.
strike.RSI remains above 60, showing bullish bias but nearing overbought.As long as price holds above ₹1,200–₹1,210, bullish sentiment persists.Weekly chartWave C of the developing ABC corrective structure (per Neo Wave) appears incomplete.The prior impulse (Wave A) peaked near ₹1,275, followed by a shallow Wave B correction.Weekly candles show renewed upward momentum — signalling Wave C targeting ₹1,300–₹1,320 before exhaustion.Monthly chartSupports your reading: price likely in Wave B of a large-degree ABC structure.Wave B currently unfolding as a complex corrective that may extend to ₹1,350 before revesal. Chance of 1350 on chart with strict stop loss of 1180 /1200.
Chart is for study purpose to increase the knowledge. Seek expert input.

Can Gold Rival ATHs?Early last week, we finally saw the much anticipated correction on Gold. This move was likely a liquidation event, shaking out a wave of over-leveraged long positions that had built up during the prior rally.
On the 4H timeframe, price consolidated and accumulated for most of the week following that flush, suggesting that the market may now be rebuilding liquidity for its next major leg.
With weak hands cleared and positioning reset, Gold could now be preparing to retest its ATHs and possibly break into new territory if momentum and fundamentals align.

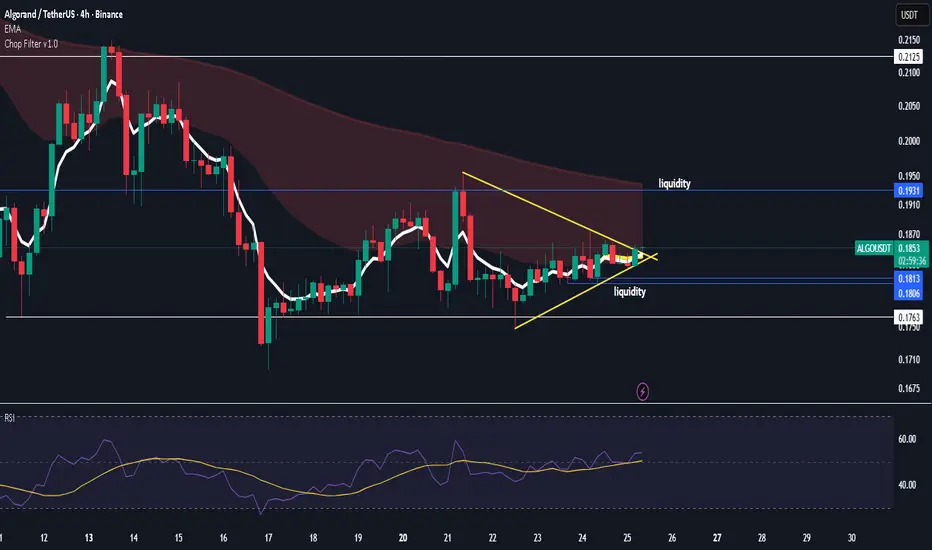
$ALGO- ride to 97c then do what you wantwas lagging now looking better than ada
basically gone in for these 3 the A team and a few degen plays with low caps
again in mid zone and we need some loving to pump this
sunday nite may get a liquidity grab
either way domi is still hovering in supply zone need it to loose 57%ish
after that monthly wick on domi and 60% rejection a few days ago its getting lower highs for now ... keep the faith
$adaCharles is about to fat finger this to $1.80 at least before a major pull back
for now same as avax waiting for that big resistance above to be blasted through

$avaxabove 22 we fly
will need a fat finger to blast through all that resistance above
once we do close above step on the gas since we should go to $60 imho
fast and furious
time to make it back ..

BTC cycle done? (ISM PMI)CRYPTOCAP:BTC & Business Cycles 🔄 (Part 3)
In my previous posts, I showed how the ISM PMI index reflects macroeconomic business cycles, and how liquidity (Global M2) cycles tends to lead these movements by several months.
📍 Today, let’s go one step further. The Financial Conditions Index (NFCI) leads the ISM by roughly 6–9 months, offering an even earlier look into where the economy and risk assets (like crypto) might be heading next.
📝 While this leading indicator comes with a little bit larger margin of error, understanding its key drivers — credit spreads, volatility, and interest rates — gives valuable insight into how tight or loose financial conditions are.
💡 When these conditions ease, liquidity flows increase, supporting both the business cycle and market expansion (especially in liquidity-dependent assets like #altcoins). And as we can see, the current trend suggests improving conditions, hinting that the next expansion phase of the macro cycle could be forming soon.

Weekly crypto review: BTC trend structure Price continues to move in line with the main scenario discussed in previous weekly updates.
As long as the structure remains constructive and key supports hold, I'll be holding the base hypothesis of correction completion and gradual trend recovery as a prime one.
In this scenario, over the coming weeks and into Q4, I’d like to see:
• price holding above local support;
• breakout and consolidation above the 21-day EMA and 50-day MA;
• gradual movement toward next resistance zones — 115–120K, followed by 123K+.
Key levels:
• Local support: 109–107K
• Local resistance: 114–116K, then 120–123.5K
• Macro support zone: 102K
A breakdown below local support may trigger another retest of the lower boundary of the macro-support zone.
If weekly closes occur below 102K, it would notably increase the probability that the current long-term uptrend cycle is ending and a macro-correction phase is beginning.
Daily time frame:
Weekly:
Thank you for your attention — wishing everyone a calm weekend and a productive start to the new week!

Scalping using PAR Scalping using PAR 10 min 60 & 240 - Make sure to watch on 15min then move to 1 min before entry

VisaNYSE:V is forming a bull flag
weekly 9/21 EMAs and 50 SMA are supporting
daily 9/21 EMAs and 50/200 SMAs are supporting
NYSE:AXP earnings were good and that is a positive sign for Visa
I am bullish.
very good R/R with stops on weekly close below 50 SMA

EDUUSDEDUUSD is in accumulation zone, Just crossed VWAP on daily and showing solid buy volume.
Power of 3 is the scenario I see.
Targets are PoC of upper range and TP2 is ATH

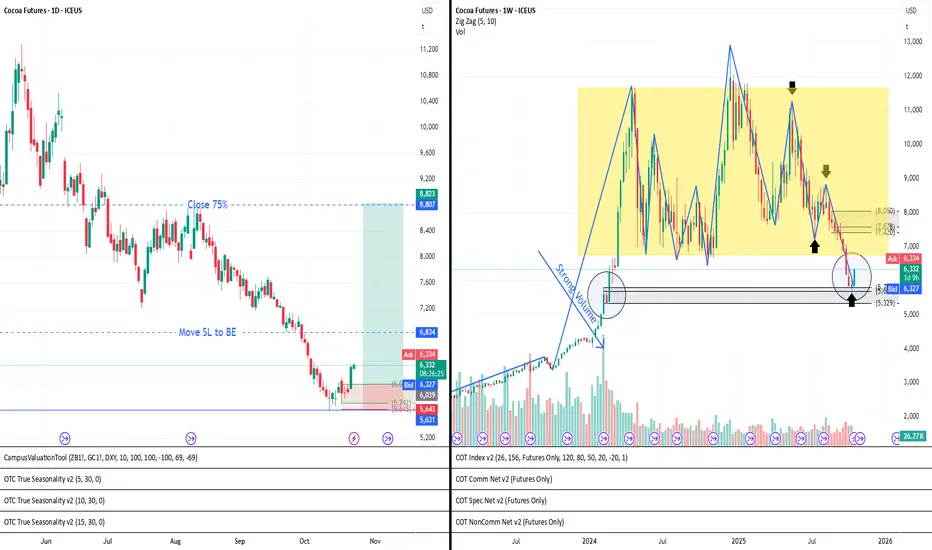
23.10.25 Cocoa Weekly buyWeekly
Cocoa reacted from a previous demand zone (Rally-Base-Rally, wider version) and it looks like it may be forming a Drop-Base-Rally pattern. This will be confirmed or invalidated with the close of this week.
At the moment, there is no clear trend, as there is still no confirmation according to my rules. Cocoa has mostly been moving sideways.
The existing risk is that we may be starting a breakout into a downtrend, since we already have one high with a lower high and one low with a lower low. However, we still need one more lower high and one more lower low to confirm a new downtrend.
Daily
A Drop-Base-Rally has formed with an explosive daily candle, which for me indicates the creation of a new demand zone inside a not-yet-confirmed weekly demand zone. My strategy is to set a buy limit order and go long.
I would prefer to see the buy limit triggered before price reaches the supply zone, because if it reacts from my weekly supply, there is a risk of confirming the downtrend.