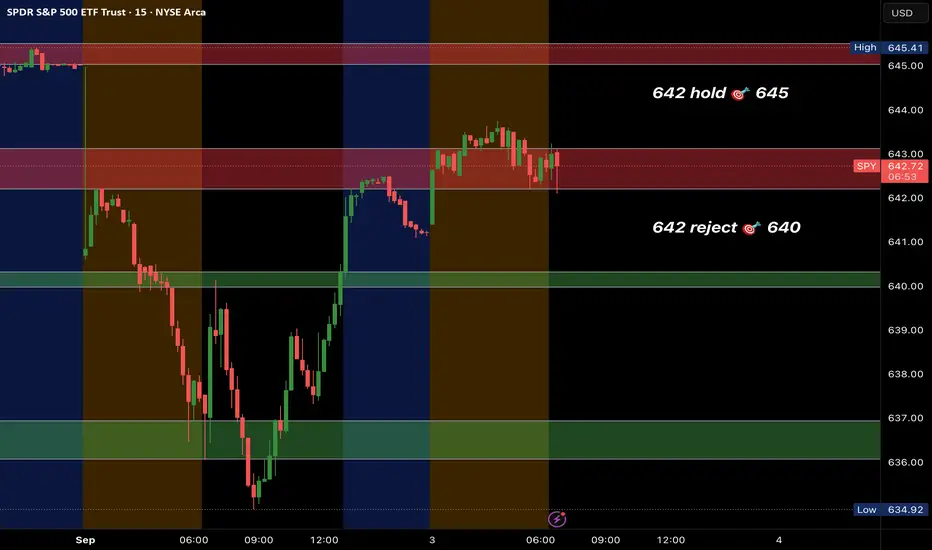
SPY daily LVL bulls or bears…September correction? 3 major levels to focus on today which are 640-647. Currently at 643 potentially waiting on 7am trend but watching these levels closely for market direction.
The market loves misdirection. Yesterday the market fell at open then held support. Today will the market gap then loose momentum to the upside? Let’s find out!
Contains IO script
BTC in bearish phase?After the white bottom indicator triggered, the market continued to decline, suggesting a potential shift to a bearish phase. It is recommended to monitor further price movements and volumes for confirmation.

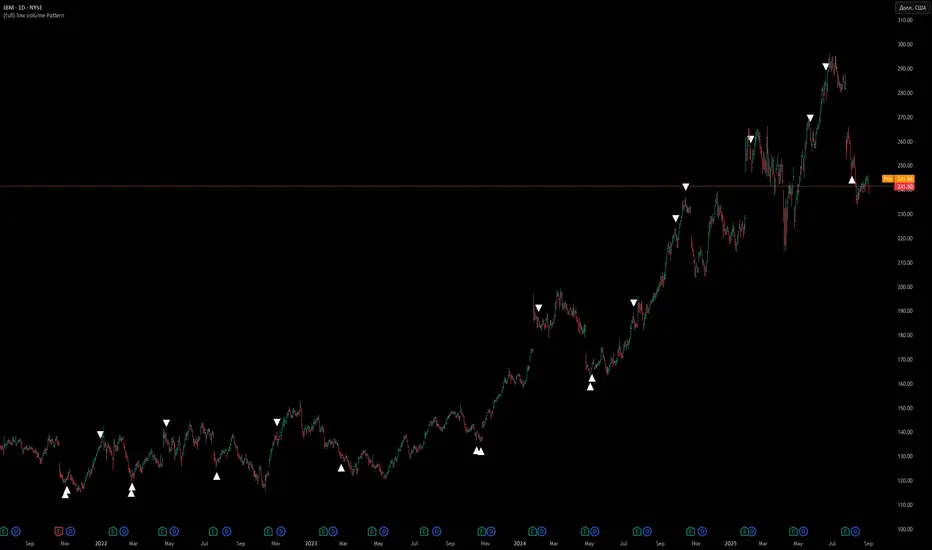
IBM in bearish phase?After the white bottom indicator triggered, the market continued to decline, suggesting a potential shift to a bearish phase. It is recommended to monitor further price movements and volumes for confirmation.
Monero Retests $235 Support, Eyes Rotation Toward $417Monero (XMR) has successfully retested $235 support, previously resistance, now aligned with the 0.618 Fibonacci retracement. Sustained bullish volume could propel price toward the $417 resistance target.
Monero has reclaimed and confirmed the $235 level as a critical support after retesting it successfully. With this region now aligned with the 0.618 Fibonacci retracement, the technical picture remains firmly bullish. Holding this level is crucial for continuation, as it preserves the broader market structure and keeps the next upside target of $417 in play.
Monero (XMR) Key Technical Points
- $235 Support Confirmed: Former resistance flipped into support with Fibonacci confluence.
- Bullish Market Structure Intact: Holding $235 sustains higher highs and higher lows.
- Next Target at $417: Breakout continuation favors rotation toward this resistance.
The successful retest of $235 has given Monero’s chart a strong bullish foundation. This level was previously a point of resistance, and its confirmation as support marks a significant structural milestone. The added confluence of the 0.618 Fibonacci retracement further strengthens its importance, reinforcing the idea that this region should sustain if Monero is to continue its bullish trajectory.
Market structure remains supportive, with the $235 zone acting as a higher low that validates the ongoing uptrend. Several daily closes above this region confirm that demand is active, as buyers consistently step in to defend this level. This behavior reflects market confidence and positions XMR well for its next upward move.
Volume dynamics will play a decisive role in confirming continuation. While bullish influxes have been present around $230, these flows must remain strong and sustained for Monero to push higher. Without adequate participation, price risks stagnating around the support region, but with increasing demand, momentum can carry Monero toward the next resistance target at $417.
The $417 level is the immediate upside objective, representing a high timeframe resistance zone. This area will be a critical test for Monero’s bullish case. A successful rotation into this region would not only confirm the uptrend but also open the door for potential continuation beyond it on longer timeframes.
What to Expect in the Coming Price Action
As long as Monero holds above $235 support, the bullish market structure remains intact. A sustained defense of this region, backed by continued volume influxes, should drive price toward $417 resistance, validating the bullish momentum.

Solana Reclaims $197 Support, Eyes Expansion Toward $260Solana (SOL) has reclaimed $197 support above the value area high. With vertical accumulation in play, sustained volume inflows are needed for continuation toward the $260 resistance level.
Solana continues to show bullish strength as it reclaims $197 support, establishing a base above the value area high. This development confirms the ongoing vertical accumulation structure, characterized by consistent higher highs and higher lows. With market structure intact, Solana is preparing for the next stage of its bullish advance.
Solana (SOL) Key Technical Points
- $197 Support Reclaimed: Price now sits above the value area high.
- Vertical Accumulation: Structure of higher highs and higher lows remains intact.
- Upside Target at $260: Breakout continuation could extend to this key resistance.
The reclaim of $197 marks an important step for Solana’s bullish trajectory. This support is not only structural but also symbolic of market confidence, as price has managed to consolidate above the value area high. Reclaiming this zone eliminates immediate downside risk and places Solana back into a position of strength.
Price action continues to demonstrate vertical accumulation, where each pullback has been shallow and quickly followed by another leg higher. This behavior is consistent with strong bullish environments, where demand consistently outweighs supply. The preservation of higher lows throughout this uptrend further confirms Solana’s strong structural integrity.
For continuation toward $260, volume will play a decisive role. While Solana has shown impressive structural resilience, the sustainability of the move depends on bullish influxes maintaining strength. In recent sessions, demand has been supportive, but this must continue and intensify as price approaches higher resistance levels. Without growing volume, momentum risks fading before reaching $260.
The $260 mark is the next major resistance zone, aligned with prior structural rejections and psychological significance. A clean test and breakout of this level would confirm continuation and potentially open the door for further extensions on higher timeframes.
What to Expect in the Coming Price Action
As long as Solana holds $197 as support, the bullish outlook remains intact. Sustained bullish volume inflows should propel price toward $260 resistance, confirming the vertical accumulation phase and reinforcing the continuation of Solana’s uptrend.

EURGBP BUY TRADE - HOW and WHY I will enter the trade!!!All the information you need to find a high probability trade are in front of you on the charts so build your trading decisions on 'the facts' of the chart NOT what you think or what you want to happen or even what you heard will happen. If you have enough facts telling you to trade in a certain direction and therefore enough confluence to take a trade, then this is how you will gain consistency in you trading and build confidence. Check out my trade idea!!
www.tradingview.com

ETHUSDT: 4200-4280 Reversal ZoneIdea:
Looking at the daily chart for ETHUSDT, the zone between 4280 and 4200 has repeatedly acted as strong support. This area continues to hold, showing resilience as sellers struggle to push price meaningfully lower.
If a trend reversal is in play, this is exactly where I would look to get involved on the long side.
Curve Model Explanation:
Price often follows a cycle: it moves from the top of the curve (overbought, higher risk to long) down to the bottom of the curve (oversold, lower risk to long). Currently, ETHUSDT is positioned at the bottom of this curve, making it a favorable risk area to consider a long trade.
Risk/Reward View:
Entering here means low risk to the upside, as buyers have been consistently absorbing downward moves. The reward is attractive if sellers continue to lose steam and momentum shifts upward.
Candlestick Evidence:
Recent candles show decreasing selling pressure—smaller real bodies and longer downward wicks reflect seller exhaustion and a battle to hold lower prices. While ETHUSDT is still challenging the trendline above, the push lower is weakening.
Summary:
I am watching the 4280-4200 support zone as a prime area for a potential trend reversal. It aligns with the bottom of the curve—classic low-risk, high-reward territory. The candlestick structure supports my thesis: sellers are fading, and an upside break could provide a strong opportunity for bulls.
Would love to hear your thoughts on this setup! Do you see the same reversal potential in the 4280-4200 zone? Are there other signals or confluences you’re watching here? Share your perspective and let’s discuss possible trade ideas or alternative scenarios.

What is Breakeven"In trading, every step is about risk management. Any position can end in profit or loss, and the trader’s task is to minimize the latter. One of the most debated techniques in this field is moving the stop-loss to breakeven. For beginners, it raises many questions: when should it be done? is it always correct? does it limit profits?
What is Breakeven
Breakeven is the level at which a trade closes without profit and without loss. The trader locks in zero result, preserving capital and avoiding risk if the market suddenly turns against them. Technically, this means the stop-loss is moved to the entry price after the position moves a certain distance in the trader’s favor.
The essence of the technique is to remove the worst-case scenario — taking a loss when the plan fails.
Why Move the Stop to Zero
The main benefit is psychological. While the stop is in the red, a trader feels tension: every fluctuation could knock them out and cut their capital. Moving to breakeven removes that pressure. The trade becomes “free”: it’s either profit, or nothing. This creates calmness and focus for further decisions.
Another aspect is discipline. Breakeven builds the habit of protecting capital. Many traders lose money not because their ideas are bad, but because they lack rules for managing trades. Breakeven enforces discipline and reminds: the priority is not giving more to the market than you planned.
When to Move the Stop to Zero
This is where most beginners go wrong. Moving to breakeven too early means not allowing the trade natural space to breathe. The market almost never moves in a straight line — it pulls back. If the stop is too tight, the position gets closed at zero, and then price continues in the expected direction.
Experienced traders only move stops after price crosses a meaningful level that truly confirms trend strength. This could be:
- a breakout of a significant support or resistance;
- consolidation above a local range;
- reaching the first target level (TP1).
That way, breakeven is not a random act for calming nerves, but part of systematic trade management.
Why Breakeven is Not Always the Best Choice
While useful, the technique has a downside. Moving stops too frequently or too early often leaves traders with “nothing trades” — positions closed at zero while the market later moves in their favor. This slows capital growth.Professionals use breakeven selectively, and always as part of a broader risk and position management strategy. Sometimes it’s more profitable to leave a stop in the red but beyond the level that truly invalidates the scenario. That gives the market room to develop while keeping risk under control.
How to Integrate Breakeven Into a System
Breakeven is not a universal rule, but a tool. To use it effectively, a trader should:
- predefine conditions for moving the stop (e.g., only after TP1 is reached);
- avoid emotional rushes;
- consider market structure and trend strength;
- combine the technique with technical analysis: levels, volumes, candlestick patterns.
With a system in place, breakeven becomes part of the bigger picture rather than a random “just in case” action.
Automation and Cold Logic
The hardest part is that the decision to move a stop is often made under emotional pressure. A trader sees a small retracement and quickly protects themselves. But emotions are exactly what rob good trades of their potential. The solution comes with algorithms. Tools that highlight key levels, guide trade management, and allow partial profit-taking remove emotional bias. A machine doesn’t panic, doesn’t get greedy, and doesn’t hesitate. It follows conditions with statistical precision. In this framework, breakeven is no longer an emotional gesture but a logical step: price broke a level, consolidated, scenario confirmed — the stop is moved.
Conclusion
Breakeven is a powerful risk management tool, but only when used as part of a system. It protects capital, reduces psychological pressure, and builds discipline. But moving stops too early or chaotically can block profits and turn strategy into randomness. In trading, winners are not those who know the most, but those who can keep a clear head and trust the plan. When rules are predefined and tools help visualize the market and control key levels, every decision becomes deliberate. That’s what separates a professional from a gambler."
BTC: Structured Drop to $107.7K — Pure Algorithmic Work"On the 1H chart, BTC’s decline from $114K to $107.7K was a clean structural scenario. Four targets hit, position guided to the final zone without emotional deviation.
For professionals, value isn’t in the direction — they see that themselves. Value lies in how the system removes routine: marking levels, structuring the plan, and controlling risk. That saves attention and time, leaving more focus for strategic analysis. The market will always be chaotic, but structure is what makes chaos tradeable."
BTC: $114K → $107.7K Drop and Trade Discipline"Intermediate traders know that entry alone doesn’t matter — trade management does. On the 1H BTC chart, the move from $114K downward unfolded through four profit targets, reaching $107,700.
The algorithm acted as a disciplined guide: marking key levels, pointing to partial exits, and allowing the position to run until the scenario was completed. For traders, this means fewer emotions, more consistency, and better use of time. It’s structured discipline that turns volatility into opportunity."

BTC: From $114K to $107.7K — Keeping Control"For beginners, the market often feels like chaos: price goes up or down, but what to do next is unclear. At the end of August, Bitcoin turned sharply downward, dropping from $114,000 to $107,700. Many froze in confusion.
An algorithmic approach removes this uncertainty. The entry was identified in advance, and the system guided the trade step by step — highlighting interim zones and profit-taking levels. The drop wasn’t a surprise, but part of the plan."

Drop from $114K to $107.7K — How the Algorithm Tracked the MoveOn August 24, Bitcoin entered a sharp decline. On the 1H timeframe, an entry area was highlighted near $114,000, and systematic trade management guided the move through four profit-taking levels. The final zone at $107,700 delivered nearly $6,300 of market distance.
The process unfolded without guesswork: the system marked key zones, suggested partial exits, and kept risk under control. For traders, this means trading without chaos or emotional interference.
Moves like this prove the power of structured trading. It’s not just about spotting direction, but about managing the position step by step. When an algorithm helps maintain discipline and organize the flow, trading shifts from emotional gambling into a clear, systematic process.
CONGRATS IF YOU LONGED! MY NEXT TRADE IDEA📊 In trading, you can have the most meticulous plan, and it still won’t always play out as expected. Sometimes you’re right, but you don’t get the confirmation you’re comfortable with ✅.
💡 In my opinion, that’s exactly what happened in the last 24 hours—aside from the deviation short play we caught this morning ⏰📉.
🎥 Watch today’s video to understand why and get insights on the next potential moves for Bitcoin 🚀🪙.

$SOL holding strong at support.CRYPTOCAP:SOL seems to be holding very strong above 0.5 FIB level on 4H timeframe expecting a little pump in it.
CRYPTOCAP:SOL doesnt want to go down because retail keeps buying every dip.
It only clears on thing which is meme coins season is around.

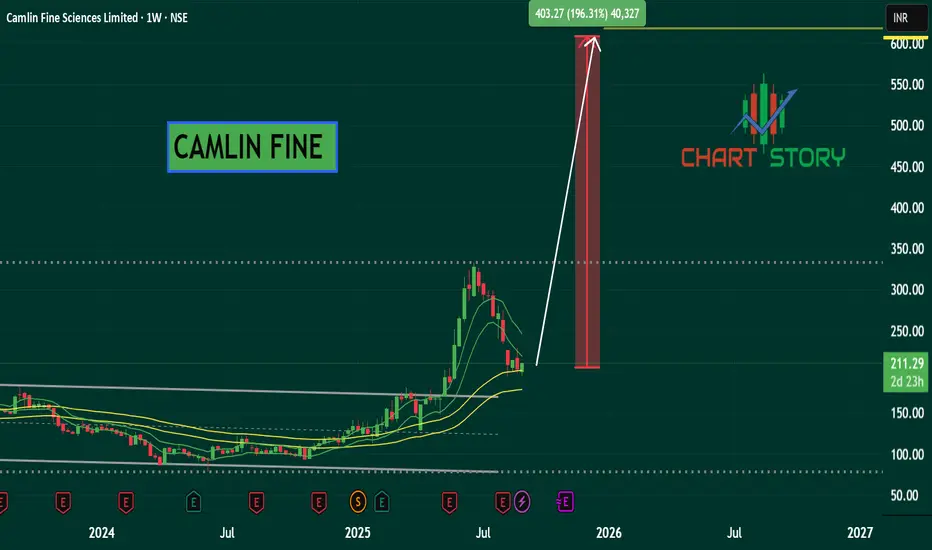
CAMLIN FINE - FAST FURIOUS BUYNSE:CAMLINFINE Weekly parabolic formation waiting for buyers. Location is very good.
Play the LONGTERM GAME with $WLFIPlay the LONGTERM GAME with TSXV:WLF
Remember that $TRUMP did 17x
$WLFI is going to 20usd - that's 92X
STOP SHORTING TODAY
Think LONGTERM

$ETH pumping up againCRYPTOCAP:ETH testing the support again and reversing back up. Placing stop loss at breakeven.

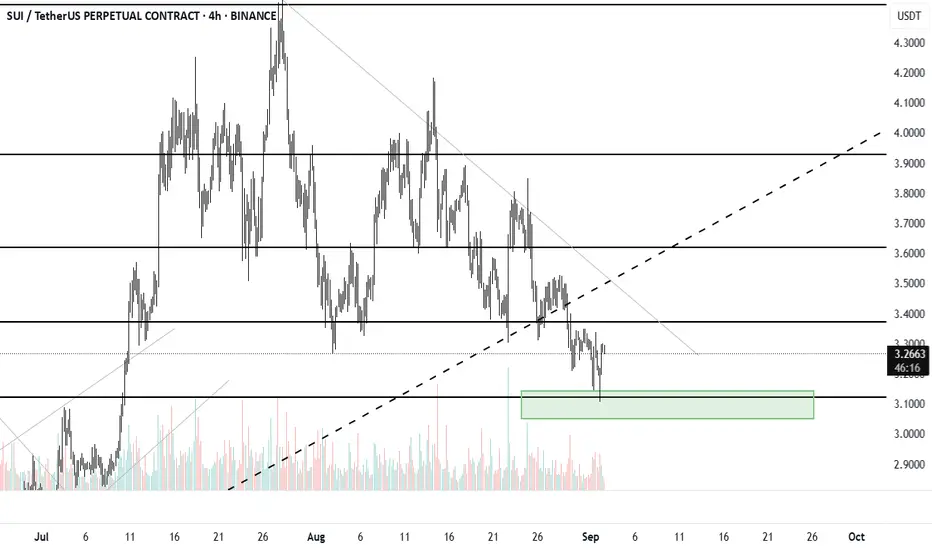
$Sui reversed from EntryCRYPTOCAP:SUI Tapped my Entry and reversed back up quickly. Nice limit order.
Putting stop loss bit above breakeven with some profit.
NALCO - PARABOLIC BUYNSE:NATIONALUM Weekly parabolic formation with momentum indicator may continue further up move in near terms. For accumulation it using inv head and shoulders.

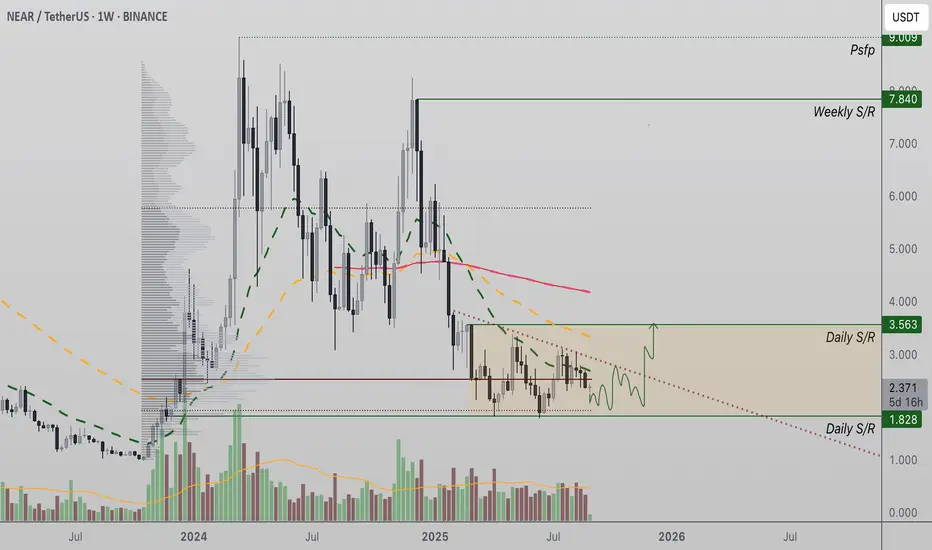
NEAR Protocol Price Coils in Equilibrium, Breakout Toward $7.80 NEAR Protocol is consolidating within an apex structure of higher lows and lower highs. A decisive break of $3.50 resistance with volume could fuel a bullish rotation toward $7.80.
NEAR Protocol is approaching a critical moment on the charts as price action tightens into a converging equilibrium. With both lower highs and higher lows forming, the market has created an apex zone where a breakout will eventually materialize. Support is currently holding at $1.80, while resistance at $3.50 stands as the major barrier before any significant continuation higher.
NEAR Protocol (NEAR) Key Technical Points
- Support at $1.80: The key level that maintains the integrity of bullish structure.
- Resistance at $3.50: A breach here could trigger a breakout from equilibrium.
- Upside Target at $7.80: The next rotational objective if resistance is cleared.
NEAR Protocol has spent the past sessions in a prolonged consolidation phase, forming a classic equilibrium of lower highs and higher lows. This compression of price action highlights the market’s indecision, but also builds the conditions for volatility expansion once either support or resistance is broken.
The $1.80 level remains the most important support in this structure. Each retest of this zone has attracted buying demand, preventing a breakdown and maintaining bullish potential within the broader market structure. On the other hand, the $3.50 resistance level has acted as a dynamic ceiling, rejecting price multiple times. A confirmed breakout here would signal the end of equilibrium and the start of a bullish rotation.
The volume profile provides further insight. Current trading shows average levels of participation, insufficient for a sustained breakout in either direction. For NEAR to rotate toward $7.80, an influx of bullish volume is required, ideally with strong continuation after the breakout. Without this confirmation, false moves and quick rejections remain a risk.
Market structure suggests that once the $3.50 resistance is broken on convincing volume, the probability of a continuation move toward the $7.80 level increases significantly. This target aligns with historical resistance levels and fits within the broader rotational framework of NEAR’s chart.
What to Expect in the Coming Price Action
As long as NEAR Protocol holds above $1.80 support, the equilibrium structure remains intact and biased toward a bullish resolution. Traders should watch closely for a breakout above $3.50, backed by significant volume influx, as this would likely confirm momentum toward $7.80. Until then, price may continue to compress within the apex zone before making a decisive move.
ENA LongI don’t share many day trades on TradingView, but ENA looks promising. I expect one more leg down before a move up let’s see how it plays out. X marks the invalidation.

AVALANCHE - GOOD ENTRY FOR LONG SWING TRADE, 100%+AVALANCHE (AVAX) - Layer 1 blockchain, that functions as a platform for decentralized applications and custom blockchain networks. It is one of Ethereum’s rivals, aiming to unseat Ethereum as the most popular blockchain for smart contracts. It aims to do so by having a higher transaction output of up to 6,500 transactions per second while not compromising scalability.
Looking for an entry around $25 and exit around $50 on spot for a nice 2x. Its possible for price to move a bit lower in the short term depending on overall crypto market, however this is a good swing trade and any lower entry would be a better entry. You can wait for bullish volume and a catalyst if you feel its risky, or overall crypto/altcoin sentiment to increase.

Starbucks to 118SBUX has consolidated nicely at the anchored VWAP and has put in a strong low on the weekly timeframe. The easy money is for a push to ~118. Extension targets could take this as high as 145. A breach of the strong low would invalidate the hypothesis. This trade could take a few months to play out.
