filusdtI have conducted a technical analysis of 1150 using the Janne School methodology, combining both numerical and temporal analysis. Based on my findings, I believe that 1150 is poised to reach a target price of 44 rs. My analysis incorporates various
Contains IO script

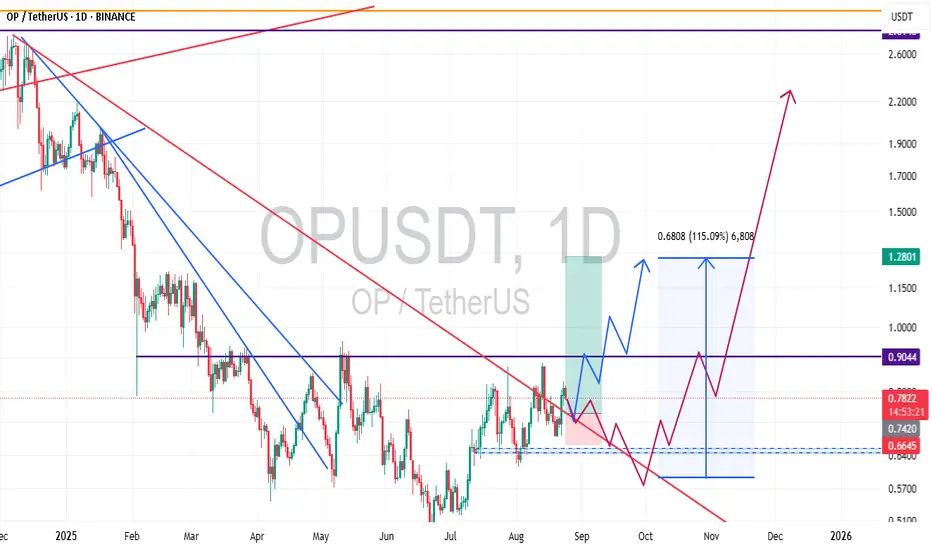
crypto pair opusdt Greetings dear friends
I have two predictions for the OP currency that you see in the picture
I hope they come true and friends will use them
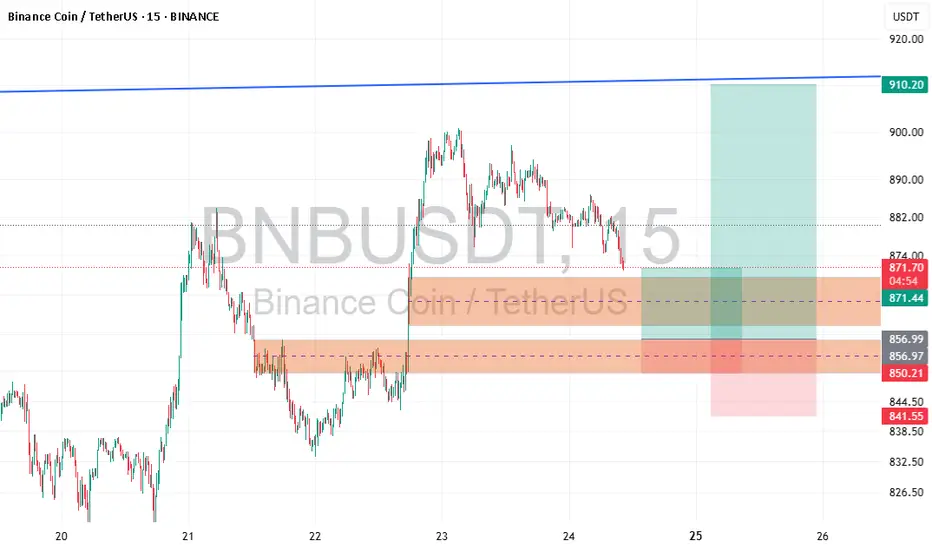
BNBUSDT long position Long position on BNB currency
in the specified range for scalping and even spot in the larger range

A look at XNY using PAR ribbonA look at XNY using PAR ribbon - Waiting for high timeframe and low to agree before taking the trade.

Next week gold expectationThis is my next week gold expectation. What are going to happen we'll see.

Discipline in Trading: How to Not Break Your Own RulesSuccess in trading rarely depends on a single "magic" indicator or strategy. Over the long term, the deciding factor becomes discipline. It is what separates those who earn consistently from those who lose their deposit in emotional trades.
Why Discipline is More Important Than Knowledge
You can know dozens of patterns, read charts flawlessly, and even possess strong analytical skills, but all of this loses its value if a trader cannot follow their own rules. The problem for most beginners is not a lack of knowledge, but that they violate their own conditions: they move their stop-loss, enter with more leverage than planned, or close a trade early out of fear.
Trading is an environment where emotions work against you. Greed, the fear of missing out (FOMO), and the hope for a "bounce" turn trading into a chaotic process. Discipline, however, allows you to turn chaos into a system.
How Discipline is Formed
The first step is a clear trading plan. Every trade must have pre-defined entry points, stop-loss and take-profit levels, as well as an acceptable risk. When a trader opens a position without these parameters, they are essentially abandoning discipline.
The second step is to adhere to risk management. Even the most precise trade does not guarantee a profit, and a trader must be prepared to accept a loss. When risk is limited in advance, it is easier to maintain discipline: you know that the loss will not destroy your deposit.
The third step is to keep a trading journal. By recording all trades, the trader sees where they break the rules and can work on correcting mistakes. It is a simple but very effective control tool.
Why It's So Easy to Break the Rules
A trader's brain seeks quick results. When a trade is in profit, you want to "take" the profit early. When it's in a loss, you want to hold the position hoping for a reversal. It is at this moment that discipline is tested: will you be able to hold the position according to the plan, or will your emotions take over?
This is why experienced traders often say: trading is not a game against the market, but a game against yourself.
Conclusion
Discipline is the foundation of successful trading. It doesn't appear overnight; it must be developed through practice and constant self-control. A clear plan, risk management, and a trading journal are simple tools that help keep emotions in check.
In the market, you cannot control the price. But you can always control yourself. And that is what determines whether trading becomes a source of stable income or an endless series of mistakes.
XRP BREAKOUT TO $5In daily timeframe there is bullish penant pattern that has potential to bring the price of xrp to $5 in the near future

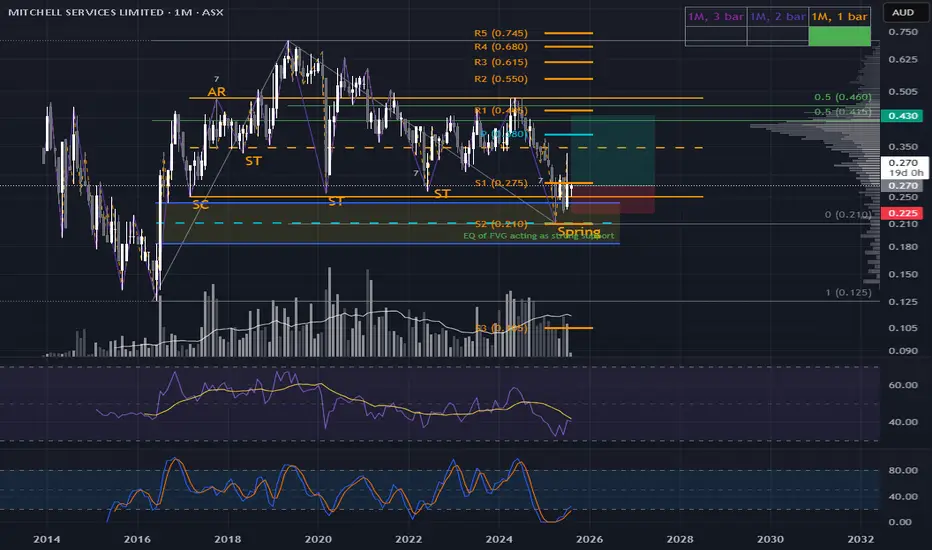
Microcap Coil: MSV Poised for a Spring UnwindMSV is shaping up beautifully — potential spring in play. Price action suggests a classic Wyckoff Phase C moment, with signs of absorption and a possible reclaim on deck. But let’s be clear: this is a microcap, and that means elevated risk.
High caution required — thin liquidity, fast moves, and headline sensitivity make this one a sniper’s game, not a swing-for-the-fences setup. If the spring confirms, it could offer a sharp asymmetric move — but only if you’re disciplined with size and execution.
Gold (XAU/USD) AnalysisFundamental Outlook:
Powell’s dovish messaging at Jackson Hole has shifted market expectations toward a Fed rate cut, suppressing the USD and fueling bullish momentum in Gold. Monday’s U.S. housing and manufacturing data will likely serve as the next catalyst for directional movement.
**Technical Framework (4H):**
• Fib retracement from $3,321 to $3,379 identifies key support at the 50%–61.8% zone ($3,350–$3,343).
• Structure: CHoCH & BOS highlight recent bullish shift; demand zone near $3,322–$3,330 held firm.
• Supply/resistance: $3,375–$3,380 cluster remains a critical ceiling.
• RSI ~ 66 suggests bullish momentum, with a slight overbought bias.
.
Trading Plan:
• Buy the dip: Enter near $3,350–$3,343, SL below $3,340, target $3,400 → $3,450.
• Buy the breakout: Aggressive long only if $3,378–$3,380 breaks decisively, SL near $3,375.
Both scenarios align with fundamental tailwinds and technical structure.
Bottom Line:
Gold remains biased bullish in the medium term. A disciplined multi-timeframe strategy—backed by structure, Fibonacci, and confirmation—offers a high-probability edge.
Note: This is an educational analysis, not financial advice. Trade responsibly.

this is how I see $ETH 1D OBV Ethereum 1D OBV break out . How I view the OBV which is a leading indicator. Ethereum to 7k

Ethereum (ETHUSD) – Technical Outlook with Key FundamentalsDescription:
Ethereum (ETH) is the second-largest cryptocurrency by market capitalization and a leading blockchain for decentralized applications, smart contracts, and DeFi ecosystems. Its network is continuously evolving, with Ethereum 2.0 upgrades focusing on scalability, security, and sustainability. Market participants often view ETH not only as a digital asset but also as a fundamental infrastructure for the Web3 economy.
This analysis highlights potential technical levels and market structure for ETH. Traders are closely monitoring price action to assess possible continuation or reversal scenarios, taking into account both short-term momentum and broader market conditions.
⚠️ Disclaimer:
This content is for educational and informational purposes only. It does not represent financial advice or investment recommendations. Always conduct your own research and risk management before making trading decisions.
+12% potential trade in KRN KRN is showing strong signs of institutional participation with sustained money inflows and a clear Point of Control (POC) shift. After weeks of volume dry-up near the base, we now see a sharp expansion in relative volume (RVol > 6x), confirming demand absorption.
The stock is also respecting my 50 SMA baseline strategy, consolidating above the moving average and building higher lows. The supply zone around ₹933 is being tested, and a clean breakout with heavy volume can open the path toward the ₹1,010+ zone.
Why Long
Institutional money inflow visible in OBV/volume structure
PPV showing accumulation and higher control zone
Extended period of volume contraction → classic re-accumulation setup
Price reclaiming and holding above 50SMA baseline
Breakout from supply with strong relative volume (RVol 600%+)


btcWatch and enjoy
I think this sharp move is a pullback to the trendline and will come down to the bottom of the trendline once again

Gold Breaks Consolidation, Enters Critical $3372-$3386 Supply Z.Chart: XAUUSD, 1H
Bias: Short-Term Bullish, but Cautious
Analysis:
Hello, traders. Let's break down the current price action on Gold (XAUUSD), which has just made a decisive move after a period of consolidation. (Note: The price levels in this analysis are based on the visual data displayed on the chart's Y-axis and Fibonacci tool, which may have a scaling discrepancy with the live ticker price.)
The Context: From Downtrend to Consolidation:
Previously, Gold was in a clear downtrend. After breaking its descending trendline around August 20th, the price action entered a consolidation phase. During this time, it has been building a support base, forming a key higher low marked "Strong" around the $3,320 level. The price ranged sideways, consistently facing resistance near the 0.382 Fibonacci level ($3,348.946).
The Bullish Breakout:
The period of indecision now appears to be over. We have just witnessed a strong, high-momentum bullish candle that has broken out from the top of this consolidation range. This move pushed the price decisively above the $3,360.491 (0.5 Fib) resistance, signaling that buyers have taken short-term control.
The Immediate Obstacle: The Confluence of Resistance
This bullish momentum has driven the price directly into a significant area of potential supply, identified by the indicator as the "Perfect Sell Zone 1". As per the indicator's label, this zone spans from the 0.618 to the 0.786 Fibonacci levels. This corresponds to a price range between $3,372.035 and $3,386.486, creating a powerful confluence of resistance that bulls must overcome.
Potential Scenarios & Key Levels:
Bullish Continuation (Primary Scenario): For the uptrend to continue, buyers must prove they can absorb the selling pressure in the current zone.
Confirmation: A decisive 1-hour or 4-hour candle close above the sell zone, specifically above the $3,386.486 (0.786 Fib) level, would be a strong confirmation of bullish strength.
Potential Entry: A more conservative long entry could be on a successful retest of the broken 0.5 Fibonacci level at $3,360.491, which should now act as support.
TP 1: The top of the supply zone at $3,386.486.
TP 2: The major swing high, and the ultimate target of this leg, at $3,409.420.
Rejection at Resistance (Alternative Scenario): This is a high-probability area for sellers to emerge and defend their territory.
If we see strong bearish price action within the $3,372 - $3,386 zone, it could signal a rejection. This might lead to a pullback towards the breakout point ($3,360.491). A break below the recent "Strong" low at $3,320 would invalidate the immediate bullish structure.
Conclusion:
Gold is at a pivotal moment. The breakout from consolidation is a clear bullish signal, but it is now facing its first major test. The price action within this precisely defined $3,372.035 - $3,386.486 supply zone will be the ultimate determining factor for Gold's next major directional move.
Disclaimer: This is not financial advice. This is for educational purposes only. Always do your own research (DYOR) before entering any trade.

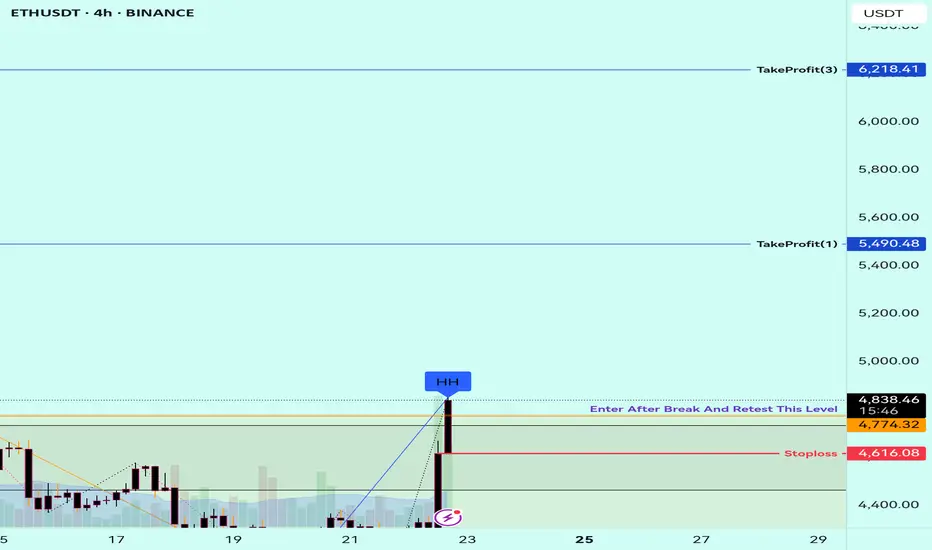
ETH Shatters Downtrend with Explosive Breakout | Bulls Take FulChart: ETHUSDT, 1H
Bias: Bullish
Analysis:
Hello, traders! We are witnessing a dramatic and powerful shift in the ETHUSDT market structure that warrants immediate attention.
The Previous Bearish Context:
For several days, Ethereum has been trading within a well-defined bearish channel. This downtrend was characterized by:
A clear descending trendline that has been respected with multiple touches, acting as dynamic resistance.
A series of confirmed lower lows and lower highs, with multiple breaks of structure to the downside (indicated by the "Strong" lows being broken).
Overall seller dominance, pushing the price down from the $4,788 high to a low of around $4,042.
The Bullish Takeover (The Main Event):
The narrative has completely changed in the last few hours. A massive wave of buying pressure has resulted in an explosive move to the upside. The key developments are:
Decisive Trendline Break: A very strong, high-momentum bullish candle has completely shattered the long-standing descending trendline. This is the most significant bullish signal on this chart, indicating the previous downtrend is now invalidated.
Break of Market Structure: This upward thrust has also broken through several previous resistance levels, including the swing high around $4,400. This constitutes a major Change of Character (CHoCH) and confirms a shift in control from sellers to buyers.
Potential Scenarios & Key Levels:
Bullish Continuation (Primary Scenario): With such strong momentum, the path of least resistance is now to the upside. Traders might look for long opportunities.
Potential Entry: A textbook entry would be on a successful retest of the broken trendline or the recently broken resistance level around $4,400, which should now act as support.
TP 1: The previous major high at $4,788 (the '1' on the Fibonacci scale).
TP 2: The next major area of resistance, identified by the indicator as the "Perfect Sell Zone 1", starting around $4,880.
Invalidation Scenario: While the breakout looks powerful, traders must always manage risk. The bullish thesis would be invalidated if the price were to reverse, fall back below the broken trendline, and close decisively below the $4,300 support area. This would suggest the breakout was a bull trap.
Conclusion:
The evidence on the chart is overwhelmingly bullish in the short to medium term. The break of the multi-day trendline is a significant technical event that cannot be ignored. The immediate bias has shifted firmly in favor of the bulls. The key will be to watch for a potential pullback for entry opportunities and to see how the price reacts as it approaches the next major supply zone around $4,900.
Disclaimer: This is not financial advice. This is for educational purposes only. Always do your own research (DYOR) before entering any trade.

BTC Bulls Make a Stand at Key Demand Zone | Is a Reversal ImmineChart: BTCUSDT, 1H
Bias: Neutral to Short-Term Bullish
Analysis:
Hello, traders! Here's a look at the current BTCUSDT price action, which finds itself at a critical juncture.
The Bearish Context (Macro):
For the past several days, Bitcoin has been in a clear and structured downtrend. This is confirmed by:
A strong rejection from the "Perfect Sell Zone 1" around the $122,000 - $120,000 level.
A series of lower lows and lower highs.
Multiple breaks of structure (marked as "Strong" lows being broken) to the downside, confirming bearish momentum is in control.
The Bullish Reaction (Micro):
Despite the strong bearish trend, the price has now entered a significant "Perfect Buy Zone 1" between approximately $111,500 and $108,500. We are seeing a very aggressive reaction from this area:
A massive bullish engulfing candle has formed, showing that buyers have stepped in with force.
This push has resulted in a minor break of structure to the upside (the latest "Break" label), which could be interpreted as a Change of Character (CHoCH). This is the first potential sign that the short-term bearish momentum is weakening.
Potential Scenarios & Key Levels :
Bullish Reversal / Pullback: If the bulls maintain control, the immediate target would be the previous support levels, which may now act as resistance.
TP 1: $114,400 (Fibonacci 0.786 level)
TP 2: $115,700 (Recent consolidation area)
TP 3: $116,875 (Fibonacci 0.618 level)
An ideal entry for a long position could be on a successful retest of the recently broken resistance around $112,800.
Bearish Continuation: If this bullish push is merely a liquidity grab and fails to hold, a break below the "Perfect Buy Zone" (a close below $111,500) would invalidate the bullish scenario. This would likely signal a continuation of the macro downtrend toward lower price targets.
Conclusion:
We have a classic conflict: a dominant bearish trend versus a strong bullish reaction from a key demand zone. While the immediate momentum favors the bulls, caution is advised. A confirmation of a higher low would strengthen the case for a reversal.
Disclaimer:
This is not financial advice. This is for educational purposes only. Always do your own research (DYOR) before entering any trade.

SUPRIYA LIFE - BUYNSE:SUPRIYA Weekly parabolic formation with accumulation at location may give more and strong fireworks on upper side.

MMP INDUSTRIES - BUYNSE:MMP Weekly rounding bottom and accumulation exactly at location of 4 years. May continue further rally to near term.

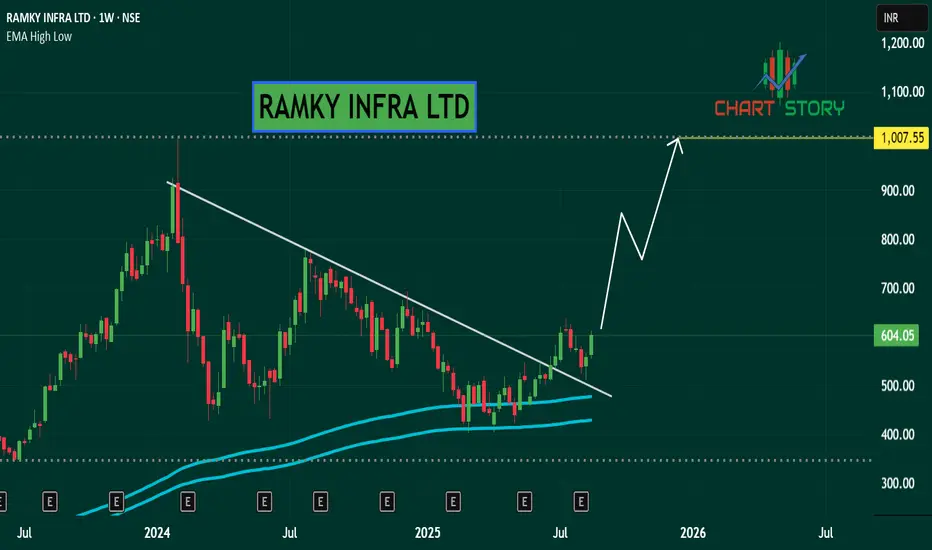
RAMKY INFRA - LONGNSE:RAMKY Weekly location with momentum may continue stock to climb till previous swing high.
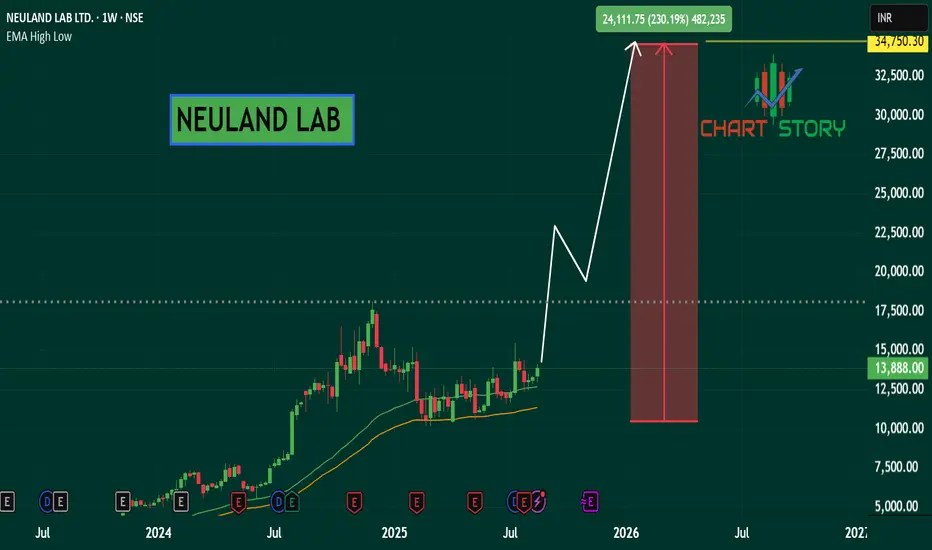
NEULAND LAB - BUYNSE:NEULANDLAB Weekly parabolic formation may continue trend like fast and furious momentum in short to medium term.
CIPLA - LONGNSE:CIPLA Weekly parabolic formation may double stock price from current levels. As stock already in momentum from last 1 year.
