Cardano Maintains Bullish Structure as ADA Targets $1.19Cardano (ADA) continues to display strength on the weekly chart, holding firmly above $0.88 support with consecutive higher highs and higher lows. The structure favors continuation, with $1.19 emerging as the next major resistance.
Cardano has established itself as one of the more structurally bullish altcoins in the current cycle, with its weekly chart showing a clear pattern of consecutive higher highs and higher lows. This structure confirms a strong upward trajectory that remains intact despite minor pullbacks. Currently, ADA is retesting the $0.88 support zone, and early price action has shown a bullish reaction from this level. The defense of this region will be key in maintaining momentum for a rotation higher.
Key Technical Points:
- $0.88 Support: Critical level now being retested, providing the base for continuation.
- $1.19 Resistance: Next high-time frame barrier to overcome, likely to attract profit-taking.
- Point of Control Cleared: Price action is above the POC, shifting focus to the value area high as next volume resistance.
From a technical standpoint, ADA’s positioning above the point of control (POC) is a bullish sign in itself. The POC is often where the largest amount of trading activity has taken place, and regaining it typically reflects renewed buyer strength. With this reclaim, ADA has opened the path to challenge the value area high. If the value area high is exceeded, it would likely trigger a fresh wave of bullish expansion toward the $1.19 resistance level.
The importance of the $0.88 support cannot be overstated. Not only does it act as a structural pivot, but it also represents a zone where demand has consistently shown up to absorb supply. As long as ADA can sustain closes above this area on higher time frames, the bullish bias remains valid. Conversely, failure to hold $0.88 could shift focus back to lower levels, but at present, market structure strongly favors continuation upward.
Volume analysis also adds weight to the bullish case. Trading activity around the $0.88 region shows healthy accumulation, with buyers actively stepping in during retests. This behavior is typical of strong uptrends, where participants use pullbacks as opportunities to enter rather than exit. The presence of demand at support aligns with the ongoing weekly structure and signals confidence in higher valuations.
What to Expect in the Coming Price Action
Cardano remains well-positioned for further upside as long as $0.88 holds. The most immediate objective is to reclaim the value area high, which would likely ignite momentum toward $1.19 resistance. Consolidation above support would only strengthen this setup, as it would confirm market acceptance of higher levels. Traders should watch for continuation patterns and volume confirmation, as these will dictate the timing of ADA’s next move higher.
Contains IO script

$VIRTUAL BULLISH BAT PATTERN. Price is hovering on the critical support zone. If the price manages to hold this level, this could be a fantastic entry.
IMO 40% chance that this will play out.

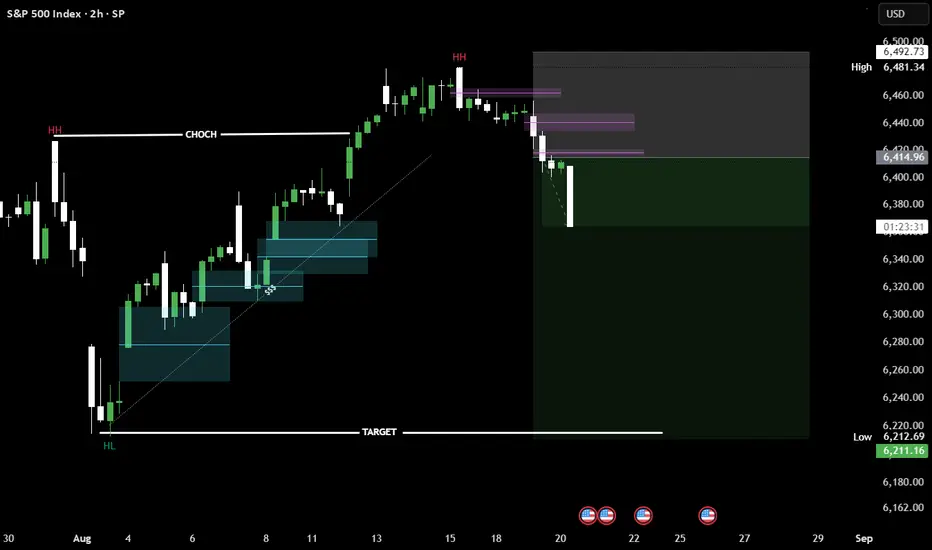
SP500- liquidity hunt in playPrice formed a Change of Character (CHOCH) after printing equal highs, signaling weakness.
Supply zones got respected, confirming bearish order flow.
Now targeting liquidity at the prior Higher Low (HL) around 6210.
#ETH — A Trade Executed to the EndOn July 29, the indicator on the 1H timeframe triggered a long signal for Ethereum around the $3800 level. At that moment, many traders doubted the strength of the trend as the market moved sideways. Nevertheless, the algorithm identified the optimal entry point and opened the position.
From that day forward, the indicator systematically guided the trade, adjusting support levels and highlighting partial take-profit zones. The move developed steadily, and on August 14 the position was finally closed near $4500.
The trade delivered approximately +18% profit over two weeks of holding. This result demonstrates not only the accuracy of the signal but also the algorithm’s ability to keep a position open until the trend’s potential is fully realized.
This example highlights the key advantage of the indicator: it removes emotions and allows traders to follow a structured system. In a market where uncertainty often misleads even experienced participants, a disciplined algorithmic approach makes it possible to extract maximum value from price movements.

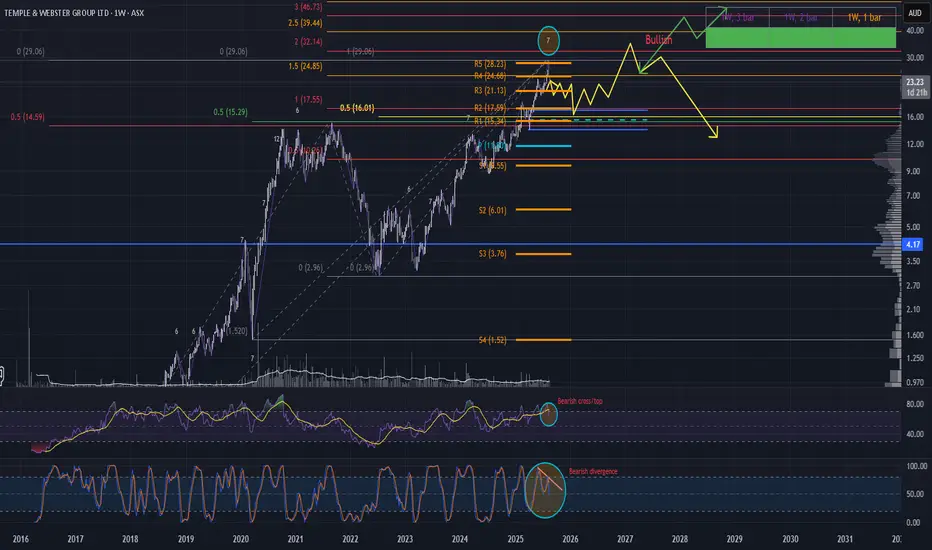
Don’t Short It, But Don’t Chase It—TPW’s Setup Demands PatienceTemple & Webster is flashing short-term bearish signals. We've just seen a 7-week rally culminate in a bearish hammer on a volume spike—a textbook exhaustion move. According to the Gann rule, a trend reversal or pause is often expected after 7–10 consecutive bars in one swing, and this setup fits that criteria.
Adding fuel to the bearish thesis:
Bearish divergence on the Stoch RSI
Bearish cross on the RSI
Despite this, I’m not interested in shorting—price is still in a clear uptrend, and I don’t short rising markets. Discipline over impulse.
Area of Interest (AOI): $15.29 Zone
If price pulls back, the previous ATH zone around $15.29 becomes a high-probability support area. This zone is stacked with confluence:
Major 50% Fib level projected from swing low to ATH
Macro 50% level from July 2022 low to ATH
Large demand wick already printed in this zone
If price reaches this AOI and the broader market remains strong, I wouldn’t expect it to linger here long. But no need to front-run—keep it simple and take it one step at a time.
Potential Scenarios from AOI
If price finds support and rallies from the AOI zone, two paths could unfold:
Slight Higher High + Volume Spike → Significant Pullback This would suggest a final push before a deeper correction—watch volume and candle structure closely.
Bullish Continuation (Green Line Path) Price breaks out cleanly and continues the uptrend. If this plays out, we reassess and ride the momentum.
Either way, we cross that bridge when we get there. For now, eyes on the AOI and let price tell the story.
*please note arrows are not time analysis just expected pathing
ETH VS BTCHi there!
What to hold BTC or ETH?
High probability correction is coming!
There is another scenario too because EW is relative E=mc2 :-)

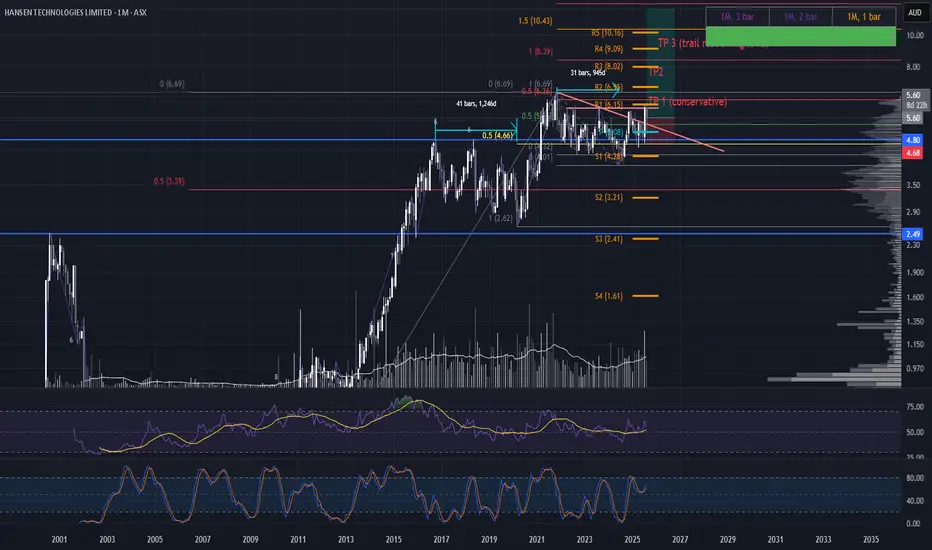
HSN Shakeout Play: Smart Money Reloading for ATH Breakout?Hansen Technologies (HSN) — Strategic Long Setup
Hansen Technologies is shaping up as a compelling long-term play. On 20/08/25, a slight earnings miss (−0.07%) triggered a sharp intraday sell-off, with price spiking down to $5.00 before closing at $5.60, forming a bullish hammer. This candle reflects late retail capitulation into aggressive smart money absorption—a classic shakeout signature.
Confirmation Trigger To validate this as a true shakeout, price must close above the 20/08/25 high of $5.87. A reclaim of this level would likely ignite a strong rally toward all-time highs, as trapped shorts and sidelined longs scramble to reposition.
Monthly Structure — Bullish Reaccumulation
Price has been reaccumulating for ~4 years above the 2016 ATH, building a solid structural base.
The descending trend line has been broken and potentially successfully retested via the 20/08/25 spike low.
Price has also tested the yearly pivot and the 50% Fib level projected from the COVID low to ATH.
This multi-timeframe alignment suggests institutional accumulation and long-term bullish intent.
Trade Scenarios
Aggressive Long Entry: Enter now while price is still consolidating near the spike low. This approach anticipates a breakout and positions early. The stop loss would be placed just below the monthly 2-bar swing low to protect against deeper downside.
Confirmation Long Entry: Wait for price to reclaim and close above $5.87, the high of the 20/08/25 candle. This adds confluence and confirms the shakeout thesis. The stop loss for this setup would sit just below the spike low at approximately $5.00, giving room for volatility while protecting capital.
$NEAR IdeaStacked BBs near the GP of the swing high to low, not a bad place to look to long if we get it. Applying small risk.

swing cityanother update on the Double Smoothed Stochastic swing trading
Back into a good area, we have Jackson's hole later in the week which may also create some news for a pump or a dump, either way the Double Smooth Stochastic in a good position.

#BTC Update 19.08.2025🚀 #BTC Update 🚀
As I mentioned in my last analysis, the price has now reached the first black line 🖤.
We can clearly spot a divergence here — which often signals a potential turning point.
👉 From this zone, price can either bounce back strongly or make a move to retest the second black line for confirmation. Both scenarios are on the table, so stay sharp and watch closely.
🔥 The most exciting part, however, is not just BTC’s price… but what’s happening with BTC Dominance (BTC.D). That’s where the real interesting move is developing, and it could guide us toward the next big opportunity.
Patience + Discipline = Profits 💯
Let’s see how the market unfolds. Stay motivated and remember — every move brings us closer to clarity.

Altcoin Season Vibes Loading🚀Altcoin Season Vibes Loading ... 🚀
Even though the price of Bitcoin has dropped sharply, the BTC Dominance (BTC.D) is still stuck in its range with no clear reversal or pump confirmation. 🔄
👉 That’s actually a super bullish signal for Altcoins! 💎✨
Why? Because when BTC loses strength without dominance shooting up, it often means capital is quietly flowing into Alts. 🌊📈
🔥 Stay focused, stay patient — the opportunities are building up. This could be the moment where strong Altcoins start shining!
\#Altcoins #BTC #Crypto

$CELH Short to the Money Flow Line (Overbought)Here’s a refined analysis of your $52 Sept 29 puts on CELH, integrating both technical insights (including the Money Flow POC you mentioned) and the broader market and analyst sentiment:
Analyst Sentiment & Market Narrative
Analyst Price Targets & Ratings:
TipRanks (18 analysts): Consensus is a Strong Buy, with an average 12‑month price target of $57.94 (slightly above current levels). High: $68; Low: $40.
MarketBeat (19 analysts): Consensus Moderate Buy, average target $52.28 — indicating around 13.5% downside from current prices.
StockAnalysis (17 analysts): Consensus Strong Buy, average target $53.41, implying roughly 12% downside.
Investing.com (20 analysts): Consensus Buy; average target ~$57.93, with downside of ~4%.
Investing.com
MarketWatch averages: High $68, Median $60, Low $40, Average $59.28.
Public.com (22 analysts): Overall Buy consensus (50% Strong Buy + 32% Buy); average target around $64.73.
Takeaway: Analysts are unevenly split. Some expect continued upside to ~$60–65, while others anticipate a retreat into the low–mid $50s. There's a realistic zone between $52–$55 where many believe value may reside—or where downside could play out.

starting to close out some shortsscaling out of some of my shorts. deviation below 112 coming.larger drop coming in sept not aug

BTC.D PlanBTC.D
Entering into the bottom of this weekly parallel channel that’s been going on since 2023. Taking fibs from last cycles ATH to this cycles ATL we see that we almost tapped the .786 before coming down. Taking fibs from the lows of December 2024 to highs of June 2025 we see that the .618, .65, .705 and .786 are all on a weekly OB that is acting as DEMAND. There is a possibility that this acts as support and we get a push off of it. If not, then lower we go, to possibly as low as ~54%.

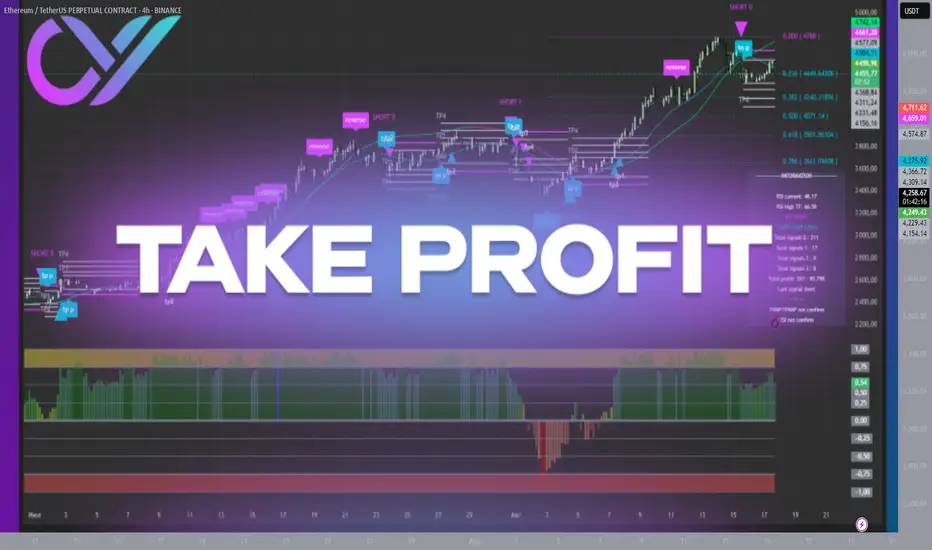
Take Profit in Trading: How Profit Levels WorkIn trading, profit isn’t secured when you “guess” the market direction — it’s secured when you already know where to close your trade. For this purpose, traders use a tool called Take Profit (TP).
What is Take Profit?
Take Profit is a pre-set price level at which your position automatically closes with profit. In essence, it’s the opposite of a stop-loss, which protects against loss. A TP removes the need to constantly monitor charts and ensures you capture profit exactly where you planned.
Example: A trader enters a long position on BTC at $114,000 and sets a TP at $118,000. Once the price touches that level, the trade closes automatically and profit is secured.
Why Do We Need Take Profit Levels?
The key role of TP is discipline. Without clear targets, traders risk closing trades too early or waiting too long until the market reverses. Take Profit levels help to:
lock in profit step by step,
avoid emotional decision-making,
move stop-loss to breakeven after reaching the first target.
Take Profit Levels (TP1, TP2, TP3, TP4)
In professional trading, as well as with CV_Pro, multiple TP levels are often used:
TP1 — the first target. Partial profit is taken, and stop-loss is moved to breakeven.
TP2 — confirms trend strength and allows further profit-taking.
TP3 and TP4 — extended goals for strong trend moves, when the market offers maximum potential.
This approach is called partial profit-taking. Instead of waiting for the “perfect” level, traders secure profits gradually. This reduces risk and increases consistency.
Take Profit and Trade Management
Working with TP is always a balance between greed and discipline. If the market moves in your favor, TP helps you capture more from the trend, and if the market reverses, you already leave with gains. Remember: it’s better to take profits according to plan than to wait and lose the entire move.
Conclusion
Take Profit is the foundation of professional trading. It turns random entries into a structured strategy. By using TP levels, a trader gains not only profit but also confidence that their trading is controlled and systematic.
ethusdtI think the price will rise to higher levels in the coming period, and we must wait for more time and give it a chance. Continue and be patient. It is only a matter of time.

#Bitcoin Double Bearish Divergence!Using the ChartPrime Oscillator Pro, a double bearish divergence has formed on the weekly timeframe, which could play out between Sept. and Nov.
Medium term, the price could retest the $90K level, which aligns with a major support trendline.

ETH/USD: Will ETH Crash Back to $3,800?Ethereum has demonstrated a strong bullish trend in August, with prices approaching key resistance levels. Analysts suggest that a sustained break above $4,800 could propel ETH toward $5,500–$6,000 by the end of the month.
Institutional interest remains robust, with significant inflows into Ethereum-based ETFs and increased holdings by digital asset treasury firms like Bitmine Immersion Technologies and Sharplink Gaming.
* Resistance Levels: $4,800, $5,000, $5,500
* Support Levels: $4,000, $3,800
* Key Indicators: Strong Relative Strength Index (RSI) and bullish Moving Average Convergence Divergence (MACD) suggest continued upward momentum.
Ethereum is poised for a potential breakout. A decisive move above $4,800, supported by strong trading volumes, could initiate a rally toward $5,500–$6,000. Conversely, a drop below $4,000 might lead to a retest of the $3,800 support zone.

$HYPE Cup and Handle on the Daily chart potential for new ATHTaking a look at the daily chart on GETTEX:HYPE , There is a potential for the typical cup and handle pattern to launch us to new all time highs. Obviously this low from today needs to stand and we will need to start the move upward. Once the new ATH is hit, I believe price discovery will be propelled by the short liquidations at the 50 mark. First time posting an idea so show some love for #higherliquid

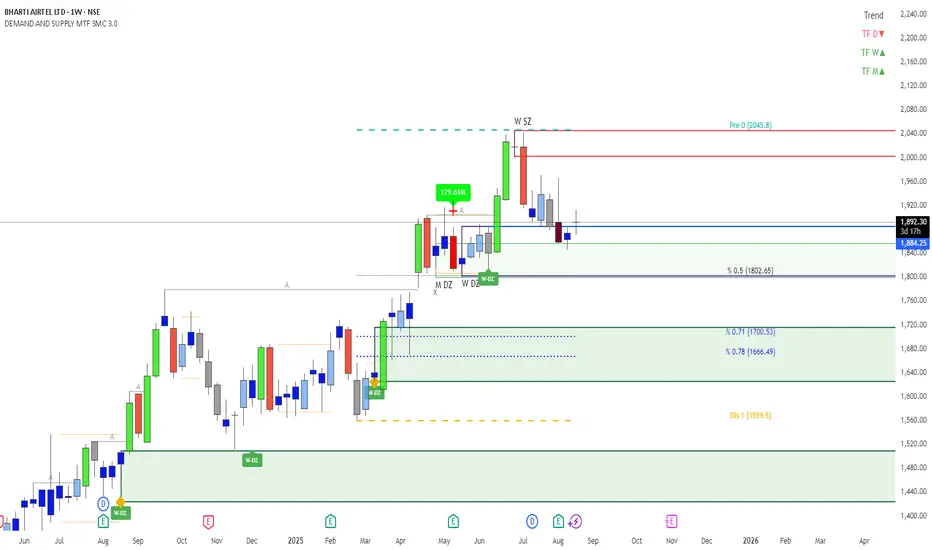
BHARTIARTL - Monthly and Weekly Nested Demand Zone BHARTIARTL is ready for a strong upward move from the Monthly Demand Zone and Weekly Demand Zone.
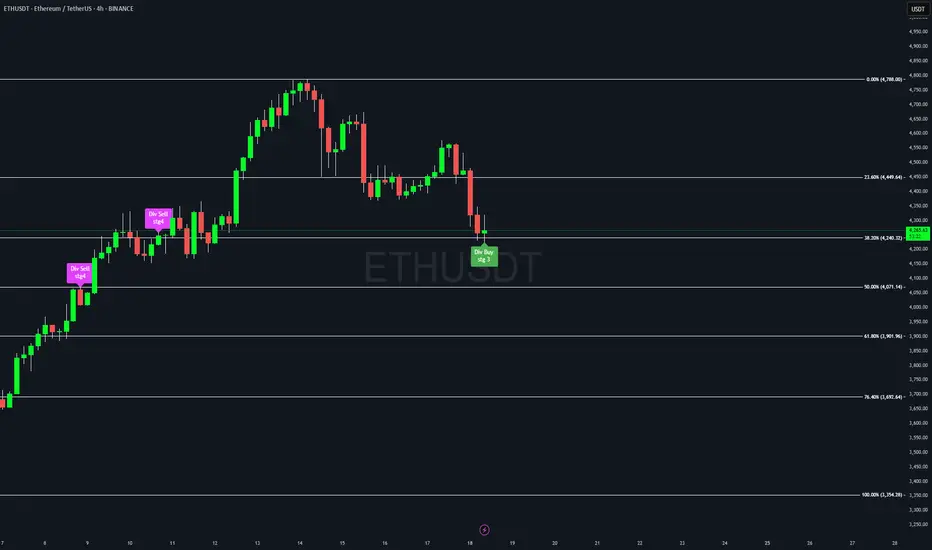
ETH pullback ?ETH presents a higher probability of a pullback following a buy signal of opportunity sinper indicator + near the 38% Fibonacci retracement. Price could either retest the recent swing high or retrace to the 23% level before resuming the corrective move. Traders should monitor key levels for confirmation
BTC possible pullbackPotential BTC pullback detected. Divergence observed on STGY4 opportunity sniper indicator, confirmed by a bounce at the 78.2% Fibonacci level. Waiting for bar close to confirm.

The Distribution Cliff: Bitcoin's Wyckoff Roadmap Vs The Mag 7Bitcoin vs Magnificent 7: Mapping the Final Distribution Phase
Where We Are Now
Based on this analysis, Bitcoin appears to be entering the UT/UTAD phases - the final distribution stage where smart money exits positions before the markdown begins.
What This Means
If this framework proves correct, we're approaching the cliff phase - a systematic markdown that could deliver a massive collapse. Unlike previous corrections, this would represent the completion of the entire distribution cycle, not just another dip to buy.
The Technical Setup
The Wyckoff model suggests that current price action, while appearing bullish to most participants, actually represents the final stages of institutional distribution. The "smart money" exits during these upthrust phases, leaving retail and late institutional buyers holding positions into the markdown.
Bottom Line
This technical framework provides the roadmap for how the final collapse might unfold - not as a sudden crash, but as a systematic distribution process culminating in the markdown cliff.
The next few months will reveal whether this framework proves accurate or just an unfounded cynical view of Bitcoin!
