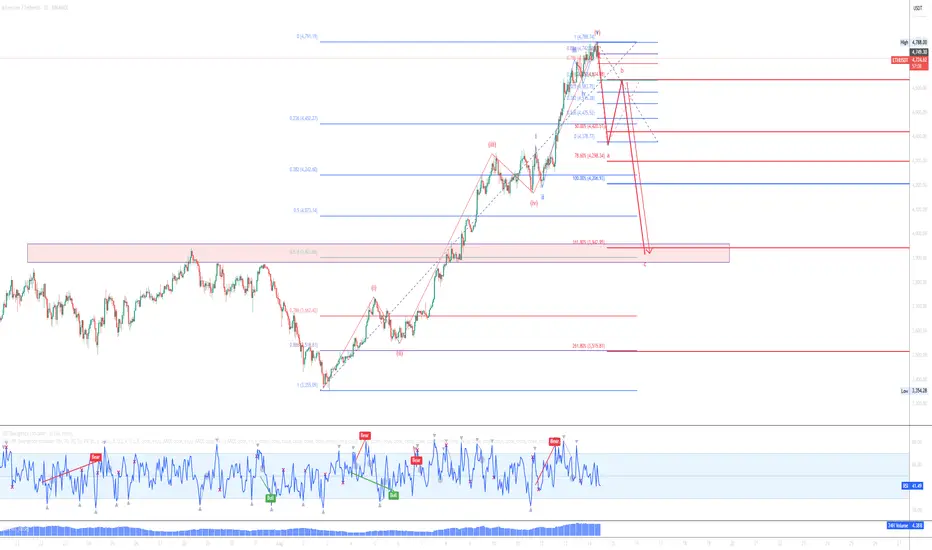
ETH/USD: Ethereum on the Edge of History!Ethereum recently surged over 50% in the last month, currently trading near $4,700, approaching its all-time high of ~$4,868 from November 2021.
Weekly momentum remains strong; Ethereum is riding a bullish channel. Some technical indicators hint at potential overbought conditions, but these can persist in strong rallies.
*Support lies between $4,400–4,500, with more substantial support around $4,145 and down to $3,800–3,700 in case of deeper pullbacks
*Most indicators point toward a continuation of the bullish channel, with potential for slight corrections as Ethereum tests key resistance levels.
Ethereum is currently in a strong bullish phase, trading near its all-time high, with momentum supported by institutional inflows, regulatory clarity, and recent protocol upgrades. Short-term projections suggest a possible breakout above $4,800, with targets between $5,200 and $6,000 in the coming weeks. By the end of 2025, most forecasts see ETH reaching at least $7,500, while more aggressive scenarios point toward $10,000 or higher.
In the longer term, Ethereum’s expanding role in stablecoins, decentralized finance, and institutional adoption could drive substantial price appreciation, with major banks forecasting $25,000 by 2028 and some optimistic models aiming for $40,000+ by 2030. However, this growth path is not without risks; potential market corrections, regulatory changes, and competition from other blockchain platforms could affect momentum.
Overall, Ethereum remains one of the most promising digital assets in the crypto market, with both technical and fundamental factors aligning for continued growth, provided broader market sentiment stays positive.
Contains IO script

Ready for correction?Hi there!
ETH is at ideal level where correction can start!
We can take look the BTC chart and it is the same story and the correlation between ETHBTC also!
Our most important level for watching is 3940 + -!
Good luck traders and Bears
$LINK / USDT – Indicators Not Maxed, Big Picture Thinking.ChainLink is hovering just above Buy Zone 2 — price hasn’t tapped it yet, but it's close. This zone around $13.21 to $12.50 remains the key area of interest. If the market gives us that dip, it could be a solid spot for high-conviction entries.
Looking at the 3D timeframe, indicators like the MACD, stochastics, and other oscillators are nowhere near overheated. We’re not seeing blow-off tops or maxed-out momentum — which tells us this market still has room to run. At the same time, it’s not “cheap” forever.
If you're thinking longer-term, this is the kind of setup where reasonable, staggered accumulation makes a lot of sense — especially in utility-heavy, fundamentally proven projects like ChainLink. You don’t need to go all-in, but building exposure in anticipation of a reaction from these zones is a rational approach.
Key Levels:
🟢 Buy Zone 2: Untouched, watching $13.21–$12.50
🟢 Buy Zone 3: $11.95–$10.00 (big bids if BTC corrects)
🔴 TP1: $15.15
🔴 TP2: $19.50
🎯 Final Target: $22.25–25.00
📈 We may not have the entry yet — but the structure is shaping up.
📡 Follow @BahtMover on X for real-time entries, updates, and volume-driven setups.

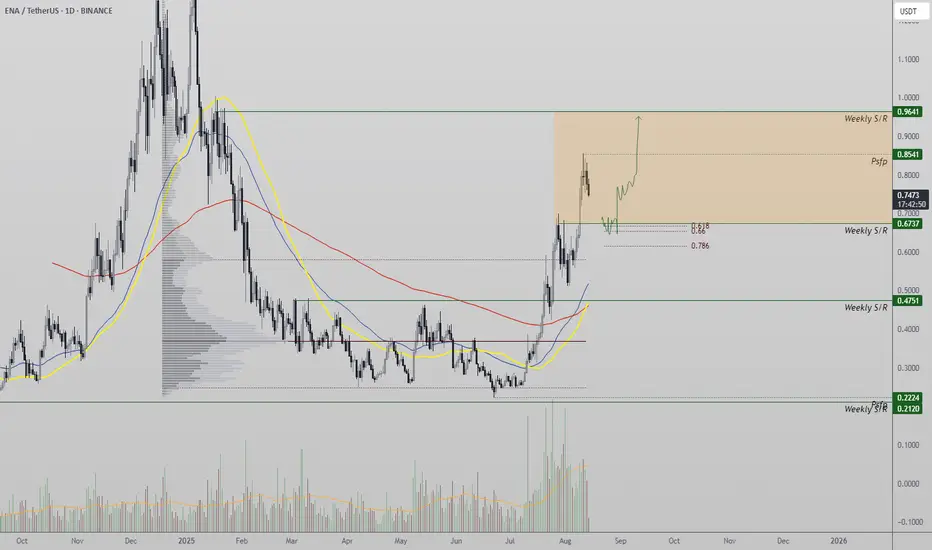
Ethena Corrective Move Setting Up for higherEthena (ENA) is consolidating after a strong bullish expansion, with price action now approaching a critical support zone. Technical indicators suggest a higher low could trigger the next leg up toward $0.96.
Following a notable rally from recent lows, Ethena’s price action has shifted into a corrective phase, giving bulls an opportunity to reset before potentially driving the market higher. The 67-cent support level, in confluence with the 0.618 Fibonacci retracement, is the immediate area to watch for a possible bullish reversal and continuation of the uptrend.
Key Technical Points:
Support Level: $0.67 high-timeframe support in confluence with the 0.618 Fibonacci retracement.
Resistance Target: $0.96 as the next major upside objective.
Market Structure: Bullish bias remains intact despite current corrective move.
Since establishing a strong bullish expansion from the lows, ENA has entered a healthy corrective phase, allowing the market to absorb recent gains. This retracement has brought price action closer to the 67-cent high-timeframe support level, which is aligned with the 0.618 Fibonacci retracement—a widely regarded area for trend continuation in technical analysis. Holding this zone could confirm a higher low formation, an essential ingredient for sustaining the current bullish market structure.
The bullish outlook remains supported by consecutive higher highs and higher lows on higher timeframes, indicating that momentum has not been broken. From a structural perspective, the market remains in an uptrend, and the current decline appears to be a standard pullback within that trend rather than the start of a reversal. A confirmed higher low at $0.67 could act as a springboard for renewed buying pressure.
In addition to the price structure, the volume profile shows healthy participation levels during the prior rally, suggesting that there is underlying demand. For continuation to $0.96, ENA will need to see a rise in bullish volume upon retesting support. This would strengthen the likelihood of price reclaiming intermediate resistance zones before targeting the next high-timeframe level.
What to Expect in the Coming Price Action:
If $0.67 holds as support and a higher low forms, ENA is likely to resume its bullish trend, with $0.96 being the next target on the upside. A close below $0.67 would weaken this outlook, potentially triggering a deeper retracement before any further upside attempts.
AUDNZD Technical OutlookWhat I See!
AUDNZD is showing a rising wedge formation after an extended move higher from the May swing low. Price is reacting around the 1.1000 psychological level, which overlaps with a daily Fair Value Gap (FVG) and a prior supply zone.
From a structural perspective, a move toward the bullish daily FVG near 1.0850 is a possible short-term development. If this zone holds, the chart could continue to build toward the equal highs around 1.1181.
Alternatively, invalidation of the 1.0850 daily FVG could open the door for a deeper decline, potentially completing the wedge pattern and drawing price toward lower demand areas.
This chart is presented for educational discussion of market structure and technical patterns only. It is not a trade signal or financial advice.
💬 Got questions? You’re welcome to share your thoughts in the comments.

Buy Trade Strategy for ZORA: Empowering the Creator EconomyDescription:
This trading idea highlights ZORA, a Web3 protocol focused on revolutionizing the creator economy through decentralized NFT marketplaces and permissionless minting. ZORA empowers artists, developers, and communities to create, sell, and distribute digital assets without intermediaries, fostering an open and fair digital economy. With the rising adoption of NFTs and the growing shift towards decentralized ownership, ZORA’s innovative infrastructure positions it as a strong contender in the blockchain-powered creative sector. Its emphasis on accessibility, community governance, and scalability gives it significant long-term potential.
Nonetheless, the cryptocurrency market remains highly volatile, and ZORA is not immune to rapid price fluctuations influenced by regulatory developments, macroeconomic events, and evolving market sentiment. Investors should approach with a clear risk management plan and avoid overexposure.
Disclaimer:
This trading idea is for educational purposes only and should not be taken as financial advice. Trading cryptocurrencies like ZORA carries substantial risks, including the possibility of a total loss of investment. Always conduct your own due diligence, assess your financial position, and consult with a qualified financial advisor before making any investment decisions. Past performance is not indicative of future results.

SHIB/USDT at a Crucial Crossroad!Shiba Inu is exhibiting a neutral to slightly bullish trend. The price is currently testing the support level around $0.00001350, with resistance near $0.00001400. A breakout above this resistance could signal a continuation of the upward momentum.
*Bullish Scenario: A breakout above $0.00001400 could lead to a rally towards $0.00001500.
*Bearish Scenario: A drop below $0.00001350 may result in a decline towards $0.00001250.

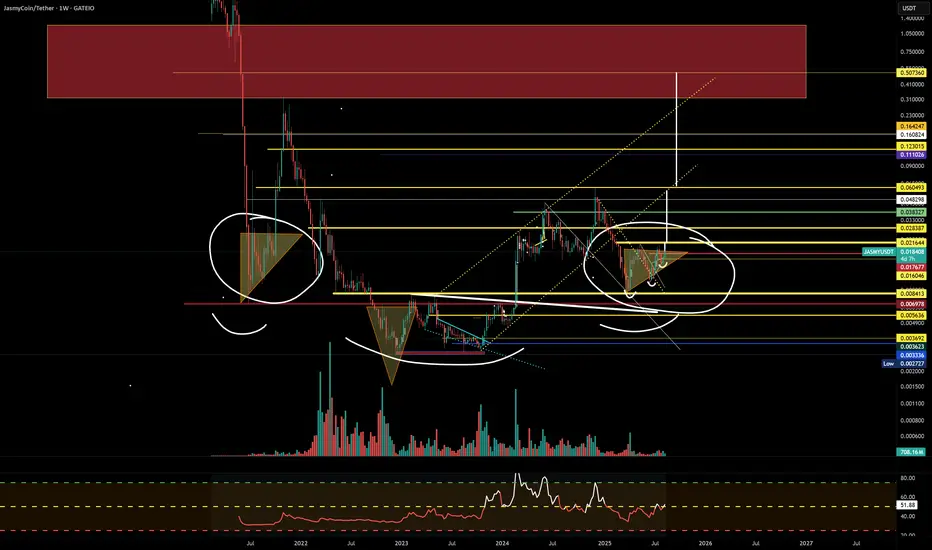
INVERSE HS MACROBeen following JASMY for a couple years now...took it from the lows and sold waiting for the macro right shoulder to form. No coincidence that it is putting in the same macro weekly ascending triangle on the right shoulder that it did on the left shoulder from 2021. It held the other day while the market dumped and it now in a LTF bull flag formation. If it runs back to neckline of the ascending triangle it could be a cascade breakout the likes of 2021. Good luck
$COINBASE:BTCUSD Possible Long SetupAfter a 3% pullback, COINBASE:BTCUSD is now sitting in a key support zone.
We’re starting to see momentum shift out of oversold territory on the Oscillator Matrix, which could spark a bounce from here.
Overall, this looks like a solid trade setup with a strong risk-to-reward potential.

Buy Trade Strategy for SUI: Leveraging High-Speed BlockchainDescription:
This trading idea focuses on SUI, a next-generation Layer-1 blockchain designed for exceptional scalability and low-latency transactions. Developed by Mysten Labs, SUI utilizes a unique parallel execution engine that significantly boosts transaction throughput, making it highly competitive in the evolving blockchain ecosystem. Its innovative architecture supports complex decentralized applications (dApps) and Web3 experiences, attracting developers and investors seeking high-performance solutions. With growing adoption, strategic partnerships, and strong community support, SUI shows potential for long-term value within the blockchain industry.
Nevertheless, the cryptocurrency market is highly volatile, and factors such as regulatory changes, market sentiment, and technological shifts can rapidly affect asset prices. As with any investment in digital assets, proper risk management and careful evaluation are essential.
Disclaimer:
This trading idea is provided for educational purposes only and should not be taken as financial advice. Investing in cryptocurrencies like SUI involves substantial risk, including the potential loss of your entire capital. Always conduct your own research, consider your financial circumstances, and seek guidance from a professional advisor before making investment decisions. Past performance is not indicative of future results.

Buy Trade Strategy for DEEP: Advancing Blockchain Data Privacy Description:
This trading idea highlights DEEP, a cryptocurrency project focused on delivering advanced data privacy and secure communication solutions through blockchain technology. DEEP aims to empower users with tools that protect sensitive information, facilitate encrypted transactions, and ensure full control over personal data in a decentralized environment. As digital privacy concerns continue to grow globally, the demand for blockchain-based security solutions is expected to rise, potentially increasing DEEP’s adoption and utility across various sectors, including finance, healthcare, and enterprise communication.
Still, the cryptocurrency market is highly volatile, and factors such as regulatory actions, evolving competition, and changes in market sentiment can impact DEEP’s performance. While the project’s fundamentals are promising, investors should consider both its potential and its risks before entering a position.
Disclaimer:
This trading idea is for educational purposes only and should not be regarded as financial advice. Cryptocurrencies like DEEP involve high risk, including the possibility of losing your entire investment. Always conduct your own research, evaluate your risk tolerance, and seek professional financial advice before making investment decisions. Past performance is not indicative of future results.

Buy Trade Strategy for RAY: Fueling Solana DeFi and LiquidityDescription:
This trading idea is centered on RAY, the native token of Raydium, a leading automated market maker (AMM) and liquidity provider built on the Solana blockchain. RAY powers a platform that offers lightning-fast trades, deep liquidity pools, and seamless integration with the wider Solana DeFi ecosystem. As Solana continues to expand its network of decentralized applications, Raydium benefits from increased user activity and transaction volume. RAY also plays a key role in governance, staking rewards, and incentivizing liquidity, making it a vital asset within one of the fastest-growing DeFi environments.
Despite its strong fundamentals, the cryptocurrency market remains highly volatile, with factors such as network performance, regulatory developments, and macroeconomic conditions influencing price movements. Trading RAY requires careful consideration of risks and sound portfolio management.
Disclaimer:
This trading idea is provided for educational purposes only and should not be considered financial advice. Investing in cryptocurrencies like RAY carries significant risk, including the possibility of losing your entire investment. Always conduct your own research, evaluate your risk tolerance, and consult with a qualified financial advisor before making any investment decisions. Past performance is not indicative of future results.

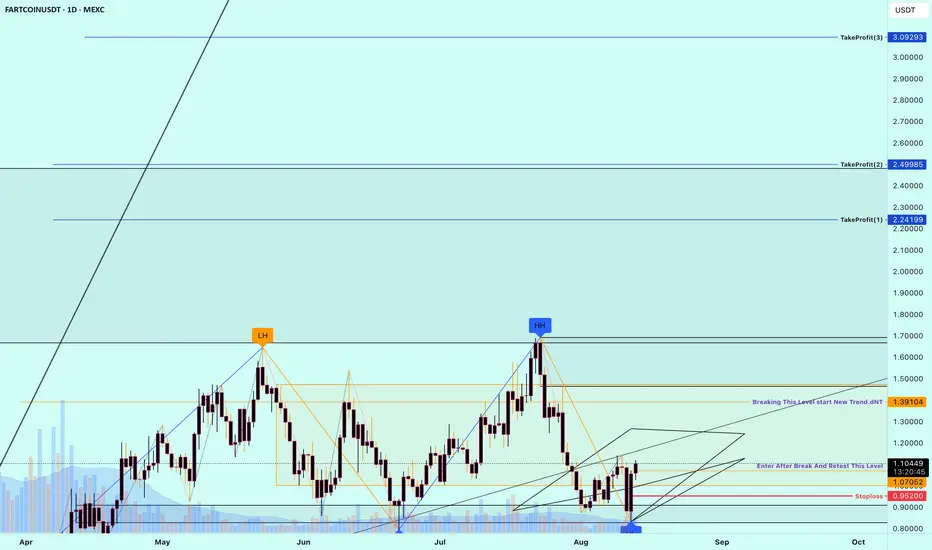
Buy Trade Strategy for FARTCOIN: Riding the Hype of Meme CryptoDescription:
This trading idea revolves around FARTCOIN, a meme-based cryptocurrency that has attracted attention for its humorous branding and rapidly growing online community. While initially launched as a parody token, FARTCOIN has leveraged its viral appeal to build a strong social media presence and foster active community engagement. Meme coins like FARTCOIN often thrive on market sentiment, influencer promotion, and community-driven momentum, which can lead to short-term surges in value. Its appeal lies in the combination of entertainment and speculative opportunity, making it a high-risk, high-reward asset within the crypto market.
That said, meme coins are extremely volatile and heavily dependent on hype cycles, with prices capable of rising or falling dramatically in short periods. Investors should be aware that FARTCOIN has limited underlying utility compared to fundamentally driven projects, and its performance will largely depend on community interest and viral marketing trends.
Disclaimer:
This trading idea is for educational purposes only and should not be considered financial advice. Trading cryptocurrencies like FARTCOIN carries substantial risks, including the potential for total loss of capital. Always perform independent research, evaluate your risk tolerance, and consult with a qualified financial advisor before making any investment decision. Past performance does not guarantee future results.
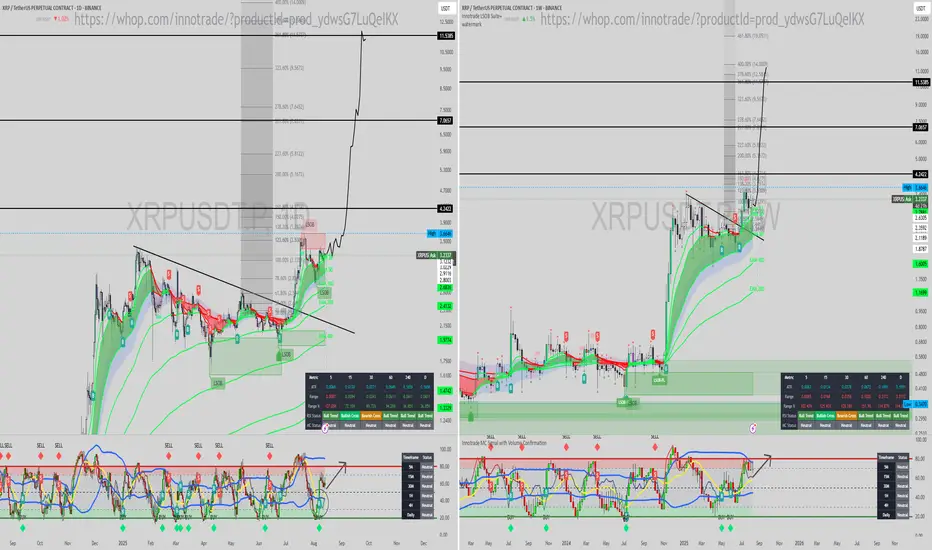
XRP RALLY BEGINS "THE CALM BEFORE THE STORM"🚀🚀🚀
SUBSCRIBE, BOOST AND COMMENT IN ORDER TO GET HIGH QUALITY TECHNICAL ANALYSIS.
Firstly, our Algo-based indicators are used to create this analysis.
XRP IS ACCUMULATING TO PUMP SO HARD THAT YOU MIGHT SAY "WHY I DIDN'T LISTEN HIM AND BOUGHT MORE"
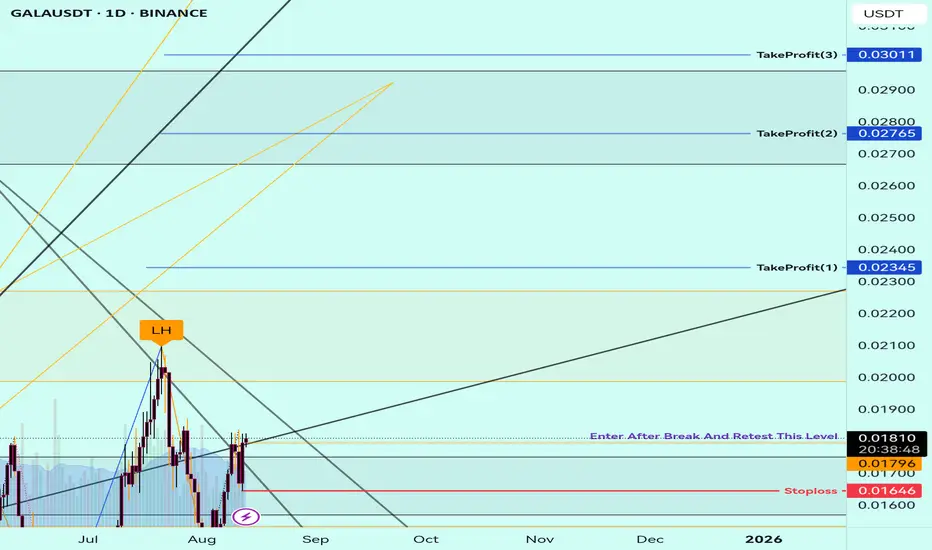
Buy Trade Strategy for GALA: Tapping into Blockchain GamingDescription:
This trading idea highlights GALA, the native token of Gala Games, a blockchain-based gaming ecosystem aiming to redefine the gaming industry by giving players true ownership of in-game assets. GALA powers transactions, governance, and rewards within the platform, enabling gamers and developers to participate in a decentralized and player-focused economy. With the rising popularity of play-to-earn models, NFTs, and metaverse integrations, Gala Games has positioned itself as a leading innovator in blockchain gaming, and GALA stands to benefit from this expanding market. Strategic partnerships, an active community, and ongoing game development further strengthen its fundamental outlook.
Still, the cryptocurrency market is volatile, and GALA is not immune to risks stemming from regulatory changes, competition, and market sentiment. As such, a disciplined risk management approach is essential when considering any position.
Disclaimer:
This trading idea is for educational purposes only and does not constitute financial advice. Investing in cryptocurrencies like GALA involves substantial risks, including the possibility of losing your entire investment. Always perform comprehensive research, evaluate your financial situation, and consult with a qualified financial advisor before making investment decisions. Past performance is not indicative of future results.
TIA/USDT: Bullish Patterns Emerge at Key ResistanceSUBSCRIBE, BOOST AND COMMENT IN ORDER TO GET HIGH QUALITY TECHNICAL ANALYSIS.
Firstly, our Algo-based indicators are used to create this analysis.
Daily (1D) & Weekly (1W) Analysis:
TIA/USDT has been in a sustained downtrend, but price is now tightening within a classic bullish pattern, suggesting a significant move may be imminent.
Key Observations:
Bullish Wedge: The price is consolidating within a large falling wedge, a strong bullish reversal pattern. A breakout to the upside is the confirmation we're watching for.
Primary Trigger: A decisive break and hold above the wedge's descending resistance line is the critical signal for a bullish reversal. Analysis suggests a significant price pump could follow.
Bullish Divergence & Signals:
On the daily chart, a clear "BUY SIGNAL" has been triggered on the momentum indicator.
The weekly indicator shows a potential inverse Head and Shoulders pattern developing, adding weight to the reversal case in our Market Cycle Orderflow indcator.
Fractal Projection: Historical fractal analysis projects a highly bullish path for TIA if it successfully breaks the current downtrend structure.
Conclusion:
The combination of a bullish falling wedge, a daily buy signal, and a potential weekly bottoming pattern strongly indicates a reversal may be near. The key confirmation remains a breakout above the wedge's resistance. Until then, this is a prime chart to watch.

RENDER - SHORT TERM 7-9$, MIDDLE TERM 21$ AND LONG TERM 200$SUBSCRIBE, BOOST AND COMMENT IN ORDER TO GET HIGH QUALITY TECHNICAL ANALYSIS.
Firstly, our Algo-based indicators are used to create this analysis.
RENDER FOR 200$ NEXT YEAR?
YOU MIGHT NOT BELIEVE, BUT IT'S THE NATURE OF FRACTALS.

DO YOU THINK SUI WILL HIT 10$ THIS YEAR TOO?SUBSCRIBE, BOOST AND COMMENT IN ORDER TO GET HIGH QUALITY TECHNICAL ANALYSIS.
Firstly, our Algo-based indicators are used to create this analysis.
The technical analysis of SUI are showing that the price is moved in our Market Cycle Orderflow indicator to the Pump zone. After successful Retest, it's now starting to Rise. So you didn't miss anything else yet.

XAUUSD Technical Analysis - August 12-13, 2025
📊 Market Overview
Symbol: XAUUSD (Gold/USD)
Timeframe: 15-Minute Chart
Current Price: $3,346.26 (+72.34) 📈
Session: Extended Trading Hours (EST)
🔍 Technical Analysis
Market Structure Assessment ⚖️
Gold has established a clear institutional supply and demand framework, demonstrating textbook price action between key zones. The 15-minute timeframe reveals the complete narrative of yesterday's significant move and today's recovery.
Key Technical Observations 📋
🔴 Supply Zone Rejection (August 12, 9:00-12:00 PM EST):
Strong institutional supply identified at 3,358.28 - 3,364.74
Multiple rejections from this zone indicating heavy selling pressure
Clean break of structure leading to accelerated decline
💥 Major Impulse Move (6:00 PM EST):
Decisive break below intermediate support
High-momentum bearish candles suggesting institutional order flow
Price reached demand zone with precision
🟢 Demand Zone Response:
Zone: 3,331.04 - 3,335.70 (Blue Zone)
Strong bounce from institutional demand level
Bullish engulfing patterns confirming buying interest
Current consolidation suggests potential continuation
📈 Trading Scenarios
Bullish Scenario 🚀
Trigger: Hold above 3,340 with bullish momentum continuation
Primary Target: Return to supply zone 3,358-3,364
Confirmation: Break above 3,350 with volume expansion
Invalidation: Break below demand zone 3,331
Bearish Scenario 🐻
Trigger: Failure to hold demand zone support
Target: Extension lower toward 3,320-3,325 area
Confirmation: Break below 3,331 with momentum
Range Scenario ⚡
Range: 3,331 - 3,364 (33-point range)
Current Position: Mid-range, slight bullish bias
Strategy: Fade extremes, trade with momentum at breaks
🎯 Key Levels to Watch
Resistance Zones:
R1: 3,350 (Intermediate resistance)
R2: 3,358-3,364 (Major supply zone)
Support Zones:
S1: 3,340 (Current consolidation low)
S2: 3,331-3,335 (Major demand zone)
⚠️ Risk Management & Notes
Supply and demand zones show clear institutional footprint
Watch for volume confirmation at zone boundaries
Current positioning suggests potential for range continuation
Monitor for break and retest scenarios at key levels
🎯 Conclusion
Gold has respected institutional zones perfectly, creating a defined range structure. The recent bounce from demand suggests potential bullish continuation, though price remains within the broader range. Clean breaks of either zone will likely provide the next directional bias.
Market Bias: Neutral-to-bullish while above demand zone
💡 This analysis is for educational purposes. Always conduct your own research and manage risk appropriately.

SOLANA SEASON - PUMP TO 600$This analysis shows that Solana is pumping to it's ALL-TIME HIGH in this ALTCOIN SEASON!
SUBSCRIBE, BOOST AND COMMENT IN ORDER TO GET HIGH QUALITY TECHNICAL ANALYSIS.
Firstly, our Algo-based indicators are used to create this analysis.

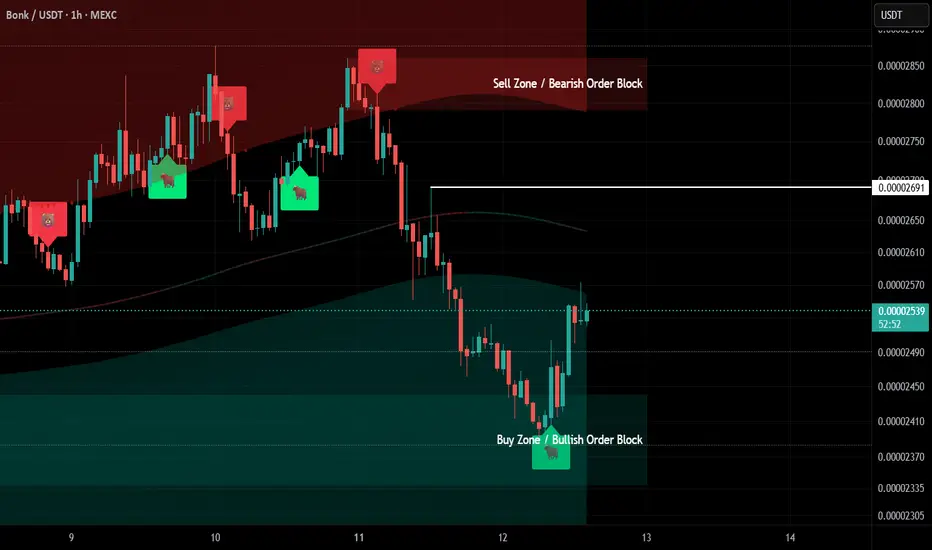
BONKUSDT - This Indicator Feels Like a Cheat CodeBeen trading BONK with my custom Buy/Sell zone indicator and the results have been insane.
It’s been catching reversals almost perfectly on the 1H chart, making entries feel effortless.
The recent buy signal nailed the bounce from the bullish order block and gave a clean move up.
Search for VIP Bull & Bear Sniper - Early Entry/Exit Alerts on my profile to see the full setup.
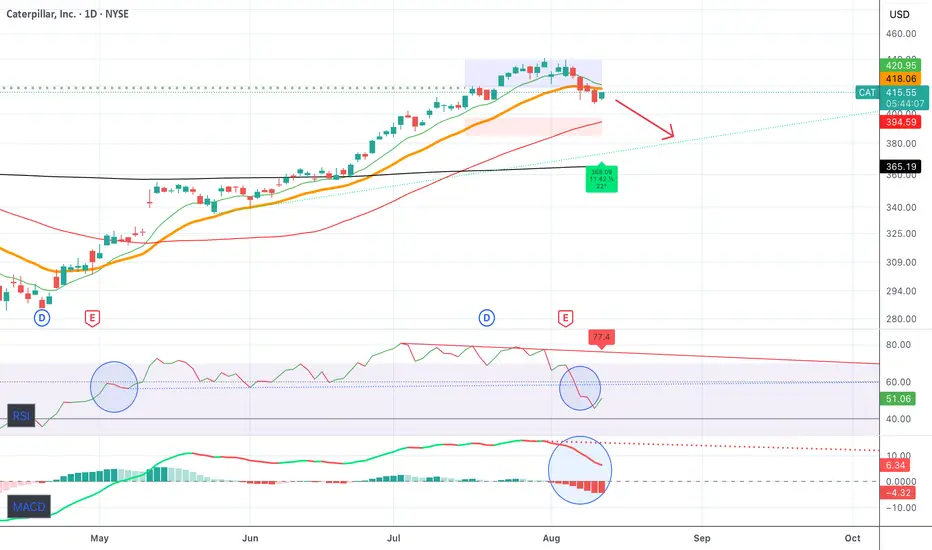
$CAT run is stallingA close below the 21 EMA followed by a crazy bullish run makes me bearish on NYSE:CAT for the next few weeks.
MACD falling fast and RSI broke below 50 which in my opinion signals a reversal.
PRE-US XAU PREDICTIONSweep of London low at 3342.32 with a confirmation in lower TF to push towards 3366. Trade smart, Trade safe guys.
