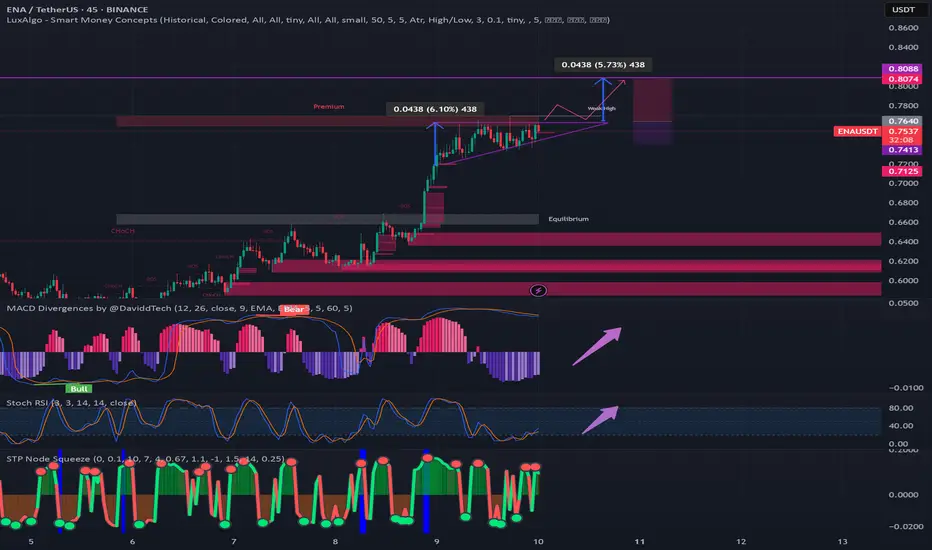
ENA possible Ascending triangle breakout playLook for confirmation above the Resistance line in Pink... maybe wait for a breakout, then a pullback touching the Prior Resistance line before entering... and then note the size of the triangle as a possible TP zone.
It is however, Entirely possible that the structure falls apart as a candle deviates from this pattern and falls to the bottom... just be careful on your entry.
Not Financial Advise... duh..
#ENA #scalptrade #leveragetrading #leveragetrade #eth BINANCE:ENAUSDT.P
Contains IO script
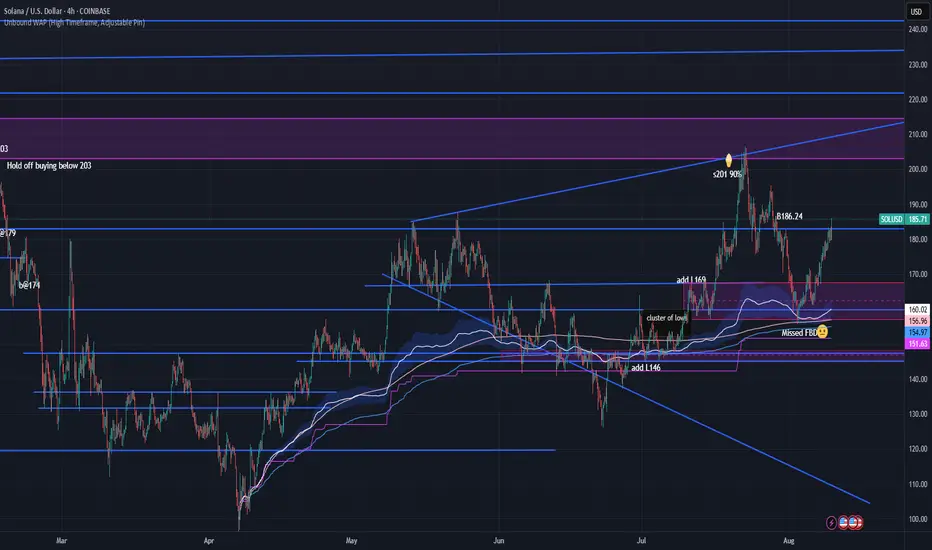
Ideal FBD on SOL with UWAPAug 25. FBD of cluster of lows from July 10-16. 6 day balance.. Combine the FBD with UWAP (Unbound WAP High Timeframe Adjustable Pin. A+ setup
FUNUSDT (FunFair/TetherUS) preparing for PUMPFirstly, our Algo-based indicators are used to create this analysis. Follow me so you don't miss, Boost and leave your comments if you profited with our posts, so we may continue:
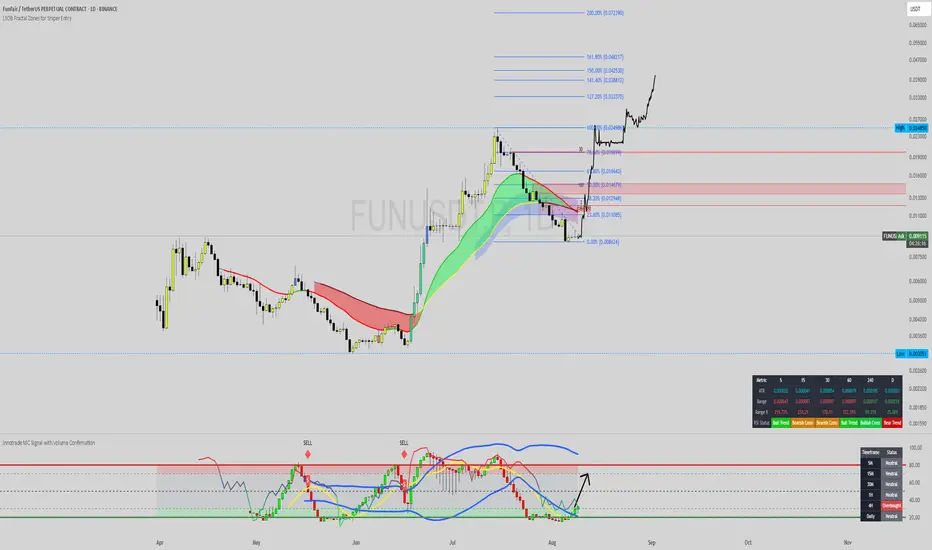
This daily chart for FUNUSDT (FunFair/TetherUS) suggests that a significant correction has found a floor, and the asset is now positioned for a strong bullish reversal with substantial upside potential.
Market Structure Shift: The chart illustrates a classic reversal pattern. After a steep decline from the peak at approximately $0.02485, the price has entered a consolidation phase at a critical support level. The projected path, indicated by the hand-drawn pink line, represents an anticipated "Change of Character" (Choch) from bearish to bullish as the price is expected to start forming higher highs and higher lows. Other traders have also noted that FUNUSDT is showing signs of a potential bullish reversal.
Support and Bottoming Formation: The price is finding strong support at the $0.008624 level, which corresponds to the 0.00% Fibonacci retracement level of the prior major uptrend. This level is acting as the definitive bottom in this analysis. The price action consolidating above this low suggests an accumulation phase is underway.
Indicator Confluence:
* The primary chart indicator, the LSQB Fractal Zones for Sniper Entry, shows the price holding within the green-colored band. In systems like this, fractal-based indicators identify potential reversal points.The green zone acts as a dynamic support area, signaling that the underlying trend is either bullish or attempting a bullish reversal.
* The lower indicator, Innotrade MC Signal with Volume Confirmation, is showing its signal line moving up from the lower boundary (green zone), which typically represents oversold conditions. A black arrow points upwards, suggesting an impending or recently triggered buy signal and a buildup of bullish momentum. This custom indicator is designed to identify high-probability reversals by blending momentum oscillators and confirming them with volume and volatility analysis.
Price Projection and Targets: The drawn pink line illustrates the expected trajectory for the price, anticipating a powerful rally from the current support. The key objectives are based on Fibonacci extension levels, which are used to project potential targets in a new trend:
Strategy:
Position: Long (Buy)
Entry: The analysis identifies the current price area around the $0.008624 - $0.009129 zone as a "sniper entry" or strategic buying opportunity.
Targets: The primary targets for this bullish move are
0.024986
0.024986
0.033370, and potentially higher towards $0.048217.
Conclusion:
With the price stabilizing at a key Fibonacci support level, a bottoming formation in place, and bullish signals from the custom indicators, FUNUSDT presents a compelling bullish reversal setup. The current price level is highlighted as an ideal entry point to capitalize on a potential new uptrend with significant room for growth.
Disclaimer: This analysis is based on the provided trading chart and is for educational purposes only. It should not be considered financial advice. Always conduct your own research and manage risk appropriately. Crypto markets are known for their volatility.
Ethereum Holds Above $4,000: The Start of a New Altcoin Rally?Ethereum (ETH), the largest altcoin by market capitalization, has become the main driver of the current cryptocurrency market surge. Amid Bitcoin dominance falling below its two-year trendline and capital flowing into altcoins, ETH has posted an impressive 20% weekly gain.
After a strong rebound from the $3,354 support level, ETH broke through the key psychological barrier of $4,000, reaching a local high at $4,206. This move has become a clear signal not only for investors but also for traders, who see it as confirmation of a new bullish momentum.
📈 Technical Overview:
ETH broke above its 50-day SMA and consolidated there, strengthening buyers’ positions.
Trading volumes on both spot and derivatives markets increased by 18% compared to the previous week.
RSI and MACD indicators show a growing trend with no signs of overbought conditions.
Bitcoin dominance dropping from 66% to 60% in just two months suggests a capital rotation toward altcoins, with Ethereum—being the sector’s flagship—benefiting the most from this shift.
🚀 What’s Next?
If Ethereum holds the $4,000–$4,050 range as support, the next technical target lies in the $4,450–$4,600 zone. The strengthening trend in the ETH/BTC pair also points to further potential growth, even if Bitcoin moves sideways.
The market is already calling this the beginning of the 2025 Altcoin Season, and Ethereum appears set to be its leading locomotive.

F03 food Empire holdings"Food Empire Holdings manufactures and distributes instant beverages - snack foods and food ingredients globally.
# 250617 Joins fortune southeast asia 500 list.
# 250523 Strong growth and new capacity. So KGI maintains buy. TP raised on robust 1Q
# 250303 Maybank-CGS-RHB-UOB raised to buy. Strong revenue growth and strategic market expansion. # 241112 Higher revenue in Q3 2024.
# 241001 Achieved 2024 ARC (Annual Report Competition ) Awards. This is the world's largest international competition honouring excellence in annual reports.
# RG Opinion: #250526 For swing traders can take some profit at this price. For long term investors good to hold as the good news still persist and no negative news. "

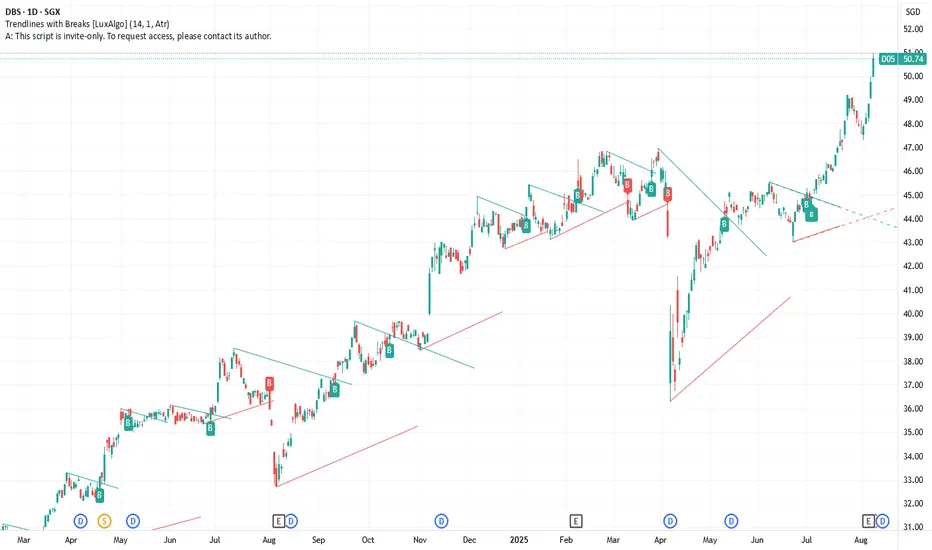
DBS Bank Singapore"Aztech maufacturing of IoT - Communication - LED lighting products internationally.
# 250723 Posts Revenue of S$185.4 Million & Net Profit Of S$16.1 Million For First Half Of 2025. CGSI-DBS upgrade Aztech following better-than-expected 2QFY2025 bounce-back
# 250228 Global outlook remains uncertain. Profit declines 58% in H2 2024. But at the same time Maybank-CGS upgrades to Buy with TP 0.82 expectation of 2026 earnings recovery.
# 240618 Ranks in fortune souteast asia 500.
# RG Opinion: Financial looks strong. Need to give time to perform."
RippleI put Ripple in a fib channel. If we look at the potential within this channel, we can see that there's room to run. Ripple is a crypto, so I like to look to the .786 in crypto, but the .618 in stocks. Crypto just seems to do a little bit more. Let's assume the price spikes on Monday up to the .618. That's around $28 or so. I've been saying "$30 (sell $28)" for ages and ages. And now the moment is here.
I do think Ripple will blow through my $30 target, but when you look at my XRP/BTC charts - which is what you should be looking at), then you can see that after the $30 pump, a huge retrace comes right after with a $5-7 landing, before making an even higher swing high in the price and in satoshis.
You need to look at the XRPUSD and the XPRBTC, with both of them being of equal importance. If you're watching just one, then you're only seeing half the picture.

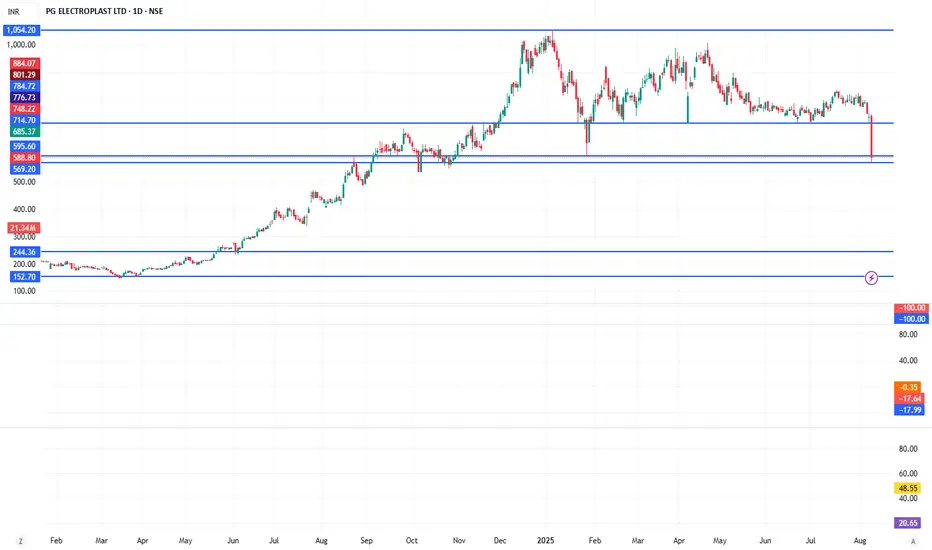
Good time to buy PGEL if makes a reversal candle here PGEL fell 23% post Q1 results and is currently at a support zone. If you intend to bet on PGEL for long term; could put 25% money at this level.
Disclaimer-
I am not a SEBI registered analyst. Please consult your financial advisor before investing your money.
Above post is only for educational purpose
Buy Trade Strategy for OP: Driving Ethereum Layer-2 ScalabilityDescription:
This trading idea focuses on OP, the native token of Optimism, a leading Ethereum Layer-2 scaling solution designed to significantly reduce transaction fees and increase throughput. By utilizing optimistic rollups, OP enhances Ethereum’s performance while maintaining its security and decentralization. The token serves multiple purposes, including governance, ecosystem funding, and incentivizing network participation. With Ethereum’s network congestion and high gas fees driving demand for scalable solutions, Optimism’s growth potential positions OP as a strong contender in the Layer-2 race.
Still, the cryptocurrency market is highly volatile, and OP is not immune to sudden price swings caused by market sentiment, regulatory updates, or technological shifts. Proper risk management and awareness of potential challenges are essential for any investment in this asset.
Disclaimer:
This trading idea is for educational purposes only and does not constitute financial advice. Trading cryptocurrencies like OP carries substantial risk, including the possibility of losing your entire investment. Always conduct thorough research, assess your financial situation, and consult with a qualified financial advisor before making investment decisions. Past performance is not indicative of future results.

BTC 1d forecastBTC WILL GO DOWN from 11-20 of August till the end of Aug (25 +/-1day)
From there we are PUMPING till beg of Nov, from there DUMP till mid Dec and one last PUMP til mid JAN beg FEB!
Than - THE END!!!! FINISH! Sayanara

Watching July 31 High and August 1 Low - Key LevelsUS Inflation Next Week (CPI and PPI)
Will August re-test highs with momentum? Or test and fade?
MAGS back to highs.
AAPL has one of the best weeks since 2020's post covid crash recovery (WILD).
I still like long assets, but playing the game with discipline and patience.
Enjoy the weekend. Looking forward to the grind next week.
Thanks for watching!!!
-Chris

BTCUSD: Critical Consolidation Zone - Bulls vs Bears Battle at 1
📊 Market Structure Overview
Bitcoin is currently trading in a critical consolidation zone around 115,488-117,679 after experiencing a significant pullback from recent highs. The price action suggests we're at a pivotal decision point that could determine the next major directional move. ⚖️
🎯 Key Levels Analysis
🔴 Supply Zones (Resistance)
Primary Supply Zone: 120,954.84 - 122,094.66 🚫
Secondary Supply Zone: 117,606.55 - 118,664.22 ⛔
🟢 Demand Zone (Support)
Major Demand Zone: 111,971.32 - 113,179.33 💪
🔄 Current Consolidation Zone
Range: 115,488.540 - 117,679.520 📦
📈 Technical Outlook
🐂 Bullish Scenario (Probability: 45%)
Conditions for upside breakout:
✅ Hold above 115,500 support level
✅ Break and close above 117,700 (consolidation high)
✅ Volume confirmation on breakout
🎯 Bullish Targets:
Target 1: 118,500 (near secondary supply zone)
Target 2: 121,000 (primary supply zone test)
Target 3: 125,000+ (new highs if supply breaks)
🐻 Bearish Scenario (Probability: 55%)
Conditions for downside break:
❌ Break below 115,400 with volume
❌ Failed bounce from current levels
❌ Rejection at 117,600 resistance
🎯 Bearish Targets:
Target 1: 113,000 (demand zone top)
Target 2: 112,000 (demand zone middle)
Target 3: 110,000 (demand zone break)
💰 Trading Strategies
🟢 Long Setup (Breakout Play)
📍 Entry: Break above 117,700 with volume
🎯 Target 1: 118,500
🎯 Target 2: 121,000
❌ Stop Loss: Below 116,800
🔴 Short Setup (Breakdown Play)
📍 Entry: Break below 115,400 with volume
🎯 Target 1: 113,000
🎯 Target 2: 112,000
❌ Stop Loss: Above 116,500
⚖️ Range Trading Setup
🟢 Buy: 115,500-115,800 (support bounce)
🔴 Sell: 117,400-117,600 (resistance rejection)
❌ Stop: Outside the range (114,800 / 118,200)
📊 Technical Indicators Analysis
Moving Averages: Currently mixed signals with price between key MAs 🌊
Volume Profile: Watching for volume confirmation on any breakout 📊
Market Structure: Consolidation after sharp correction suggests accumulation/distribution 🔄
🌍 Market Sentiment Factors
📰 Ongoing regulatory developments
🏦 Institutional adoption trends
💵 Dollar strength/weakness impacts
⚡ Network fundamentals and adoption
📈 ETF flows and institutional interest
👀 Key Watch Points
📊 Volume Surge: Any breakout needs volume confirmation
🕒 Time Factor: Longer consolidation often leads to bigger moves
💹 Correlation: Watch traditional markets for risk sentiment
📅 Event Risk: Any major crypto news or regulatory updates
🎯 Conclusion
Bitcoin is at a critical juncture with equal probability for both bullish and bearish scenarios. The consolidation zone between 115,488-117,679 is the battleground where bulls and bears are fighting for control.
Key Strategy: Wait for a clear breakout with volume confirmation rather than trying to predict direction. The next move could be significant given the tight consolidation and clear supply/demand levels. 🚀⚡
⚠️ Risk Management:
Use tight stops on breakout trades
Position size appropriately for volatility
Consider waiting for retests of broken levels
⚠️ Risk Warning: Cryptocurrency trading involves substantial risk and high volatility. Always use proper risk management and never invest more than you can afford to lose.

XAUUSD Technical Analysis - 4H Timeframe
## 📈 Market Structure Overview
Gold continues to demonstrate strong bullish momentum on the 4-hour timeframe, with price currently consolidating around the **3,396-3,410** region after a significant upward move from the demand zone. 🚀
## 🎯 Key Levels Analysis
### 🔴 Supply Zones (Resistance)
- **Primary Supply Zone**: 3,480.55 - 3,499.90 ⛔
- **Secondary Supply Zone**: 3,429.52 - 3,454.24 🚧
### 🟢 Demand Zone (Support)
- **Major Demand Zone**: 3,246.44 - 3,268.42 💪
## 📊 Technical Outlook
### 🐂 Bullish Scenario
The overall trend remains **strongly bullish** with higher highs and higher lows being established. Key observations:
- ✅ Price has successfully broken above multiple resistance levels
- ✅ Moving averages are in bullish alignment (green MA above red MA)
- ✅ The recent pullback appears to be a healthy retracement within the uptrend
- ✅ Current consolidation zone (light blue area) suggests accumulation before the next leg up
### 💰 Potential Trading Opportunities
**🟢 Long Setup:**
- **📍 Entry**: Current levels (3,396-3,410) or on any dip toward 3,366-3,380
- **🎯 Target 1**: 3,450 (near secondary supply zone)
- **🎯 Target 2**: 3,485 (primary supply zone)
- **❌ Stop Loss**: Below 3,350 (previous swing low)
**⚖️ Risk Management:**
- Risk-to-reward ratio: Approximately 1:2 to 1:3 📏
- Position size should account for the volatility in precious metals ⚠️
## 🌍 Market Sentiment
Gold's strength continues to be supported by:
- 🌐 Ongoing geopolitical tensions
- 🏦 Central bank monetary policies
- 💵 Dollar weakness in certain periods
- 🛡️ Inflation hedge demand
## 👀 Key Watch Points
1. **🎯 3,450 Level**: Critical resistance that could determine the next major move
2. **🔰 3,366 Support**: Immediate support level to watch for continuation
3. **📊 Volume Confirmation**: Look for increased volume on any breakout attempts
## 🎯 Conclusion
The technical setup favors continued upside momentum with defined risk levels. Traders should watch for price action around the identified supply zones for potential profit-taking opportunities, while any sustained break above 3,500 could signal an acceleration toward new highs. 🚀✨
*⚠️ Risk Warning: Trading involves substantial risk. Always use proper risk management and never risk more than you can afford to lose.*

Hit air risesGoing long on fart coin here for a two to one RR. showing bullish price action at Mondays range high in conjunction with eth breaking over 4K let’s print! 🤑

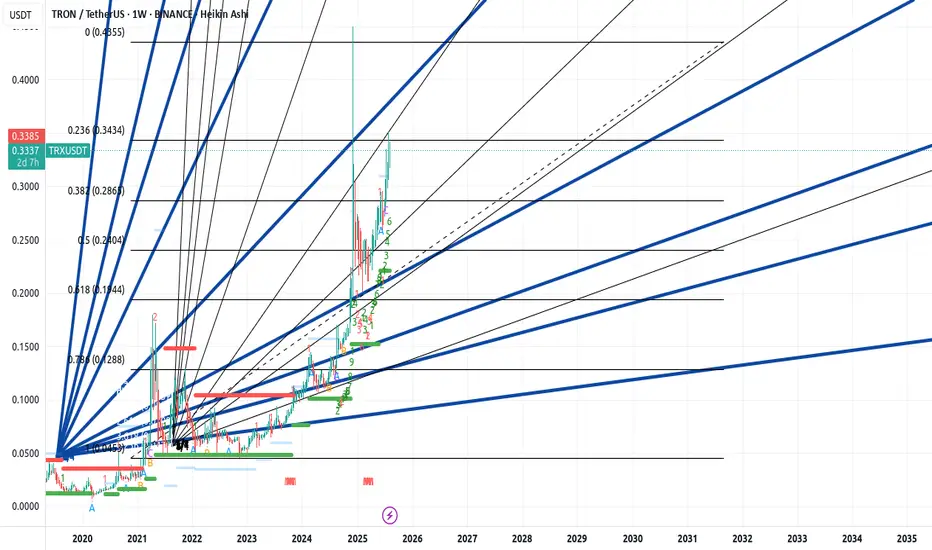
6 is not far from 9 and already good enough hereClose to another decision point level. Watching reaction is a must. This is a chart i forgot about but it seems it works surprisingly well.
BTC/USDT: Key Levels to Watch Now!Bitcoin remains in a macro bullish structure, but recent price action shows consolidation after breaking through major resistance levels earlier this month. Similar to previous cycles, BTC tends to form short-term ranges after strong rallies before deciding the next move.
Currently, BTC is trading near $116,500–$117,000, just above a key support zone from $115,200 to $114,500. This area aligns with previous breakout levels and the 20 EMA on the 4H chart, making it critical for the short-term trend.
*Bullish Scenario: Holding above $115,200 and breaking $118,600 with strong buying volume could push BTC toward $120,500–$122,000 within days.
*Bearish Scenario: A close below $114,500 could trigger a correction toward $112,800–$111,900. Losing this level may extend the retracement to $110,200 (major demand zone).
Summary:
BTC is consolidating near key support. Past scenarios suggest a breakout above $118,600 could fuel the next bullish leg, but losing $114,500 risks a deeper pullback toward $112,800. The next 2–4 days should define short-term direction.

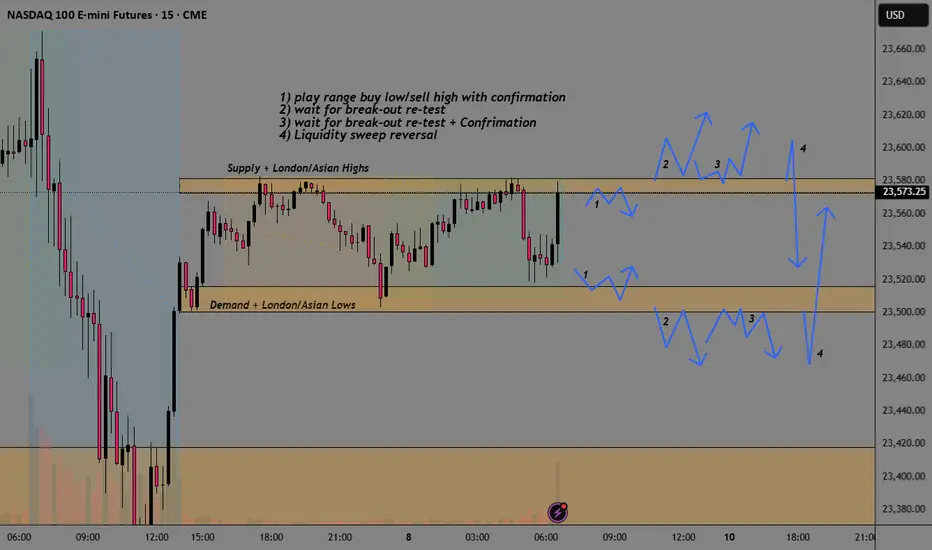
NQ Break-Out AnalysisSee chart from analysis of different options depending on the type of trader and what others are looking at.
1) play range buy low/sell high with confirmation
2) wait for break-out re-test
3) wait for break-out re-test + Confirmation
4) Liquidity sweep reversal
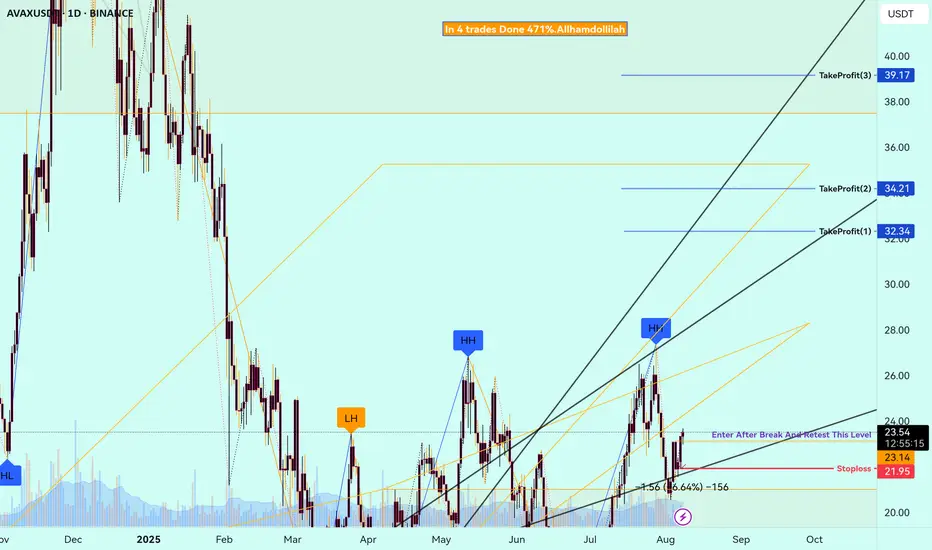
Buy Trade Strategy for AVAX: Tapping into High-Speed DeFiDescription:
This trading idea highlights AVAX, the native token of the Avalanche blockchain, known for its high-speed transactions, low fees, and scalable infrastructure. AVAX powers a robust ecosystem that supports decentralized finance (DeFi), NFTs, and Web3 applications, making it a strong contender in the competitive smart contract platform space. With its unique consensus mechanism and growing list of partnerships, Avalanche has attracted developers and users seeking efficient and eco-friendly blockchain solutions. The increasing adoption of AVAX in DeFi protocols, cross-chain interoperability, and institutional interest reinforces its long-term growth potential.
Still, the cryptocurrency market remains highly volatile, with AVAX’s price influenced by market sentiment, regulatory shifts, and broader economic conditions. Proper risk management and awareness of potential downsides are essential when considering positions in AVAX.
Disclaimer:
This trading idea is for educational purposes only and should not be taken as financial advice. Trading cryptocurrencies like AVAX carries substantial risks, including the possibility of losing your entire investment. Always conduct independent research, evaluate your risk tolerance, and consult with a licensed financial advisor before investing. Past performance does not guarantee future results.
XRY to 4.50 next weekthe case with the sec lines up with the cup and handle formation. it will pop after news gets out next Friday.

ETH Important Update 08.08.2025🚀 #ETH Update 🚀
This is the third attempt on the major timeframe for ETH to break through this yellow resistance zone. 📊
I strongly believe that this time ETH has a high chance to break it.
📌 Possible Scenario:
* ETH pushes up to this zone
* Small retracement 🔄
* Then a strong breakout 💥
We’ll monitor closely to catch the move.
⚡ Important Point:
If ETH starts retracing while:
1️⃣ Bitcoin stays in range
2️⃣ Bitcoin dominance drops 📉
➡️ Then we could see a solid rally in TOTAL3 (altcoins excluding ETH) — meaning a lot of altcoins will have good upside potential.
💡 Be prepared with liquidity — opportunities don’t wait! Insha’Allah, we’ll ride this wave together. 🌊
🔥 Stay focused. Stay ready. This could be the moment the market wakes up!

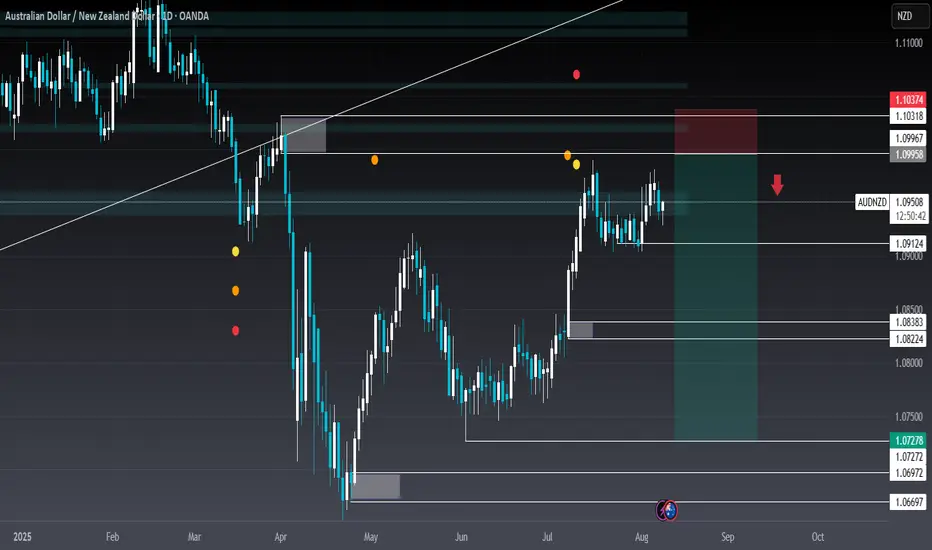
AUD/NZD Short Trade AUD/NZD Short position from a Daily Supply Zone.
A clear and impressive move away showing a clear sign of institutional selling.
My first publication so my explanations will need some work.
Buy Trade Strategy for LINK: Driving Smart Contract ConnectivityDescription:
This trading idea focuses on LINK, the native token of the Chainlink network, a leading decentralized oracle solution that connects smart contracts with real-world data. LINK plays a critical role in enabling secure, reliable, and tamper-proof data feeds for DeFi, NFTs, gaming, and enterprise blockchain applications. As blockchain adoption accelerates, Chainlink’s expanding integrations and partnerships strengthen its position as the go-to oracle provider. The growing demand for accurate off-chain data in on-chain environments continues to support LINK’s long-term value proposition.
That said, the cryptocurrency market is highly volatile and influenced by factors such as regulatory changes, technological developments, and market sentiment. Investors should approach LINK with a clear strategy and strong risk management practices.
Disclaimer:
This trading idea is for educational purposes only and does not constitute financial advice. Cryptocurrencies like LINK carry substantial risks, including the possibility of losing your entire investment. Always perform your own research, assess your financial situation, and consult with a licensed financial advisor before making any investment decision. Past performance is not indicative of future results.

Bitcoin and Broad Market Breakout (BTC, ETH, SOL, PENDLE)In this video we take a look at why the market rallied Thursday.
- 93% of FOMC September Rate cut and 3 possible cuts in 2025
- UK just dropped rates to 4%
- President Trump approved letting 401k's invest in crypto
- Trump removed resitrictions by banks to 'de-bank' crypto investors
The charts looks very bullish here and I revisit the potential path to $150 BTC this year.
Also ETH, Solana charts and 'The Rocket'
As well as the 25% move on Pendle which I had recommended as a 'Buy' the day before.
Let me know what you think...
The BULL is Back.
