Buy Trade Strategy for MNT: Backing a Scalable Web3 FutureDescription:
This trading idea focuses on MNT, the native token of the Mantle Network, a modular Ethereum Layer 2 solution designed to offer scalability without compromising security or decentralization. MNT plays a central role in securing the network, paying transaction fees, and participating in governance. Mantle’s architecture separates execution from data availability and consensus, which enhances performance and cost-efficiency—key factors in supporting next-generation Web3 applications. As the demand for efficient and scalable Ethereum solutions grows, MNT stands out with its innovative structure, strong backing by BitDAO, and an expanding developer ecosystem.
That said, it’s crucial to be aware of the high volatility and inherent risks in the crypto market. Regulatory updates, macroeconomic events, and investor sentiment can strongly impact **MNT**'s price performance. Therefore, sound risk management is essential.
Disclaimer:
This trading idea is for educational purposes only and should not be considered financial advice. Trading cryptocurrencies such as MNT involves a high degree of risk, including the potential loss of your entire investment. Always conduct independent research, evaluate your financial situation, and consult a financial advisor before making any investment decisions. Past performance does not guarantee future results.
Contains IO script

Spy holding this channel at 20 SMASpy bulls are holding above the 20 SMA. Let’s see if this trend holds!

BTC 1D OBV shows deviation, reclaim and bounce. Higher!Bitcoin CRYPTOCAP:BTC 1D OBV shows deviation, reclaim and bounce. Higher!

LINK Macro trend LINK 4h+ Link has bottomed out, accumulated in the yellow box, creating large volume node, deviated once to lower price to thin spike volume area which is by little higher PoC, I still think that thick PoC at the yellow box is much valuable. Played out Power of 3, taking out February supply, pulled back to GP Fibbs from the yelllow box and now broke MS ( market structure) to bullish on 1-4H . It will either pump all the way up, or will print higher high-higher low and it will be point of long entry.

$GBPUSD at resistance?STICing it to the chat, but sometime i'd wanna take early entry. Bases on regression S&R, GBP should continue downthrnd following a previous H&S an da retest of resistance.
IF resistance break hwever, we migth see a flip, but not holding my short for the week. Fingercrossed
took early On M15 but it about time to TP.
#Tradesmartly #STIC Algo

Macro Bullish with a Hint of Bearish - Gold Analysis and TargetsOn the short term we are direction neutral but expecting a pull-back sometime in August. Waiting for a break in the channel pattern for positioning. On the Macro, we have an ascending triangle formation with an overall bullish bias.

ETH ( Ethereum ) lovers looking strong for long term ETH -----Daily counts indicate Excellent bullish wave structure.
Both appear to be optimistic and this stock invalidation number (S L) wave 2 low
target short / long term are already shared as per charts
correction wave leg seems completed
Investing in declines is a smart move for short/ long-term players.
Buy in DIPS recommended
Long-term investors prepare for strong returns over the next two to five years.
one of best counter
Every graphic used to comprehend & LEARN & understand the theory of Elliot waves, Harmonic waves, Gann Theory, and Time theory
Every chart is for educational purposes.
We have no accountability for your profit or loss.

ASM -Australian Strategic MaterialsPromising.
Now word to say yet but very promising.
This is the key and solution to get away from China and balance the supply of Lithium and Rare Earth Materials.
ASM have signed production with Korea.
Korea has a significant influence in production of Samsung phone and EV cars around the world.
all we need is first production and BOOM

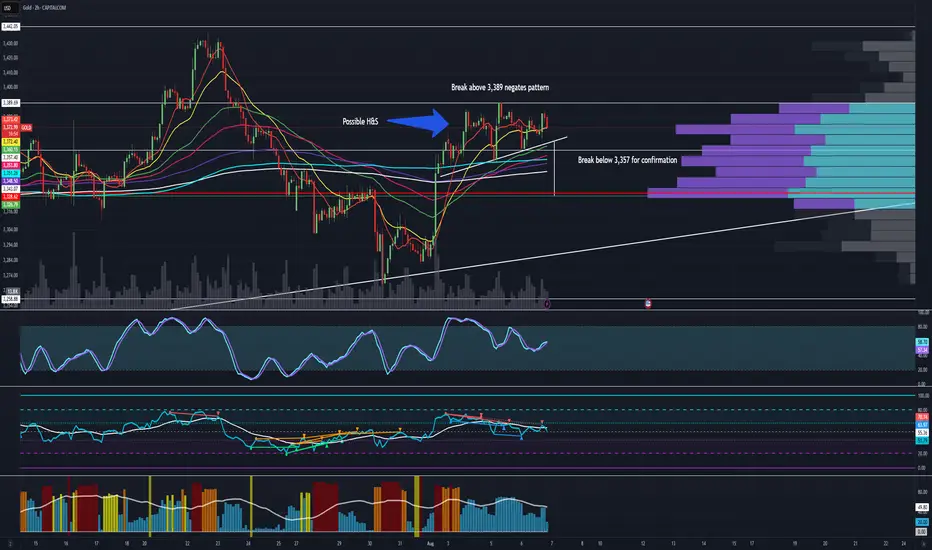
Possible Head and Shoulders Pattern - Analysis and TargetsWe have a possible head and shoulders formation on Gold. Upon a break below 3,358, we would have a target down to 3,327 which also would line up with our volume blocks on the VPVR. A break above 3,390 would negate this pattern. If we break down we are still in a macro ascending triangle formation which would be a bullish formation until proven otherwise.
Short Term : Bearish
Medium/Long Term : Bullish
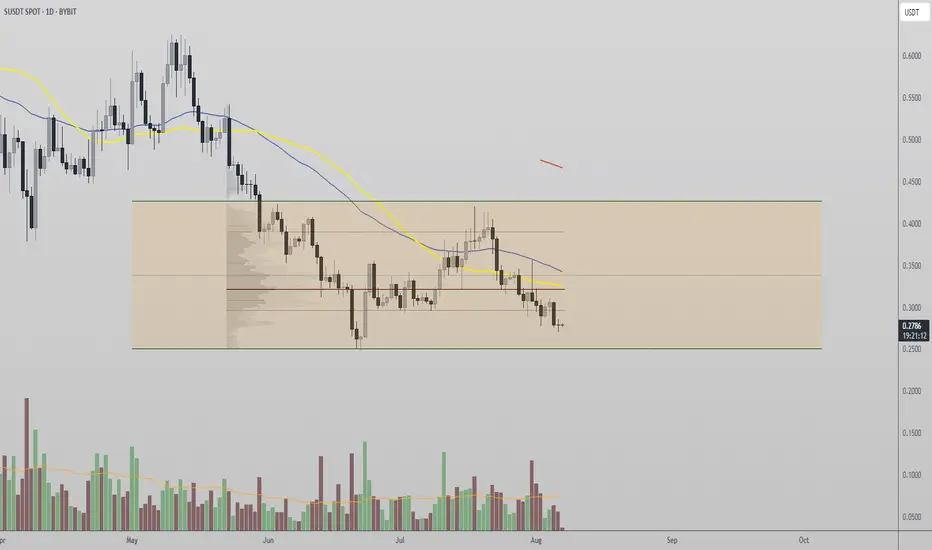
Sonic Token Stuck in Range as Accumulation Phase Forms Sonic Token is showing signs of a classic range-bound market structure, with price rotating between the value area high and the value area low. The most recent rejection from range highs has shifted price action back toward the lower boundary of the range. This setup suggests a potential equilibrium phase that could last for days or even weeks before any breakout occurs.
Key Technical Points:
- Range Bound: Trading between value area high and value area low on the daily timeframe
- Rejection Point: Clean rejection from value area high triggered current rotation downward
- Breakout Confirmation: Requires strong bullish volume to confirm legitimacy
Sonic Token has clearly established a well-defined trading range on the daily timeframe, with price action bouncing between the value area high and low. After a recent rejection at the top of this range, S-SONIC is now rotating downward, currently testing the lower end of the range.
This behavior is consistent with a market in equilibrium, where no side has definitive control. The daily timeframe provides context for this extended sideways movement, and it appears likely that the asset could remain within this consolidation zone for several more sessions. Unless strong volume emerges, the probability favors continued ranging.
This current phase may evolve into a longer-term accumulation period. These phases are common during consolidation before major directional shifts. If price remains bound within this range and tests both boundaries multiple times, it often signals that larger players are accumulating positions, awaiting a breakout trigger.
However, volume remains the key metric to watch. Any breakout attempt — whether to the upside or downside — must be accompanied by strong, above-average bullish volume to confirm its legitimacy. Without this, even a break above the value area high may lead to a fakeout and a return back into the range.
Until proven otherwise, Sonic Token is not trending but rotating within the value zone. For traders and investors, this phase represents potential accumulation opportunities at range lows and profit-taking opportunities at range highs. But aggressive breakout positioning should be avoided until volume validates the move.
If price eventually breaks out of this range with increasing bullish influxes, it could shift the entire structure toward a new trading regime. But until then, the bias remains neutral to range-bound.
What to Expect in the Coming Price Action
Sonic Token is likely to continue ranging until a breakout is confirmed with high volume. Watch the value area high and low for reactions and confirmation signals before positioning for continuation.
BRN - brainchipBRN have been a problem child for many traders and investors after it surge on price its now down to ground. Don't get your hope disappear yet as things about to change and happen very rapidly.
Wit the development of AI. Akida is BRN flagship which may contribute to enhance security by using this on their defense in Drones.
This is also important in ensuring low cost energy as its using efficient energy.
Things will change just hang on there and everything will become bullish.

Bitcoin feminine?Is Bitcoin dominance slipping?!
I think bitcoin dominance is about to lose 60% concretely! Prepare for top Alts to run hard!!

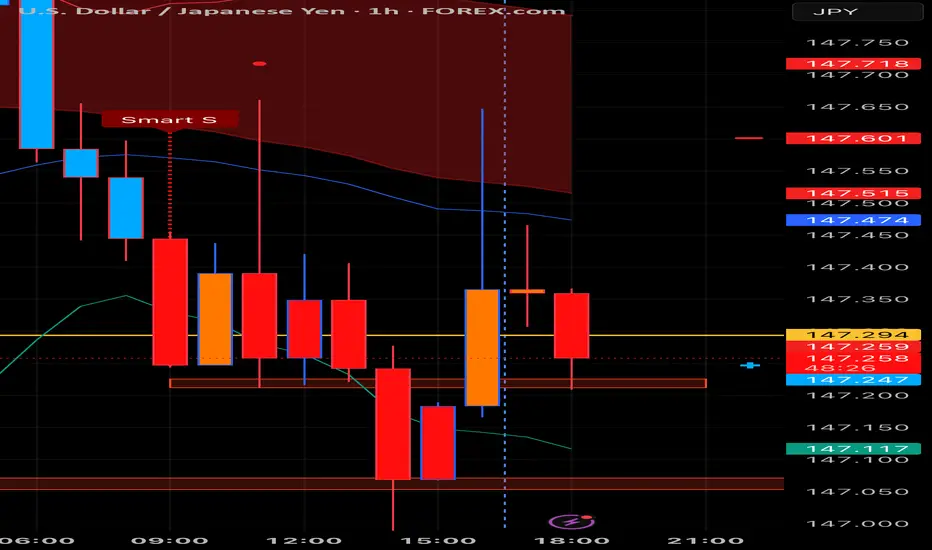
UsdjpyUsd weak against jpy
As you see bearish momentum is started and we can see gold also rising so
As per my analysis usfjpy should fall it to next support level that is 141.07

LTC / USDT TRADE We hope you find our charts of use, please hit the like button if you found this chart useful. Safe trading everyone Check today's analysis below.⠀

Tesla : Bullish or Bearish? Targets and AnalysisWe currently have a symmetrical triangle formation on the lower time frames for TSLA. As of right now we are direction-neutral and waiting on a break above or below our current support/resistance. I give targets and breakage points in this video.

SHIB/USDT: Will the Bulls Win?Over the next seven days, SHIB/USDT is likely to consolidate within a range around $0.0000122 to $0.0000132. If it breaks above the 200‑day EMA (~$0.0000145) and trading volume rises, SHIB could climb toward $0.0000150–$0.0000152.
However, failure to hold $0.0000120–$0.0000122 support may lead to a downturn toward $0.0000118 or lower...
Factors That Could Influence the Path
-Investor behavior – Whale activity and institutional purchasing are key; recently high volume hinted at institutional positioning
-Network events – Any burn campaigns or Shibarium adoption updates could spur bullish movement.
-Market sentiment – Overall crypto risk appetite matters; a bearish broader market may weigh on SHIB despite upcoming support.
-Competitive tokens – Alternatives like Little Pepe (LILPEPE) or PEPE Coin are garnering attention, which might divert speculative capital
Risk & Summary:
*Moderate upside potential if momentum continues up to ~20% gain from current levels.
*Downside limited to ~3–5% if support fails.
*Short‑term behavior will largely depend on volume, burn incentives, and broader crypto sentiment.

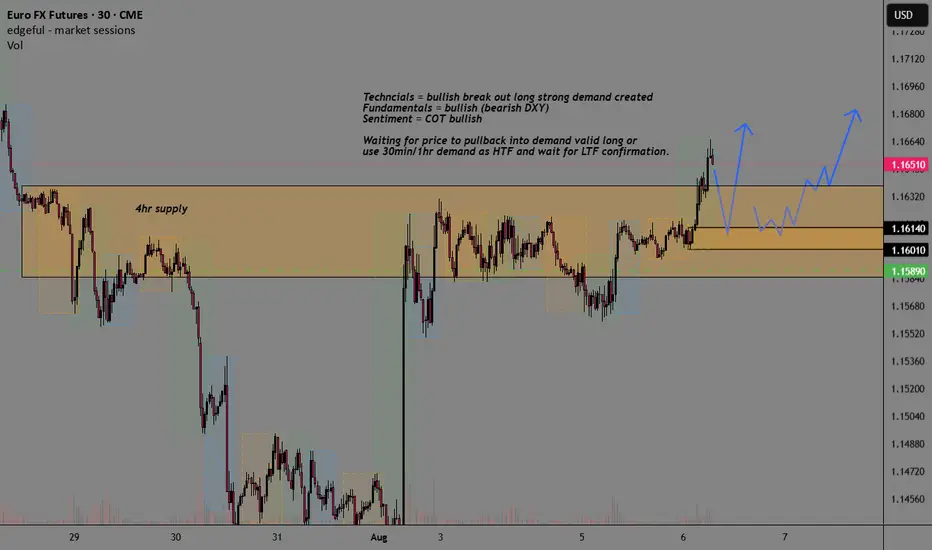
EUR EURUSD Supply-Demand Breakout Buy SetupSee chart for top-down analysis.
Looking at long if price pulls back into break-out level of demand with strong fundamentals, technicals, and sentiment COT reports.
Understanding Trend Reversals: Switch Levels & Peak Formations EAs traders, one of our biggest challenges is identifying the trend and recognizing when it's rolling over to form a peak formation. In this video, I’ll give you a quick yet powerful introduction to the theory behind switch levels and peak formations — key concepts for understanding trend strength, spotting reversal zones, and determining when a high or low is potentially locked in.
Whether you’re a beginner or refining your strategy, this video will help you better develop your bias by recognizing when a trend is losing momentum.
📌 Topics Covered:
What are Switch Levels?
Identifying Peak Formations
How to Confirm a Locked-In High or Low
Reading Trend Strength and Shift Signals

Next predictions for ZoraI see two scenarios for Zora on the chart, one scenario is a head and Shoulder pattern , which pushes Zora down .
and the next scenario is the possibility of another bullish wave.

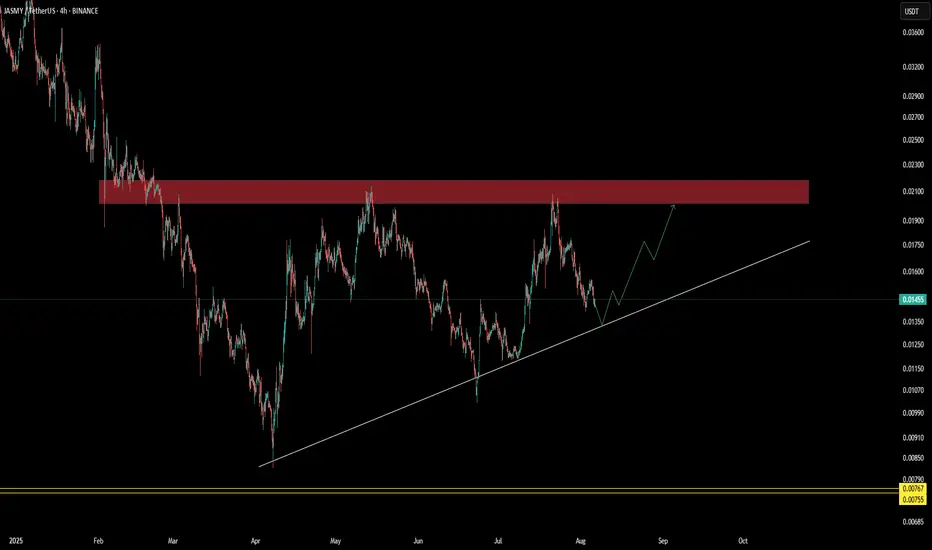
$JASMY ascending triangle patternSEED_DONKEYDAN_MARKET_CAP:JASMY price is hovering near the support trendline, and the chart is forming a bullish structure with consistent higher lows.
If the price manages to hold, this could be a good buy zone near support IMO.
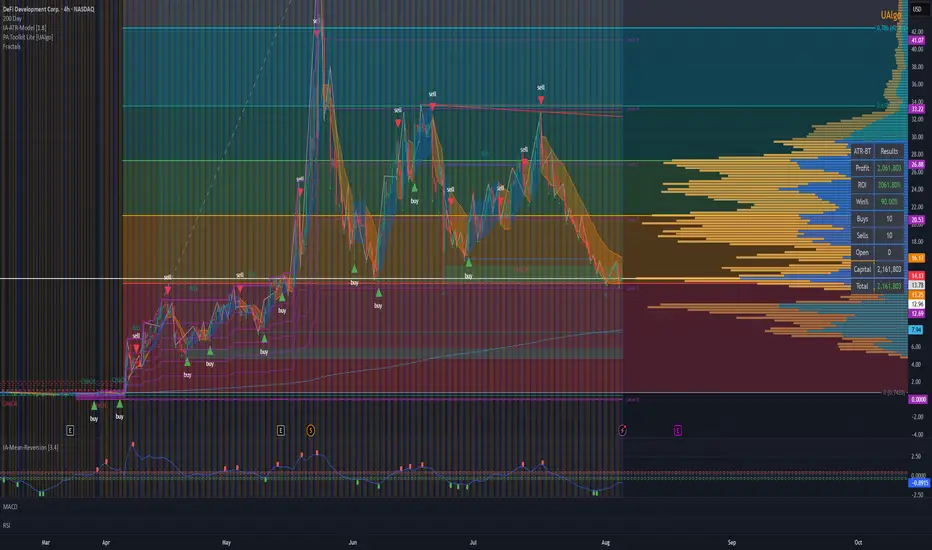
DFDV Entry Levels Before Q2 EarningsUsing several indicators, fib levels show DFDV close to bottom with potential upside before Q2 Earnings call
You are not bullish enough on $HYPEBuilding a Bullish Case for \ GETTEX:HYPE (Hyperliquid)
1. Tokenomics: Deflationary Supply & Incentive Alignment
Fixed Supply & Fair Distribution : HYPE has a hard-capped supply of 1 billion tokens, with \~333.9 million (33%) circulating as of mid-2025. Notably, the token was launched via a large airdrop rather than a VC presale – about 310 million HYPE (31%) were distributed to \~94,000 early users at genesis. In total, 69% of HYPE is allocated to the community (airdrop + future rewards), underscoring a grassroots distribution with no early VC unlock overhang. The remaining allocation goes to core contributors (23.8% vested), a foundation budget (6%), grants (\~0.3%), etc., aligning the team’s incentives with long-term network success. This community-centric supply structure contrasts with many meme coins that often concentrate supply in dev or whale wallets, fostering greater trust in HYPE’s tokenomics.
Emissions & Staking Rewards : About 38.9% of HYPE supply is reserved for future emissions and community rewards. HYPE secures its own Layer-1 blockchain via a proof-of-stake consensus (“HyperBFT”), so staking is integral. Validators must self-delegate 10,000 HYPE each, and users can stake HYPE to help secure the network and earn rewards. This incentive design encourages holding: stakers earn yield (likely drawn from protocol fees or emissions), while also gaining governance rights to vote on Hyperliquid’s future. The staking requirement for validators and planned reward schedule suggest a controlled release of new tokens over time, balancing network security with inflation. Importantly, HYPE’s annual inflation is expected to be offset (or even net-negative) by its revenue burn mechanisms.
Buyback & Burn Mechanism : A key bullish facet of HYPE is its deflationary pressure from platform usage. Hyperliquid’s on-chain perpetual DEX uses a portion of trading fees and profits to buy back and burn HYPE tokens, directly tying token demand to exchange volume. This model, similar to exchange tokens like BNB, means that as Hyperliquid’s trading activity grows, HYPE’s effective circulating supply can *shrink* over time. Indeed, the protocol’s HyperLiquidity Provider (HLP) vaults generate revenue from traders and use it to reward liquidity providers *and* conduct token buybacks. With Hyperliquid averaging multi-billion-dollar daily volumes (see below), these recurring burns create a strong scarcity engine for HYPE. The result is a tokenomics profile combining *growth incentives* (staking rewards, community grants) with *scarcity drivers* (fee burns and a hard cap). By contrast, older meme coins like Dogecoin have *infinite* supply and ongoing inflation (\~5 billion DOGE minted yearly), and even newer memes like PEPE or FLOKI rely on one-off burns or taxes. HYPE’s structured deflationary model stands out as more robust and sustainable for long-term value.
2. Ecosystem Growth, Usage, Development & Roadmap Progress
Explosive DEX Volume & TVL : Hyperliquid isn’t just a token – it’s a high-performance Layer-1 blockchain and decentralized exchange (DEX) for perpetual futures trading. The platform’s growth has been staggering. By July 2025, Hyperliquid was handling \$2–6 **billion in daily trading volume** on average, with peaks up to \$8.4B in 24 hours. This gave Hyperliquid an estimated 80%+ share of all on-chain perpetual futures trading, making it the dominant decentralized derivatives exchange. Such volume has driven its Total Value Locked (TVL) to new highs: over \$460–480 million in bridged assets by mid-2025. In fact, by late May, Hyperliquid’s DeFi ecosystem had grown so rapidly that its TVL (\~\$1.45 billion) ranked it among the top 10 blockchains (surpassing networks like Aptos and Polygon). This rapid user adoption – with over 500,000 users and \$88B in total deposits logged – provides real utility and value backing the HYPE token (e.g. HYPE is used for fees, collateral, governance, etc.). Unlike purely speculative meme coins, HYPE benefits from a thriving ecosystem where high demand for the network’s services translates into fundamental demand for the token.
Developer Activity & Upgrades : Hyperliquid’s team (comprising talent from Harvard, MIT, etc.) has delivered significant technical milestones on its roadmap, reinforcing the bullish outlook. The network’s HyperCore Layer-1 launched in early 2025, featuring sub-second block times and an on-chain orderbook optimized for speed. In March 2025, the HyperEVM environment went live, enabling Ethereum-compatible smart contracts on Hyperliquid. This opens the door for third-party dApps to deploy. Indeed, developers have begun integrating: for example, HyperBeat yield aggregator and Kinetiq liquid staking launched on HyperEVM, attracting hundreds of millions in deposits from HYPE holders seeking yields. In July 2025, the “CoreWriter” upgrade was rolled out, allowing HyperEVM dApps to interact directly with HyperCore’s exchange engine. This kind of innovation – bridging DeFi apps with the high-speed orderbook – showcases a *burgeoning development ecosystem*. It’s telling that established DeFi projects from outside networks are expanding to Hyperliquid: e.g. EtherFi, a leading Ethereum staking protocol, partnered to launch liquid staking for HYPE on Hyperliquid. All these signals – rising third-party TVL, partnerships with DeFi teams, continuous chain upgrades – point to healthy developer activity and a growing ecosystem around HYPE. By comparison, most meme coins (DOGE, PEPE, WIF) lack any meaningful dApp ecosystem or technical development, and even Floki’s utility projects (NFT game, etc.) are modest in usage. Hyperliquid’s real-world usage metrics (volume, TVL, users) and active development pipeline strongly reinforce a bullish investment case for HYPE.
User Experience & Adoption : Another factor driving Hyperliquid’s growth is its user-centric design in an important niche: leveraged crypto trading. The platform offers *zero gas fees* for trades, sub-1s transaction finality, and up to 50× leverage – essentially delivering a CEX-like experience in DeFi. This has attracted swarms of traders (from retail to high-volume pros) onto the network. The result is deep on-chain liquidity that even *institutions* are tapping into. For example, Tony G’s Co-Investment fund became the first public company to add HYPE to its treasury in early June 2025. And more dramatically, a legendary trader opened a 40× long \ CRYPTOCAP:BTC position worth \$1.1B on Hyperliquid in May – a trade highlighted by former BitMEX CEO Arthur Hayes as proof of the platform’s capacity. This kind of adoption by whales and notable figures not only boosts trading volume (and thus HYPE fees/burns), but also validates Hyperliquid’s tech. It’s no surprise Hyperliquid’s Layer-1 has climbed into the top tier of blockchains by activity. Summed up, *actual usage* underpins HYPE’s value: with hundreds of thousands of users and billions in liquidity engaged, the token has utility (fees, staking, governance) in a live financial ecosystem – a stark contrast to typical meme tokens that live and die by pure speculation.
3. Major Partnerships & Integrations
HYPE’s bullish narrative is further bolstered by an array of strategic partnerships and institutional endorsements that confer credibility and expand its reach:
Exchange & Wallet Integrations : In July 2025, Hyperliquid announced a partnership with Phantom, the popular Solana wallet boasting over 15 million users. Phantom’s integration of Hyperliquid will make it seamless for that vast user base to onboard and trade on Hyperliquid’s chain. This is expected to funnel a wave of new traders into the ecosystem, as evidenced by a volume surge to \$8.4B right after the Phantom partnership news. Additionally, Hyperliquid has been listed on major exchanges (e.g. Bybit added HYPE trading, Binance and others offer HYPE futures), improving access and liquidity for the token. The project’s bridge to Arbitrum and support for MetaMask/Trust Wallet connectivity further lower barriers for new users. These integrations are key to scaling adoption, much as easy accessibility helped Dogecoin and others gain users. For HYPE, each new wallet or exchange integration directly translates to a broader community and more utility, reinforcing bullish demand.
Circle & Stablecoin Support : In August 2025, Circle – the issuer of USDC – launched native USDC on Hyperliquid’s blockchain via its Cross-Chain Transfer Protocol (CCTP). This strategic partnership brings USDC stablecoin liquidity directly into the Hyperliquid ecosystem. As a result, Hyperliquid’s assets under management jumped to \$5.5 billion and HYPE’s price climbed \~3% on the announcement. Native USDC allows users to move funds seamlessly across chains without clunky bridges, making Hyperliquid more attractive for dApp developers and traders. USDC can now be used as collateral for Hyperliquid perpetuals and as a quote asset for spot markets, improving the trading experience. This partnership underscores Hyperliquid’s growing stature in DeFi – *stablecoin issuers are prioritizing it*. In contrast, most meme coins don’t attract such integrations. The Circle deal enhances HYPE’s fundamental value by expanding on-chain liquidity and signaling to the market that Hyperliquid is a serious DeFi player.
Institutional & Corporate Adoption: Perhaps most striking are the moves by traditional finance entities to get exposure to HYPE. In July 2025, Sonnet BioTherapeutics (NASDAQ: SOON) announced a deal to pivot into crypto by creating “Hyperliquid Strategies”, a new entity that will hold \$583 million worth of HYPE (12.5M tokens) as a treasury reserve. In total Sonnet and partners plan to inject \~\$888 million into the Hyperliquid ecosystem via HYPE purchases. This effectively makes Sonnet a proxy stock for HYPE – a novel bridge between equity markets and a DeFi token. The partnership involves heavyweights: Paradigm (co-founder Matt Huang praised Hyperliquid’s “real fundamentals and meteoric growth”), Atlas Merchant Capital (led by ex-Barclays CEO Bob Diamond), Galaxy Digital, Pantera Capital and others co-investing. Around the same time, Lion Group (NASDAQ: LGHL) secured a \$600M facility to accumulate HYPE and other layer-1 assets as primary reserves, aiming to build the world’s largest HYPE treasury. LGHL’s plan includes listing in Asia and underscores their conviction that “decentralized on-chain execution is the future of trading,” with Hyperliquid as a cornerstone. Additionally, biotech firm Eyenovia raised \$50M to acquire \~1 million HYPE and even rebranded to *Hyperion DeFi* in its shift toward the Hyperliquid ecosystem. This institutional traction is virtually unheard of for a meme/community coin – neither DOGE nor SHIB ever saw publicly traded companies restructure around them. Such partnerships validate HYPE’s credibility and inject significant long-term capital (and holding pressure) into the token. For bullish investors, it’s a sign that “smart money” sees Hyperliquid as a platform with enduring value, not just a passing hype.
Influencer & Industry Backing : HYPE has also enjoyed advocacy from prominent crypto figures. Most notably, Arthur Hayes (former CEO of BitMEX) has been a vocal supporter – in May he publicly predicted a dramatic upside for HYPE and disclosed he had acquired millions of tokens. Hayes’ endorsement amplified social media buzz and helped spark the “Altseason” narrative around HYPE. Furthermore, HYPE’s success has prompted integrators like EtherFi to collaborate (launching HYPE staking vaults) and data platforms like Grayscale to consider it in fund holdings. The breadth of partnerships – from big tech (Circle) to TradFi (Nasdaq companies) to crypto-native firms and influencers – sets HYPE apart. It suggests a convergence of communities (retail traders, DeFi users, institutions) coalescing around the Hyperliquid ecosystem. Each partnership expands HYPE’s reach and use cases, feeding a positive feedback loop for its value.
4. Social Traction: Community Hype & Engagement
Rapidly Growing Community : Despite being less than a year old, \ GETTEX:HYPE has cultivated a large and highly engaged community. On X (Twitter), the official Hyperliquid account has \~300,000 followers (as of mid-2025) – an impressive following for a DeFi protocol token. For comparison, legacy meme-coins like Dogecoin have \~4 million followers (built over a decade), and newcomers like PEPE reached \~700k in their viral peak. HYPE’s follower count, achieved organically through its airdrop and subsequent rally, signals strong interest among crypto traders. The community is very active on social platforms: crypto “Twitter” is flooded with HYPE discussions, memes (leaning into the ticker’s theme), and trading analysis. In fact, 46.6% of all tweets about HYPE in Q3 2025 were positive/bullish in sentiment – a notable indicator of optimism. Prominent analysts on X continue to champion HYPE even after pullbacks. For example, well-known traders like *@Ansem* urged followers to “mash the green button” and buy any dips below \$30, reflecting a widespread belief in the token’s upside. This viral enthusiasm has kept HYPE trending on crypto forums and helped attract new buyers during each consolidation.
Narrative of “Next Big Thing” : The social narrative around HYPE combines elements of both a meme coin and a serious altcoin, which has fueled its momentum. On one hand, the ticker “HYPE” and meme-able nature (it’s literally named HYPE) lend themselves to viral marketing – the community often jokes that “the hype is real.” On the other hand, community members frequently share stats about Hyperliquid’s real usage (TVL, volumes) to justify that *“this isn’t just a meme, it’s fundamentally strong.”* This narrative of HYPE being the leading alt of the next cycle has taken hold. Influencers like Arthur Hayes calling for a new “Altseason” led by HYPE have further catalyzed FOMO on social media. Notably, HYPE’s Reddit and Discord communities have also swelled, with users sharing technical governance proposals and how-to guides – indicating an engaged base not just holding for price, but using the network. The community’s energy is reminiscent of early Dogecoin or SHIB days, but with a more “professional” twist (many HYPE supporters are seasoned DeFi users). This blend of grassroots meme energy and informed advocacy creates a potent bullish force: *hype about HYPE* attracts more hype. As long as the community remains excited and active, it provides a steady stream of new entrants and holding support for the token.
Comparative Engagement : It’s worth noting where HYPE’s social traction stands relative to other community tokens. Dogecoin, of course, has the broadest mainstream recognition – boosted by Elon Musk’s occasional tweets and a 10+ year history of internet meme culture. Doge’s community (the “Shibes”) is massive and enduring, but Doge’s social engagement tends to spike only during major news (e.g. Musk changing Twitter’s logo to a Doge symbol) and then quiet down. Pepe (PEPE) had an explosive community growth in spring 2023, riding on the famous Pepe the Frog meme – its holders rallied to a \$1+ billion market cap in weeks purely via viral memes. However, Pepe’s engagement has been highly speculative; by 2025 its community, while still sizable, is largely composed of short-term traders and its meme appeal has somewhat normalized. Floki and WIF (DogWifHat) also have passionate bases: Floki’s “Vikings” are known for aggressive social campaigns and even real-world marketing (billboards, etc.), and WIF’s Solana community used humor (“literally just a dog with a hat”) to drive buzz. HYPE’s community momentum arguably sits between these extremes – it doesn’t yet have the pure virality of a dog or frog meme, but it enjoys credibility that draws in serious enthusiasts. The current narrative on social platforms portrays HYPE as *both* a meme (with tongue-in-cheek slogans about “ride the hype”) *and* the “next Solana” or “next BNB” in terms of growth【50†】. This narrative cocktail supports a bullish bias: it appeals to speculative meme investors and those looking for fundamentally sound altcoins, thereby broadening HYPE’s audience. As long as Hyperliquid continues to deliver growth and the community keeps beating the drum, the social hype-cycle can sustain itself, attracting new buyers on each pullback.
Volatility & Risk Management : It’s important to note that HYPE, like all crypto, remains volatile. Daily swings of 5–10% are common, and its beta is high given it’s both a DeFi altcoin and a community-driven token. For instance, in late May 2025 HYPE dropped \~24% from \~\$39 to \$30 during a broader market shakeout, before roaring back in June. Such swings require caution; traders are advised to watch Bitcoin’s trend (as HYPE tends to move in tandem with altcoin cycles) and broader market liquidity. Still, HYPE’s overall market structure is bullish – higher highs and higher lows on macro frames – as it rides both strong fundamentals and retail enthusiasm. The presence of high-profile supporters and institutional holders may also dampen extreme volatility, as these actors could step in to accumulate on dips (providing some support). The technical outlook, combined with HYPE’s growing fundamentals, suggests that *any sustained positive market environment could see HYPE outperform*, whereas negative shocks could lead to sharper corrections but likely find buyers at key supports. In summary, from a TA perspective HYPE is in a *favorable position*, with a clear uptrend, solid support levels identified, and multiple indicators pointing to continued strength if current conditions hold.
Given these factors, HYPE’s current trajectory does support a bullish bias. It has a lot of positive catalysts in play (platform growth, altcoin market tailwinds, active community) and fewer apparent weaknesses than its meme-coin peers. That said, prudent bulls will acknowledge external risks: a severe crypto market downturn or regulatory action could dampen even the strongest narrative. Meme coins notoriously implode when momentum shifts – HYPE is somewhat insulated by fundamentals, but in a panic its price could still be vulnerable to a swift correction due to how quickly it rose. Additionally, the sustainability of hype is always a question: can Hyperliquid keep delivering growth to maintain excitement? The comparison tokens show that hype can be fickle (Pepe’s flash fame, Doge’s dependence on Musk tweets, etc.). For now, however, HYPE’s blend of substance and hype appears to be striking the right chord. As long as the narrative of “Hyperliquid = next-gen DeFi + community fervor” remains intact and supported by data, the bias among investors is likely to remain bullish on \ GETTEX:HYPE relative to the more purely speculative meme tokens.
In conclusion , \ GETTEX:HYPE offers a compelling bullish case by marrying strong tokenomics (scarce, deflationary, utility-bearing) with explosive ecosystem growth and social momentum. It outshines traditional meme coins on fundamentals and matches them in community enthusiasm, even if it lacks a famous mascot. The extensive partnerships and institutional buy-in further differentiate HYPE as a meme-born token that’s maturing into a legitimate large-cap asset. While no investment is without risk – and HYPE will need to continue “delivering the hype” to justify its rapid rise – its current narrative is one of *leadership in a new market trend*. Compared to \ CRYPTOCAP:DOGE , \ CRYPTOCAP:PEPE , \ SEED_WANDERIN_JIMZIP900:WIF , or \ SEED_DONKEYDAN_MARKET_CAP:FLOKI , HYPE stands out as the most well-rounded bullish prospect. Its momentum is supported by both narrative excitement and measurable adoption, a combination that suggests its hype may have real staying power this cycle. Investors bullish on the altcoin market’s future are therefore biased to view HYPE favorably, as it encapsulates the zeitgeist of 2025’s crypto rally – high performance, community ownership, and yes, a whole lot of *hype*.
