Cello has bottomed out and will move upsideCello According to wave analysis has bottomed out and can give good risk reward from here
Buy At 590 to 600 range
sl 564
target 700
Contains IO script

NZDCAD; Heikin Ashi Trade IdeaIn this video, I’ll be sharing my analysis of NZDCAD, using FXAN's proprietary algo indicators with my unique Heikin Ashi strategy. I’ll walk you through the reasoning behind my trade setup and highlight key areas where I’m anticipating potential opportunities.
I’m always happy to receive any feedback.
Like, share and comment! ❤️
Thank you for watching my videos! 🙏

BTC: Calm before the storm on market, or where we go?Sometimes the market is straightforward: there’s momentum, a trend, a clear direction. But other times—like now—there’s complete uncertainty. Over the past few days, Bitcoin has been trading in a tight range, lacking any pronounced momentum. The price moves back and forth, bouncing off local levels but not breaking out in any meaningful way.
📉 This is especially clear on the 4-hour chart: neither bulls nor bears can take control. Every move upward is quickly met with selling pressure, and attempts to drop are countered by buying. It’s like a “ping-pong” match in a sideways market.
📊 Indicators show low volatility and declining volumes, confirming that market participants are simply waiting. Likely, they’re anticipating an external trigger: news, macroeconomic events, interest rate decisions, ETF developments, or something else.
What could this mean?
Such conditions often precede a strong move. The question is—where to? Honestly, there’s no clear signal yet. Personally, I try not to rush in moments like these: if the market isn’t giving a clear direction, it’s better to take a pause.
That’s the essence of a professional approach: don’t trade just for the sake of trading, but wait until the market speaks more confidently.
What can you do now?
– Watch the range boundaries and wait for a breakout or trade bounces.
– Avoid entering positions based on emotions—pullbacks can be sharp and unexpected.
– Reduce trade sizes if you do enter, and set tight stops.
– Keep an eye on the news—sometimes even neutral news can spark a move.
Sometimes the best decision is to do nothing. This might be one of those times. In a sideways market, you’re more likely to lose than gain. But clarity almost always follows a consolidation.

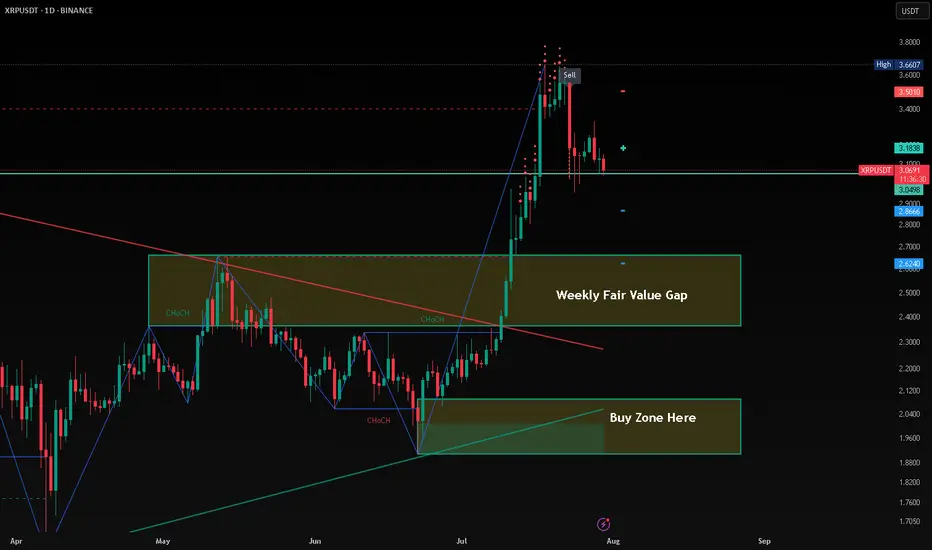
XRP Potential BuyXRP will make a huge correction before taking up. This bearish pattern will last up to October of 2025. My possible prediction Price of XRP by 2026 is $12 -$15 mark up.
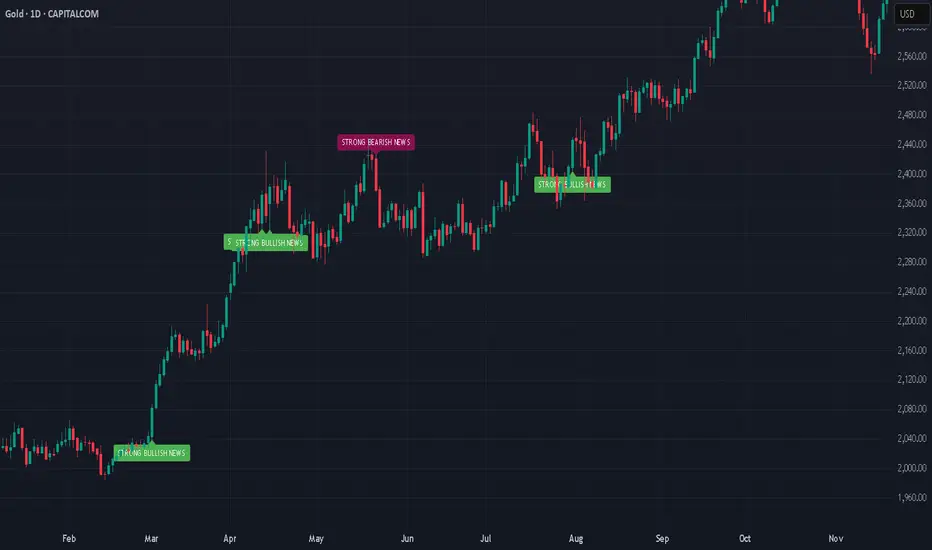
Gold - Powerful RunAfter its powerful run, gold has shown signs of fatigue, stalling near technical resistance between $3,330–$3,350 per ounce in late July. Analysts warn that while the bullish trend remains intact on a structural level, daily volatility is high and some profit-taking or consolidation could continue unless new destabilizing events emerge.
Will the Rally Continue?
The Bull Case
Structural Demand: Multiple sources, including J.P. Morgan and other major forecast groups, predict gold’s structural bull case remains strong with average prices of $3,220–$3,675 per ounce likely through the end of 2025, and even $4,000 possible by 2026.
Ongoing Uncertainty: Persistent geopolitical risks, trade disputes, and fiscal pressures are expected to maintain robust safe haven flows into gold.
Central Bank and Asian Demand: Sustained buying by central banks and consumers in Asia could provide a solid floor below current levels.
The Bear Case
Interest Rate Dynamics: If central banks, especially the US Federal Reserve, hold or increase interest rates, gold could lose momentum, higher rates increase the opportunity cost of holding non yielding bullion.
Diminishing New Risks: Unless fresh economic or geopolitical shocks appear, further upside may be capped in the near term. Several experts predict gold may consolidate or trade sideways pending new catalysts.
Speculator Flows: Rapid speculative bets could lead to sharp corrections, particularly on technical breakdowns after such a strong rally.
Conclusion
The gold rally of 2025 has been driven by an unusual mix of global volatility, central bank behavior, and shifting investor psychology. While prices could pause or pull back in the coming months, the fundamental supports structural demand, central bank buying, and persistent global risks, suggest that the broader gold bull cycle is not yet over, with $3,000+ likely forming the new base for gold as we look toward 2026.
*NOT INVESTMENT ADVICE*
#gold #safehaven #uncertainty #economy #finance #trading #indicator
bullish move can start. good risk reward swing tradePerfect spot to buy as comppany has also shown positive quaterly result.
small time swing trade

perfect buying spot with risk reward of 1 : 6buy at 470 to 475 levels
sl 458 daily candle closing basis
target 570

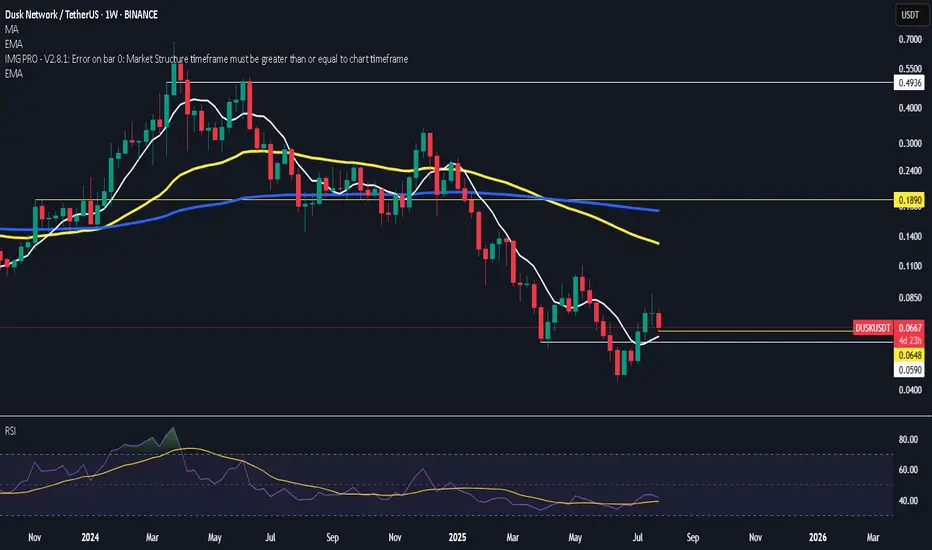
$dusk 2% stop playing it on a weekly time frame targeting 200 ema and yellow line confluence for 50% riding the rest for the inevitable God candle
BTC Moon Phase, Dominance % and BBWP resolutionBTC, D. Moon Phase. I see bearish scenario for the next days, until 4-5th of August. After reviewing Moon Phase chart for last year+, I see same scenario is happening most of the times. During the First Quarter ( Aug. 1) of the phase, price is dropping and start to recover about 4-5 days prior Full Moon. This is exactly when energy of the Full Moon starting to amplify. Current BBWP is contracted for 8 days, making the next move very rapid, I would not set any long/short trades, untill the volume start to expand. Its the mid summer - always slow and August is the month it start to accelerate towards the Fall, with all financial/political tricks happening in September and later in Q4. We already had one bear trap fakeout, but price didnt anticipate to go higher and got rejected by falling wedge upper like ( or bull flag, in this case).I would expect that high volume green candle will be either fully recovered to $110-111K , or 75% recovery, where the CME gap is $113500 - 1-2% lower, making it $113,000. The cascade liquidation will happen very fast, I expect the whole move down and up will take around 24 hours, with the bottom time 5-15 minutes. Need to be ready, that all alts will crash as well, Im expecting BTC %dominance to bounce here , after 8.4% drop to weekly 50EMA. I would like to see BTC, D% at 70% by Christmas and new ATH, what ever it is 160K or 200K what ever it is, for bitcoin to make ATH, it must grab dominance.

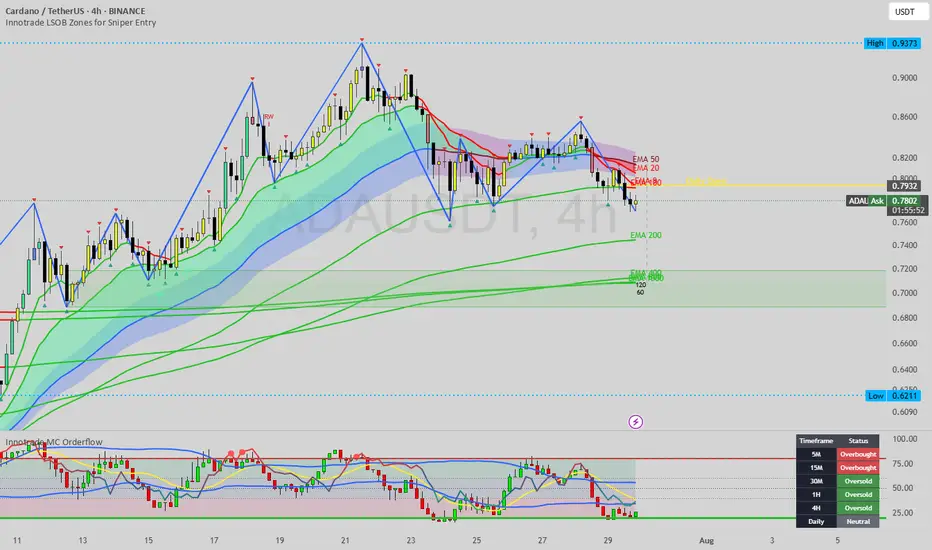
Cardano (ADA) at Key Support: A High-Confluence "Buy" Hello, traders.
Today we are focusing on Cardano (ADA), which is currently in a strong, established uptrend. After a significant rally, the price has entered a healthy corrective phase and is now testing a critical zone of technical support. This is a classic "buy the dip" scenario shaping up.
This analysis will detail the powerful confluence of structural, dynamic, and momentum-based signals that suggest the current level is a high-probability area for the uptrend to resume.
The Analysis: Stacking the Bullish Confluences
The most robust trade setups are built on a foundation of multiple, independent technical factors all telling the same story. Here’s the compelling narrative for a bullish continuation on ADA:
1. The Dominant Bullish Structure:
First, the market context is undeniably bullish. The Zig-Zag indicator paints a clear picture of a healthy uptrend, with a consistent series of higher highs and higher lows. As long as this structure remains intact, our primary bias should be to look for opportunities to join the trend, not to fight it. The current downturn is a correction, not a reversal.
2. The Dynamic Support Cluster:
Price has now pulled back directly into a major confluence of dynamic support.
The EMA 100 & EMA 200: The price is currently testing the EMA 100 / EMA 200 band. This zone is one of the most significant support areas in an uptrend. Strong trends often find their footing and resume their advance after testing this key moving average cluster.
3. The Crucial Timing Signal (Multi-Timeframe Exhaustion):
This is the key to our timing. As the price has entered this major support zone, our momentum dashboard shows that selling pressure is becoming exhausted.
The 1H and 4H timeframes are both flashing "Oversold." This is a critical piece of information. It tells us that on the chart's native timeframe (4H) and the one below it, sellers have lost their momentum precisely at a point where buyers are expected to step in.
4. The Time-Based Pivot Signal:
Adding another layer of non-price-based confluence, a Fibonacci Time Cycle (purple lightning bolt icon) has recently printed. These cycles often mark temporal turning points where a trend can pivot. The alignment of a time-based signal with price-based support and momentum exhaustion creates a very powerful setup.
The Potential Trade Plan
Based on this strong stack of confluences, here is a potential trade plan:
Entry Zone: The current area around the EMA 100 / EMA 200 ($0.75 - $0.78) is the ideal zone to watch for bullish price action and potential entries.
Stop Loss: A logical stop loss can be placed below the recent swing low and the EMA 200, around $0.73, to protect against a deeper correction.
Potential Targets:
Target 1: A reclaim of the Daily Open at $0.7936.
Target 2: A test of the recent swing high around $0.85.
Target 3: A full retest of the major high at $0.9349.
Conclusion
We have a textbook confluence of bullish signals on Cardano: the price is correcting within a confirmed uptrend, has entered a major dynamic support cluster (EMA 100/200), and is doing so just as multi-timeframe momentum signals widespread seller exhaustion at a potential time-based pivot point. This presents a compelling, high-probability setup to "buy the dip."
Disclaimer:
This analysis is for educational purposes only and does not constitute financial or investment advice. Trading involves a high level of risk. Always conduct your own thorough research and consult with a licensed financial advisor before making any trading decisions.
HBAR: Capitulation - A Major Bottom and High-Reward LongToday we're looking at Hedera (HBAR), which has just experienced a waterfall decline, breaking key structural levels in a classic capitulation event. While the immediate trend is aggressively bearish, these are the exact conditions that often precede major market bottoms and powerful V-shaped recoveries.
This analysis will break down the overwhelming evidence of seller exhaustion and why the current level presents a rare, high-reward opportunity for a counter-trend long position, targeting a significant rally.
The Analysis: The Case for a Generational Bottom
Trading against a strong trend is inherently risky, but the data becomes compelling when a market reaches a state of extreme, multi-timeframe exhaustion. Here is the confluence of signals pointing to a major bottom on HBAR:
1. CRITICAL - The Capitulation Signal (Widespread Oversold Conditions):
This is the single most important factor. Our momentum dashboard is showing a profound alignment of exhaustion: the 30M, 1H, 4H, and—most importantly—the Daily timeframes are all simultaneously deep in "Oversold" territory. When the daily chart signals this level of exhaustion, it's often a sign of a macro trend pivot, not just a minor bounce. This is a textbook signal of seller capitulation.
2. The Time-Based Pivot (Fibonacci Time Cycle):
Adding a powerful, non-price-based confluence is the appearance of a Fibonacci Time Cycle (the purple lightning bolt) precisely at the recent low. These cycles often mark temporal points where a trend exhausts itself. The alignment of extreme oversold price conditions with a time-based pivot point is a very strong indication that a turn is imminent.
3. Test of Major Dynamic Support (EMA 400):
The price found its footing and is starting to bounce from the vicinity of the EMA 400. This long-term moving average is a significant level that often acts as a major floor for price during larger corrective moves within a macro uptrend.
4. Highly Asymmetric Risk-to-Reward Profile:
This is a classic high-reward setup. By entering near the absolute lows, a trader can define their risk with a very tight stop loss. The potential upside, however, is substantial. A recovery would first target the Daily Open and then potentially the previous highs, creating a scenario where the potential reward vastly outweighs the defined risk.
The Potential Trade Plan
This is an aggressive but calculated trade plan designed to capture the beginning of a potential new bullish impulse from a point of maximum fear.
Entry Zone: The current price area represents the point of maximum opportunity. Look for signs of a base forming as buyers begin to step in.
Stop Loss: A very tight stop loss can be placed just below the absolute low at $0.25800. A break of this level would invalidate the immediate reversal thesis.
Potential Targets:
Target 1: A reclaim of the Daily Open / Psy-Lo level around $0.2715 - $0.2750.
Target 2: The major swing high and Psy-Hi level at $0.30500, which would represent a full V-shaped recovery.
Conclusion
While the recent price action has been extremely bearish, the confluence of signals—a rare multi-timeframe oversold condition, a time-based pivot point, and a test of major long-term support—points towards a potential major market bottom. For traders willing to take on calculated risk, the current levels on HBAR offer a compelling, high-reward opportunity to catch what could be the start of the next major rally.
Disclaimer:
This analysis is for educational purposes only and is not financial advice. Trading involves a high level of risk, especially when attempting to trade against a strong trend. Always conduct your own thorough research and consult with a licensed financial advisor before making any trading decisions.

GIGA: Extreme Capitulation - A Potential Major Bottom - LongToday we are looking at GIGA, which has just undergone a brutal capitulation event, wiping out the recent gains. While the bearish momentum has been fierce, such violent moves often culminate in extreme exhaustion, presenting rare opportunities for high-reward reversal trades.
This analysis will break down the compelling confluence of signals that suggest the selling pressure has reached its limit and that the current price level could be a significant, long-term bottom. We will outline the bullish case for entering a long position, targeting a powerful "V-shaped" recovery.
The Analysis: The Case for a Major Reversal
While buying into such a steep drop is inherently risky, the data suggests that the risk-to-reward profile is now heavily skewed to the upside. Here’s why:
1. CRITICAL - The Capitulation Signal (Extreme Multi-Timeframe Exhaustion):
This is the single most powerful argument for a bottom. Our momentum dashboard is showing a rare and profound alignment: the 15M, 30M, 1H, 4H, and—most importantly—the Daily timeframe are all simultaneously deep in "Oversold" territory. When the daily chart becomes this oversold, it often signals a macro bottom, not just a temporary pause. This is a textbook sign of seller capitulation.
2. The Reversal Zone (Fibonacci Extension & New Demand):
Price has crashed through the 100% level and found its footing deep within the Fibonacci extension zone (127.2% - 161.8%). Historically, these deep extension levels are common termination points for corrective waves, as they represent points of maximum fear and panic. Concurrently, a new demand zone (labeled "120" / "80") is being carved out, indicating that smart money may be starting to accumulate at these depressed prices.
3. Asymmetric Risk-to-Reward:
From a trade management perspective, this setup is highly attractive. By entering near the lows, a trader can define their risk with a very tight stop loss placed just below the absolute low. The potential upside, however, is massive, with the first major target being a reclaim of the prior range. This creates a highly asymmetric opportunity where the potential reward vastly outweighs the initial risk.
The Potential Trade Plan
This is an aggressive, counter-trend trade that aims to capture the start of a new bullish impulse.
Entry Zone: The current area between $0.01750 and $0.01800 represents the point of maximum opportunity. Look for signs of a bottom forming, such as price starting to hold the lows and make small higher lows on the lower timeframes.
Stop Loss: A tight stop loss can be placed just below the absolute low, around $0.01720. A break of this low would invalidate the immediate reversal thesis.
Potential Targets:
Target 1: A reclaim of the Daily Open / 100% Fib level at $0.01925. This would be the first sign that bulls are back in control.
Target 2: A move back to the major resistance cluster and prior breakdown point around $0.02050 - $0.02100.
Target 3: A full retest of the major swing high at $0.02534.
Conclusion
While the recent price action has been bearish, the overwhelming evidence of multi-timeframe seller exhaustion, combined with the price hitting a key Fibonacci reversal zone, presents a powerful case for a major bottom. For traders with a higher risk appetite, the current levels on GIGA offer a rare, high-reward opportunity to catch the potential start of a massive recovery.
Disclaimer:
This analysis is for educational purposes only and is not financial advice. Trading involves a high level of risk, especially when attempting to trade against a strong trend. Always conduct your own thorough research and consult with a licensed financial advisor before making any trading decisions.
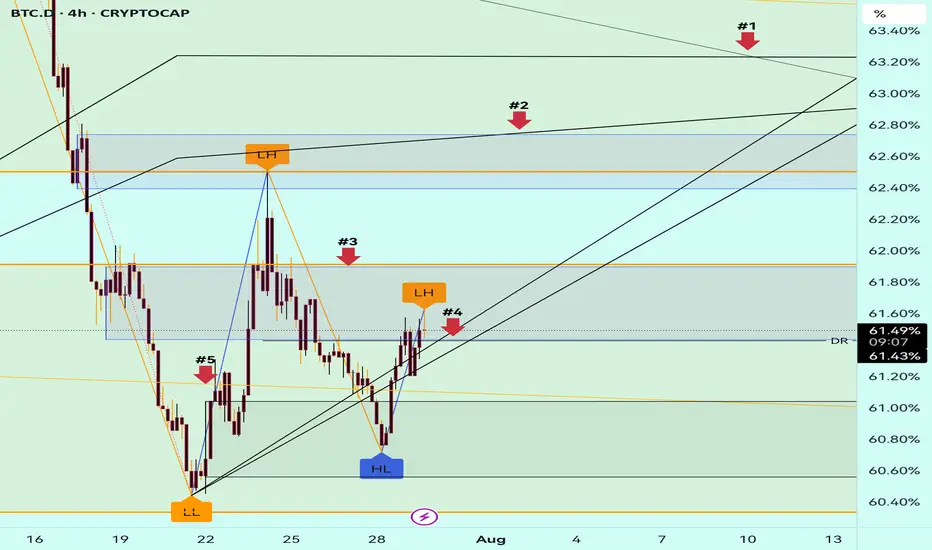
#BTC.D Update 29.07.2025BTC Dominance is trying to break above the black resistance lines, but honestly, I don't see enough strength yet to confirm a full reversal. On the daily timeframe, it’s still holding a strong downtrend structure. 🟥
🔍 If price manages to break above Arrow #4, we still have a key resistance at Arrow #3, which won’t be easy to pass.
On the lower timeframes, there are already a few bearish signs forming — but nothing solid enough yet for confirmation.
⚠️ That’s why I prefer to wait for today's daily candle to close before making any new decisions. There's also a chance BTC.D may retest Arrow #3 before reversing again.
💡 What does this mean for us?
It’s not time to jump in just yet — but the moment is getting closer, Insha Allah. If this dominance starts to turn down again, we could soon see ALTCOINS shine once more! 🌟
📈 Be ready. Stay focused. Patience pays in this game. 🚀
Altseason might just be warming up!
EURAUD; Heikin Ashi Trade IdeaIn this video, I’ll be sharing my analysis of EURAUD, using FXAN's proprietary algo indicators with my unique Heikin Ashi strategy. I’ll walk you through the reasoning behind my trade setup and highlight key areas where I’m anticipating potential opportunities.
I’m always happy to receive any feedback.
Like, share and comment! ❤️
Thank you for watching my videos! 🙏

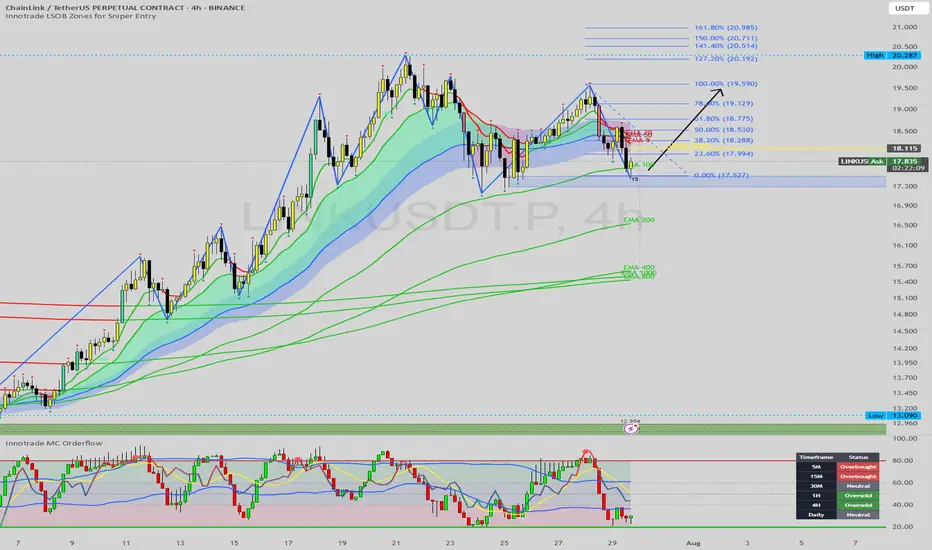
LINK at a Crossroads: A High-Confluence Setup at Key SupportToday we're analyzing Chainlink (LINK), which is currently testing a critical support level after a sharp pullback from the $20.28 highs. The price is now situated at a technical crossroads that will likely determine its next major directional move.
This analysis will detail the powerful confluence of technical factors that make the current zone a high-probability area for a bullish reversal. This is an educational breakdown of how to stack multiple signals to identify a strong "buy the dip" opportunity within a larger uptrend.
The Analysis: A Convergence of Bullish Factors
The most reliable trade setups occur when several independent indicators all point to the same conclusion. On this 4-hour chart for LINK, we have a textbook example of such a convergence.
1. The Overarching Bullish Structure:
First, let's look at the big picture. The Zig-Zag indicator shows a clear and healthy uptrend, defined by a series of higher highs and higher lows. This establishes our primary bias. The current downward move is corrective, not a trend reversal, meaning our focus should be on finding logical entry points to rejoin the dominant trend.
2. The Critical Support Cluster:
LINK is currently testing a powerful floor of support between $17.30 and $17.80. This is not just one level, but a cluster of three key support elements:
Prior Swing Low: The price is testing a key structural low, a natural point where buyers are expected to show interest.
Demand Zone / Order Block: A significant demand zone (the blue-shaded area) is located here, representing an area of prior institutional buying interest.
The EMA 100: Providing a strong layer of dynamic support, the EMA 100 is flowing directly into this structural and order block zone. The confluence of these three factors creates a formidable support area.
3. The Momentum Exhaustion Signal:
This provides the crucial timing for our setup. While the price has been dropping, our momentum dashboard shows that sellers are running out of steam precisely as price hits this key support cluster.
The 1H and 4H timeframes are both registering as "Oversold." This indicates that on the timeframes most relevant to our chart, selling pressure is exhausted. It's a classic sign that the corrective move is overextended and a reversal is likely.
The Potential Trade Plan
Based on this strong alignment of structure, support, and momentum, here is a potential trade plan:
Entry Zone: The current support cluster between $17.30 and $17.80 is the ideal zone to watch for bullish price action and potential entries.
Stop Loss: A logical stop loss can be placed just below the recent swing low and the demand zone, around $17.10. A break below this level would invalidate the immediate bullish thesis.
Potential Targets:
Target 1: A reclaim of the Daily Open at $18.11.
Target 2: A test of the overhead resistance and the descending short-term MAs in the $18.80 - $19.20 area.
Target 3: A full retest of the major swing high at $20.28.
Conclusion
We have a powerful confluence of bullish factors: the price is respecting a primary uptrend structure, it has entered a key support cluster (swing low + demand zone + EMA 100), and multi-timeframe momentum is signaling that sellers are exhausted. This presents a compelling, high-probability setup for a long position on Chainlink.
Disclaimer:
This analysis is for educational purposes only and does not constitute financial or investment advice. Trading involves a high level of risk. Always conduct your own thorough research and consult with a licensed financial advisor before making any trading decisions.
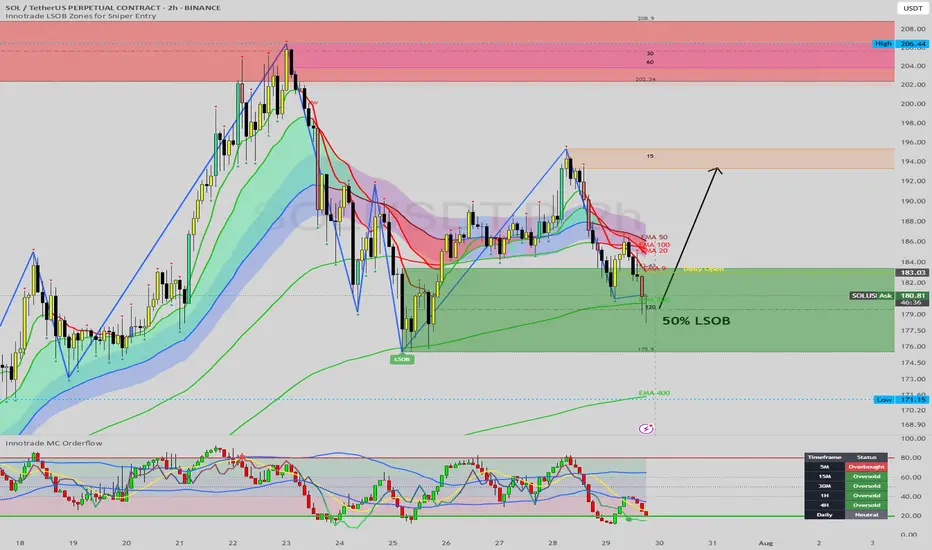
SOL Taps Major Demand: A High-Confluence Long Setup at EMA 200Hello, traders.
Today we are examining Solana (SOL), which has just pulled back into a technically significant area of interest after a strong rejection from the $206 highs. While the recent drop has been sharp, it has brought the price into a major demand zone that aligns perfectly with key long-term support levels.
This analysis provides a step-by-step breakdown of the confluent technical factors suggesting that the current level offers a high-probability opportunity for a bullish reversal and the continuation of the primary uptrend.
The Analysis: Stacking the Bullish Confluences
A robust trading idea is formed when multiple, independent technical signals align. On this 2-hour chart for SOL, we have a powerful convergence of factors:
1. Primary Market Structure (Uptrend Intact):
First and foremost, the context is bullish. The Zig-Zag indicator clearly shows a well-defined uptrend with a series of higher highs and higher lows. The current price action, while corrective, is still holding above the previous major low. As long as this structure holds, our bias should be to buy the dips in anticipation of the next leg up.
2. The Institutional Demand Zone (LSOB):
Price has now entered the large green LSOB (Liquidity Sweep Order Block), a critical zone spanning from roughly $175.5 to $183. These zones represent areas where significant buying interest and institutional order flow previously entered the market. The price has wicked directly into this demand zone, indicating a reaction from buyers.
3. Dynamic Support Confluence (The EMA 200):
Adding immense strength to this demand zone is the EMA 200, which is flowing directly through the middle of the LSOB. The EMA 200 is a widely respected long-term moving average that often acts as powerful, dynamic support in an uptrend. The fact that price has respected this level almost to the dollar is a strong confirmation of its significance.
4. Multi-Timeframe Momentum Exhaustion:
This is perhaps the most compelling timing signal. Our MC Orderflow oscillator is deep in the green "Oversold" territory, indicating that selling pressure on this timeframe is exhausted.
More importantly, the Dashboard reveals that this condition is widespread. The 15M, 30M, 1H, and 4H timeframes are all simultaneously flashing "Oversold." This cross-timeframe alignment of momentum exhaustion is a powerful signal that the corrective move is likely nearing its end.
5. Fibonacci Time Cycle:
A small but significant detail is the Fibonacci Time Cycle icon (the lightning bolt) that appeared near the recent low. These cycles can often mark key turning points in time, suggesting that the market is chronologically primed for a potential pivot.
The Potential Trade Plan
Based on this powerful stack of confluences, here is a potential trade plan:
Entry Zone: The current LSOB / EMA 200 area, from $179 to $181, represents a strong zone for entries.
Stop Loss: A logical stop loss can be placed just below the LSOB and the recent swing low, around $174.50. A break of this level would invalidate the bullish structure.
Potential Targets:
Target 1: A reclaim of the Daily Open at 186
Target 2: The intermediate supply zone and recent swing high around $194 - $196.
Target 3: A full retest of the major high at $206.
Conclusion
We have a textbook example of technical confluence: a pullback to a major LSOB demand zone that aligns perfectly with the long-term EMA 200, all while multi-timeframe momentum indicators show clear seller exhaustion at a potential time-based turning point. This presents a compelling, high-probability case for a long position on Solana.
Disclaimer:
This analysis is for educational purposes only and does not constitute financial or investment advice. Trading involves a high level of risk. Always conduct your own thorough research and consult with a licensed financial advisor before making any trading decisions.
Potential 33% gain in ELVELV has a potential for a reversal for potentially 33% gain.
Using the Data Distribution with Extreme Clusters custom indicator, we can see that the stock is overextended on both the 5D chart (longer term) and 1D (shorter term) chart.
The last weekly bar ended up on a very high volume. Looking at the trends, one thing that is often noticeable, is that moves end and begin on large volume. Since it is down 40% off its highs, coupled with large volume, there is a possibility that the stock will reverse.
Zero-Lag USI on 1D chart is showing a buy signal as the background changed to green, while Zero-Lag USI on 5D chart is showing a black background, which means that there is a possibility that momentum of the stock may change.

DXY Buyers Catching BidSee chart for analysis but even with price sitting inside levels of supply, we could easily see stronger Fundamentals coming out to drive this dollar back up into 100.5 areas of monthly supply. Short-term I remain bullish with long term views to the downside.

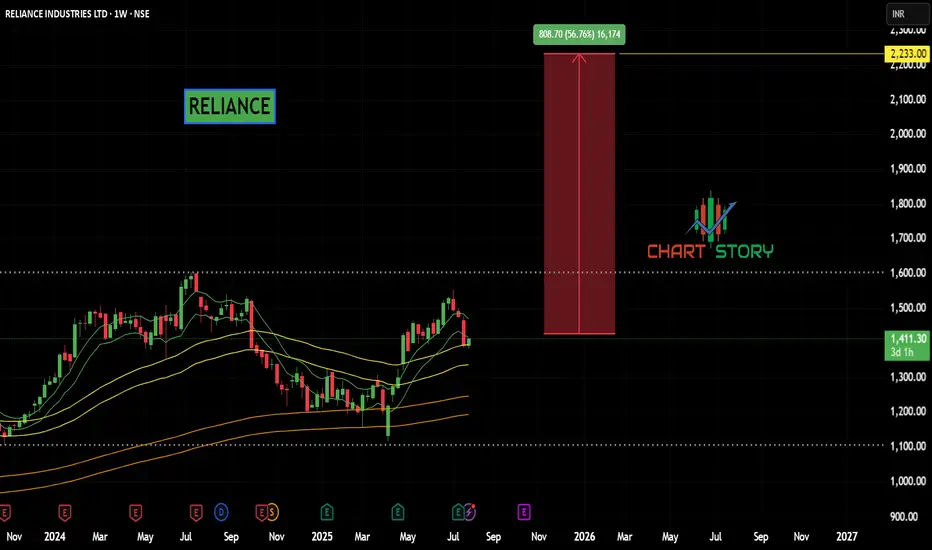
RELIANCE - PARABOLIC BUYNSE:RELIANCE Weekly parabolic formation may continue further upward trend for short to mid term.

DXY dont take these charts serious its just my way to keep myself entertained while finding levels etc.. no your usual boring systematic shiiiteee!! IRISH CRAIC ONLY!!! ☘