$GTC textbook MTF Stoch Wave reversal patternA clear example of a textbook MTF Stochastic Wave, see the example of that on the top right. Showed three distinct entries with Gray stoch curve tapping down each time while the gap between gray and blue kept getting bigger indicating a stronger fakeout each time and while Green was gearing upwards, indicating an impulse wave coming...
Contains IO script

Symmetrical TriangleA symmetrical triangle is a chart formation where the slope of the price’s highs and the slope of the price’s lows converge together to a point where it looks like a triangle.

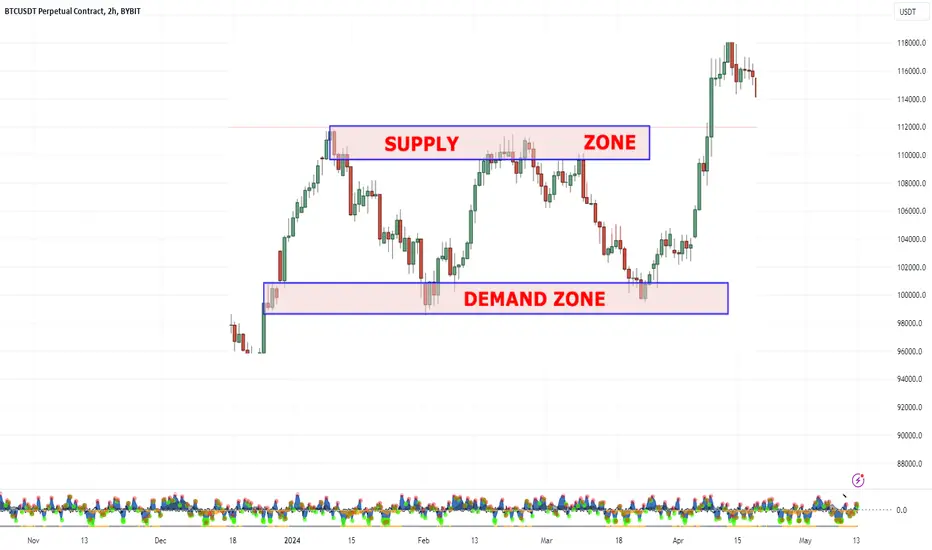
💰WHAT IS SUPPLY AND DEMAND? In trading, the fundamental concept of supply and demand serves as the cornerstone for understanding price movements. Supply represents the quantity of a particular asset available for purchase, while demand signifies the desire of buyers to acquire that asset. When supply exceeds demand, prices typically decrease as sellers compete to attract buyers. Conversely, when demand surpasses supply, prices tend to rise due to heightened competition among buyers.
To contextualize this concept using Bitcoin as an example, let's consider its decentralized nature and limited supply. Bitcoin's supply is predetermined and capped at 21 million coins, with new coins created through mining at a diminishing rate. Meanwhile, demand for Bitcoin fluctuates based on various factors such as market sentiment, institutional interest, regulatory developments, and macroeconomic trends.
By analyzing supply and demand dynamics, traders can gauge market sentiment and anticipate potential price movements. High volume players, such as institutional investors or large-scale traders, often leave discernible footprints in the market through their buying and selling activities. Tracking these players' actions can provide valuable insights into shifts in supply and demand dynamics.
In practice, traders employ various techniques and rules to identify supply and demand levels on price charts. These may include analyzing price structure, volume profiles, support and resistance zones, and price action patterns. By accurately identifying supply and demand areas, traders can make informed decisions regarding market entry, exit, and risk management strategies.
Follow for more
✨Unlock Market Mastery: How Wyckoff Theory Made Me a fortune!
The Wyckoff Model is a trading approach based on several key principles:
1. Law of Supply and Demand: Prices move based on the balance between supply (sellers) and demand (buyers).
2. Law of Cause and Effect: The market goes through phases of accumulation (building up) and distribution (selling off), leading to subsequent mark-up (price increase) and mark-down (price decrease) phases.
3. Law of Effort and Result: The relationship between the effort (volume) put into the market and the resulting price movement.
4. Accumulation and Distribution: Recognizing patterns where large players accumulate or distribute assets.
5. Analysis of Price, Volume, and Time: Understanding market movements by analyzing these three factors together.
While the Wyckoff Model provides valuable insights, it's important to note that it rarely appears perfect and is often overlooked by many traders. However, experienced traders can spot its patterns across various markets. Higher volume and liquidity markets tend to offer better opportunities.
In my years of trading Bitcoin, I've refined the Wyckoff Model into what I call the Trinity Model, which has been instrumental in many of my successful trades. Follow and boost for more insights! 📈✨🚀

MARKET SAARTHI- STRONG BUY EXPLAINEDstrong buy @ max resistance area is level of highest resistance a script is likely to face from previous days of price action, though not computed those ways but in most cases, it represents the zone of call writers, historic resistance (in time frame u are trading) could bring reversal once we have price rejection from the area. it’s a area of high activity thus a user should be trading with caution and waiting out for strong buy signal for a highly trending move.
rules for trading max resistance area:
1) strong buy candle should be fully green
2) in case follow up candle is big and meets first 2 levels in a single move, our entry should be on hold and wait for price to retrace back to max resistance area.
3) upon retracement if we get consolidation with green candles, we can plan an entry above high of reference candle with ref candle low being sl.
4) targets will be levels above
5) in case of strong buy till price is trading above max resistance area, upon breaking of each level new entries can be initiated by keep low of breakout candle as sl.

QBUY- QUICK BUY FOR SCALPING EXLPAINEDhow to take trade using marketsaarthi ?
in today’s video we will see how q buy function in marketsaarthi should be used to take trade.
q buy – it basically stands for taking quick buy option, since q buy signal would generate from extreme levels of low a script can make in intraday, we can’t go for big targets. a quick buy will give points in range of 7-30 (in index options)
rules for valid q buy trade: -
1) next candle should be closing above or within the body of q buy candle, if next candle closes below qbuy candle the signal is invalid
2) in case candle is closing within the body of q buy candle, high of q buy candle can be used as entry point…
3) if q buy is formed near any level that is its high is near the level (2-3 points) gap only, we can wait for that level to be broken for entering in trade and above levels will be our targets.
4) stop loss- we can have stop loss as low of q buy candle or a user can keep sl as per their risk appetite. but stop loss in q buy trade is must.
ideal time frame for q buy- 1mint & 3 mints
application- index spot charts, index call chart, stocks
(one can avoid using q buy feature on stock call option)

Having a bias doesn't mean having a trading opportunityHaving a bias doesn't mean having a trading opportunity.
We all have a bias on the market, that is defined by our experience and trading approach. And it's not wrong or bad to have it. Problem starts when we're holding onto it too much and when we start to think we know almost for sure where and more importantly - how - the market will move into certain direction.
Indeed, it's pretty easy to read basic trends and "predict" the direction of the market. However, it's basically impossible to tell how the market will do it. And it can move in a number of ways. For example, even though we might be right on overall bullish direction, market can make numerous manipulations to the downside before making a move higher ("Ha! See, I told you it will move higher!"). Or it can move higher, but in a very unclear, rangy fashion. Add flats, accumulations and distributions, fundamental factors etc.
So, objectively, anything can happen and no one really knows the outcome of any particular trade. Having a bias doesn't mean having a trading opportunity. What one knows is if he's following the backtested process of finding and executing on setups. So we can say if the decision is good in the moment of placing trade, not after the outcomes happened.
This uncertainty is how we can ease our greed, fear, pride or shame.. Because if no one really knows, and that's the only truth, than what's the point of getting so serious about our bias. It's not that WE predicted some market move or moved it with our trend lines, zones and any other concept. No one actually did.
What we did is worked and explored to understand approximate patterns and than executed on something familiar, having only one realistic expectation - that we don't know how the price will develop.

QUICK GUIDES: Fibonacci SettingHere is a quick guide on how I have my FIB RETRACEMENT TOOL set up with Retracement & Extension levels.

What is FLAT in the markets, practical tips☝️Do not act based on my analysis, do your own research!!
The main purpose of my resources is free, actionable education for anyone who wants to learn trading and improve mental and technical trading skills. Learn from hundreds of videos and the real story of a particular trader, with all the mistakes and pain on the way to consistency. I'm always glad to discuss and answer questions. 🙌
☝️ALL videos here are for sharing my experience purposes only, not financial advice, NOT A SIGNAL. YOUR TRADES ARE YOUR COMPLETE RESPONSIBILITY. Everything here should be treated as a simulated, educational environment. Important disclaimer - this idea is just a possibility and my extremely subjective opinion. Do not act based on my analysis, do your own research!!

Three Aspects of a Trade Entry, Risk Management, ExitWelcome to our discussion on the three vital aspects of a trade: Entry, Risk Management, and Exit. Mastering these components is crucial for successful trading. Let's delve into each aspect, understanding their significance and how they contribute to your trading strategy.
Entry:
The entry point marks the initiation of a trade. While it may seem straightforward, it sets the foundation for your entire trade. When choosing an entry point, consider factors such as market trends, support and resistance levels, and technical indicators. Your entry should align with your trading plan and signal a high probability of profitability. Remember, a well-timed entry can maximize your potential gains and minimize risks.
Risk Management:
Effective risk management is the cornerstone of trading success. This aspect requires careful consideration and planning. Assess the amount of capital you're willing to risk on each trade and set appropriate stop-loss levels to limit potential losses. Remember, preserving capital is paramount to long-term profitability.
Exit:
The exit point marks the closure of a trade and realization of profits or losses. While it's often considered the simplest aspect, it's equally critical. Establish clear exit criteria based on your trading strategy, whether it's a predetermined price target, trailing stop, or technical signal. Stick to your exit plan without succumbing to emotional impulses or market noise. A disciplined approach to exiting trades ensures that you capture profits while minimizing potential losses.
Importance of Each Aspect:
Entry: Sets the stage for the trade and influences its outcome.
Risk Management: Protects your capital and ensures longevity in trading.
Exit: Determines the realization of profits and mitigation of losses.
In summary, prioritize each aspect of the trade process, giving due attention to entry, meticulous risk management, and disciplined exits. By mastering these fundamentals, you'll enhance your trading skills and improve your overall performance in the markets.

Its ok to take a LOSSThis video breaks down how its ok to take a loss even when our plan does work out in the long run. We have to be able to maintain these good risk management habits even if we are eventually right. Because in the event we aren't right on the end we have a much heavier loss that's harder to recover from.

HOW-TO: Trade-o-Scope Plot Custom DataThis is a short HOW-TO on using the Trade-o-Scope "Plot Custom Data" indicator

Trade Entry and Management Techniques Using Swing High PivotsIn today's video idea, we will delve into a comprehensive strategy for trade entry and management, centered around utilizing swing high pivots as crucial reference points. We will also explore the effective integration of technical tools such as Outer Bands, ribbons, and Target View Trades (TV-Trades) to enhance precision in trading decisions. By the end of this tutorial, you will gain valuable insights into determining trade viability and optimizing trade execution.
Understanding Swing High Pivots:
Swing high pivots serve as pivotal landmarks in market analysis, offering valuable insights into potential trade setups. When identifying swing high pivots, focus on significant price peaks that indicate potential trend reversals or continuation points. These points will serve as key references for evaluating trade opportunities and managing risk effectively.
Trade Entry Strategies:
Utilizing swing high pivots as reference points, assess the market conditions to determine the viability of trade entry. Look for confluence with other technical indicators such as Outer Bands and ribbons to validate trade setups. Prioritize trades that align with the prevailing market trend and exhibit strong momentum, increasing the probability of success.
Managing Trades:
Once you enter a trade, it is essential to implement effective management techniques to optimize profitability and mitigate risks. Continuously monitor price action relative to swing high pivots and technical indicators to gauge trade performance. Implement trailing stop-loss orders to protect profits and minimize potential losses as the trade progresses.
Integration of Technical Tools:
Explore the functionalities of technical tools such as Outer Bands, ribbons, and Target View Trades (TV-Trades) to refine trade entry and exit points further. Outer Bands provide larger trend information, aiding in direction, trade confirmation and risk management. Ribbons offer visual cues for trend direction and momentum, enhancing trade precision. Target View Trades (TV-Trades) provide a systematic approach to identify optimal entry and exit points, facilitating disciplined trading execution.
Conclusion:
Mastering trade entry and management techniques is essential for navigating the dynamic landscape of financial markets successfully. By incorporating swing high pivots and leveraging technical tools effectively, traders can make informed decisions, capitalize on lucrative opportunities, and achieve consistent profitability in their trading endeavors. Continuously refine your skills through practice and experimentation, adapting to evolving market conditions for sustained success.

HOW-TO: Trade-o-Scope Multi-Asset Price TrackerThis is a short HOW-TO on using the Trade-o-Scope "Multi-Asset Price Tracker" indicator

Quick Lesson on How to Play Gaps in Price Action This video breaks down the gap fill strategy that i like to use and shows the example of how NASDAQ:GOOGL reacted to the price and where we can look to take advantage of these price moves. Remember that nothing is for certain! Trade Safe!

HOW-TO: Accumulation Strategy 2024What if instead of buying a stock, crypto, currency only once and holding until we are in profit, we split our strategy capital and buy several times, until the total is in profit ? Yes, that is DCA you’d say. Ok, but what if instead of buying at predetermined intervals, we bought at oversold RSI, or on a double bottom, for example ? That’s the idea behind the Accumulation Strategy, which I’m going to explain in detail in this article.
█ Simple Example
The strategy comes with several features, and the easiest way to explain them is through examples.
The Max Active Deals input allows to limit how many times the strategy can trigger a buy in a trade, just like the pyramiding setting. It can go up to 100.
In this example, the strategy has 10 max active deals. and is using the RSI feature to buy when RSI crosses below a configurable threshold, here 25.
Note: to get stronger signals, the RSI time frame has been set to 1 hour, since the chart is in a 30 min time frame.
In this trade, the strategy bought 8 times (yellow arrows) before selling at take profit, but it could have bought twice more.
█ Take Profit Feature
Customisable in the input tab, this feature allows you to set one or multiple take profit(s). You can set the value in either %, pips, or Auto mode.
To create multiple targets, increase the Number of take profit and set the Step between each TP.
In our previous example, instead of just one, I set 3 TPs with 1% value and a step of 1. The strategy will sell progressively at a quantity split even at each take profit, until the last TP is hit.
Note: Using multiple take profit is often used to improve risk management in trading.
█ Built-in Entry Options
The strategy comes with several built-in indicators, such as the RSI that we’ve seen, but here’s the list:
MTF RSI cross, RSI divergences
MTF Stochastic cross
MTF Bollinger Bands cross
Top & Bottoms
Double Top & bottoms
Higher/Lower Lows/Highs
Custom External Entries
If you want to use ANY external indicator from the TradingView library and use it as an entry signal, you can!
For example, let’s use the Squeeze Momentum Indicator by Lazybear. After adding it to the chart, we select the first plot which is the histogram. Then we select the condition “crossover” and “0”. It will create a buy when the histogram turns green.
█ Trend Filters
In trading, we try to avoid going against the global trend.
The strategy comes with several built-in trendlines, MTF, or you can use ANY external trendline from the TV library.
The strategy offers other built-in filters such as volume, overbought in range/trending market, or flat market entry filters.
█ Stop Loss
The stop loss can be turned on/off. You can set the value in either %, pips, ATR or Auto mode.
Note: When to use a Stop Loss? Using a stop kind of defeats the purpose of the strategy, but it can be useful if you plan to trade highly volatile and risky coins (remember LUNA ?) That is why the option is there.
█ How to use the strategy
The indicator access is unlocked by subscribing on my website. See the links below this article.
█ Setting up a strategy
You can set up a strategy on your own chart in just one click using the preconfigured charts I will share below, or you can simply add the indicator yourself and play with the settings.
Backtesting
Backtesting is automatically done in the Strategy Tester Tab.
Creating Alerts
Once you have your strategy setup on the chart:
1 - Set the alert message in the indicator inputs (scroll to the bottom, you will find an “alert’ section)
2 - Save your chart and do not touch it anymore unless you want to update your alert (optional but recommended)
3 - Create an alert on Cyatophilum Accumulation Strategy, using the option “alert() function calls only” (this is really important!)
Only one alert is needed to handle all the strategy events! (entry, take profit, stop loss, etc.) Even a free TradingView user can create a strategy!
Automation
The subscription that I offer also comes with Automation bots using the Binance spot trading API .
Important: if you wish to automate your strategies, make sure your TradingView account has access to alert webhook notifications .
That’s it for this tutorial!
Pretty easy right? No, I know it can get complicated at first. 😣
That is why I make preconfigured charts. Once you have access, click on the chart link, then click “copy”, then “save” your “layout” to get your own chart that you can use and edit. Enjoy!
█ Preconfigured charts
BTC/USDT
Chart: www.tradingview.com
ETH/USDT
Chart: www.tradingview.com
BNB/USDT
Chart: www.tradingview.com
MATIC/USDT
Chart: www.tradingview.com
EGLD/USDT
Chart: www.tradingview.com

Trading Tips - 5 Simple tricks1) Look for trend - Trend is Friend
2) Enter small size position - Start small
3) Ride the trend - Up or Down
4) Set your exit plan - Take profits or Cut loss
5) Higher highs & Lower lows - Can be your exit strategy

HOW TO $1k to $12.4mil in 83 trades on BTCUSD1D BITFINEX w/ NSV4Through an analysis of 83 trades, NSV4 ('Ninja Signals V4' by BitcoinNinjas.org) has demonstrated its ability to turn a modest $1,000 investment into an impressive $12.4 million, showcasing remarkable potential.
In this particular configuration, NSV4 massively outperformed almost any other strategy including the traditional 'buy and hold' in the backtesting of this example.
This chart specifically provides insights and a deeper understanding of the effectiveness and potential of this indicator. It is one of the single best charts ever backtested for Ninja Signals. We have spent years receiving feedback from users and cultivating our script while backtesting different charts and timeframes to achieve this level of success.
The reliability and continual profit over time for 10+ years is astounding in this particular case!
This configuration is unique to this exchange, although is likely to achieve similar results on other exchanges (trading the same pair and the same time interval), perhaps needing only a few minor tweaks.
Let us dissect NSV4's performance and discover the principles that have made it a game-changer. How is it possible to turn 1k into 12.4m in 83 trades?
First of all, you can see that the first trade was in 2013, so these settings are backtested for over 10 years. This didn't happen over night.
Also, this configuration adds the profit of the previous trade to the next trade. On a bot, this would equate to using the entire balance of the account with each trade, and continually increasing the trade amount as profit accrues. Here, we are 'compounding the interest' and using 100% of the trade balance for each trade. This is referred to as "Compounding".
We always make sure that a configuration is highly profitable with compounding OFF before we turn it on. In this case, the results are magical.
When we are backtesting for the best configurations, there are a few things to keep in mind,
these principles are true for any Alerts generating indicator:
1) Has it traded recently, within the last few months? (Yes)
2) Has it been profitable each year if only traded for that year? (Yes)
3) Has it broke even or performed well in a bear market? (Yes)
As you can see, this configuration has traded recently,
It also meets all of the other criteria. Therefore, this would suffice as a tradeable config in our eyes.
In short, why is this pack so successful?
1) Compounding.
2) Long trading history (10yr+).
3) Low SL (Stop Loss) of 6 prevents losing large amounts and keeps trades tight.
4) The results without compounding are stellar to begin with, good start, good finish.
5) Years of backtesting experience from our team culminates in epic configurations.
The 1D chart equates to a longer period of time between trades than most people are used to, which results in approx 1 trade per 1-2 months.
Most people are looking for quick scalping trades but as you can see here, NSV4 has steadily outperformed almost any strategy using complex combinations of basic trading principles and trading for a long period of time.
The tortoise wins the race, in this case.
We generally like to use NSV4 between 60m and 1D, anywhere in between. Sometime obscure timeframes such as 177m or 431min seem to do well. It takes time backtesting to find the best results, as with any script.
Do you know of any other Alerts generating indicators on TradingView that have achieved this level of success? I haven't found any yet! I am anxious to try these settings and to keep testing!
-spiftheninja
PROFIT WHILE YOU SLEEP

ICT Unicorn Model - The powerful ModelThe Unicorn entry model in the ICT method combines the concepts of the Breaker Block and the Fair Value Gap, providing a unique approach to identifying trade opportunities. This combination highlights a future area of support/resistance.
A Bullish Unicorn Pattern consists out of:
A Lower Low (LL), followed by a Higher High (HH)
A Fair Value Gap (FVG), overlapping the established Breaker Block
A successful re-test of the FVG which confirms the pattern.
A Bearish Unicorn Pattern consists of:
A Higher High (HH), followed by a Lower Low (LL)
A Fair Value Gap (FVG), overlapping the established Breaker Block
A successful re-test of the FVG which confirms the pattern
In this trading idea, I would combine the movement of DXY and GU/EU to explain the correlation and divergence (ICT SMT). Futhermore, I want to share how powerful the ICT Unicorn Entry Model is.

Simple Xtrade Trading Strategy for Gold with Risk ManagementThe Simple Xtrade Trading Strategy for Gold, meticulously crafted with a focus on precision and fortified by proper risk management practices. This strategy is tailored to navigate the complexities of the gold market with ease, offering traders a clear pathway to success.
With an emphasis on simplicity, this strategy cuts through the noise of the trading landscape, providing a straightforward approach that ensures clarity of execution. By distilling the essential elements of trading gold into a concise framework, it empowers traders to make informed decisions with confidence.
Central to the Simple Xtrade Trading Strategy is its unwavering commitment to risk management. Every aspect of the strategy is designed to safeguard capital and minimize exposure to potential losses. Through diligent risk assessment and strategic position sizing, traders can navigate the volatile nature of the gold market with poise and resilience.
This strategy serves as a beacon of reliability in the tumultuous seas of trading, offering traders a dependable framework upon which to build their success. With its focus on simplicity, precision, and risk management, the Simple Xtrade Trading Strategy for Gold stands as a testament to the power of disciplined trading in achieving consistent profitability.

Simple Xtrade Buy/Sell Entry ConditionSell Entry Condition:
🔰 If the SELL (red arrow) signal is confirmed on the 30-minute timeframe and aligns with the resistance level, wait for the SELL (red arrow) signal on the 1-minute timeframe before executing your entry. Take profit (TP) is set at 50-100 pips, stop loss (SL) is set at 50 pips, and set break even (BE) at 30 pips.
Buy Entry Condition:
🔰 If the BUY (green arrow) signal is confirmed on the 30-minute timeframe, and the signal aligns with the support level, wait for the BUY (green arrow) signal on the 1-minute timeframe before executing your entry. Take profit (TP) is set at 50-100 pips, stop loss (SL) is set at 50 pips, and set break even (BE) at 30 pips.
1-2 Trades Daily

Simple Xtrade Invalid/Valid Entry Points (GOLD)Invalid Entry Points (Gold):
Random Price Spikes: Avoid entering trades based on sudden and random price spikes, especially without any significant fundamental or technical reasoning behind them. These spikes could be caused by temporary market noise and may lead to false signals.
Ignoring Trend Direction: Entering trades against the prevailing trend without proper confirmation can lead to losses. Always consider the overall trend in Gold prices and look for entry points that align with the trend direction to increase the probability of success.
Lack of Confirmation: Avoid entering trades solely based on a single indicator or signal. Without confirmation from multiple sources, the validity of the entry point is questionable. It's essential to wait for confirmation from various indicators or price action before making trading decisions.
Emotional Trading: Trading based on emotions such as fear of missing out (FOMO) or greed can lead to impulsive decisions and invalid entry points. It's crucial to stick to a well-defined trading plan and avoid letting emotions dictate your trading strategy.

Simple management is easier on your mindhi, just wanted to share a couple of thought on management, mainly for new members.
in my eyes, there are two categories of management: simple (fixed RR) and more complex (variations of trailing).
Both have positive and negative sides.
In my eyes, as a very very subjective opinion, simple fixed RR system will be better for most people. Or ok, I'll not speak for most, but for me definitely.
Why so:
incredible simplicity, cause you just need to test to see how much your trades usually run + create b.e. rule, and you're good to go
3-5RR are usually best for fixed RR systems
do not underrestimate the energy that goes into making decisions while managing and waiting, watching for the trade to develop into higher RR's. With fixed you don't have this - you just go b.e. and then you can close the terminal, and go away if needed. However yes, advanced experienced consistent traders would trail almost with no extra emotions, cause it's usually more mechanical. With that said, for many relatevely new traders, trailing could be extra emotional.
with fixed, you'll have less chances to become emotional, because of many reasons, for me personally fixed RR system gives a sense of accomplishment on every trade, while with managing I'm constantly thinking how can I manage longer better etc. So I'm rarely satisfied when I'm getting stopped out on trail, cause I'm still "stopped out", while on fixed I have a sense of good work done. I know it's weird, but it's personal experience
I could continue, but I guess the general guideline is there.
My main message is that TP can be a very simple fixed 3 or 4RR and that would be more than enough and easier for most people's mind
have a good weekend.
