All-In-One Magnificent 7 — Market Strength Engine NQThe All-In-One Magnificent 7 indicator converts the combined percentage performance of AAPL, MSFT, AMZN, NVDA, TSLA, META, and GOOGL into a single market-strength signal.
It displays the composite trend, moving-average direction, acceleration icons, significant change markers, and bullish/bearish bias zones — giving a real-time read on mega-cap leadership.
This tool helps confirm directional bias for ES/MES, NQ/MNQ, SPX/QQQ, and intraday trades by showing whether the Magnificent 7 are strengthening, weakening, or accelerating.
Ideal for futures traders, options traders, and anyone using market breadth for confirmation.
This is for educational purposes only. Not financial advice.
Contains IO script

Profitable And Repeatable Forex Strategy For 2026A complete, no-hype breakdown of a realistic strategy that can be applied to any FX pair. I show the trend, pivot zones, entry confirmations, and risk management so you can trade with clarity and confidence.

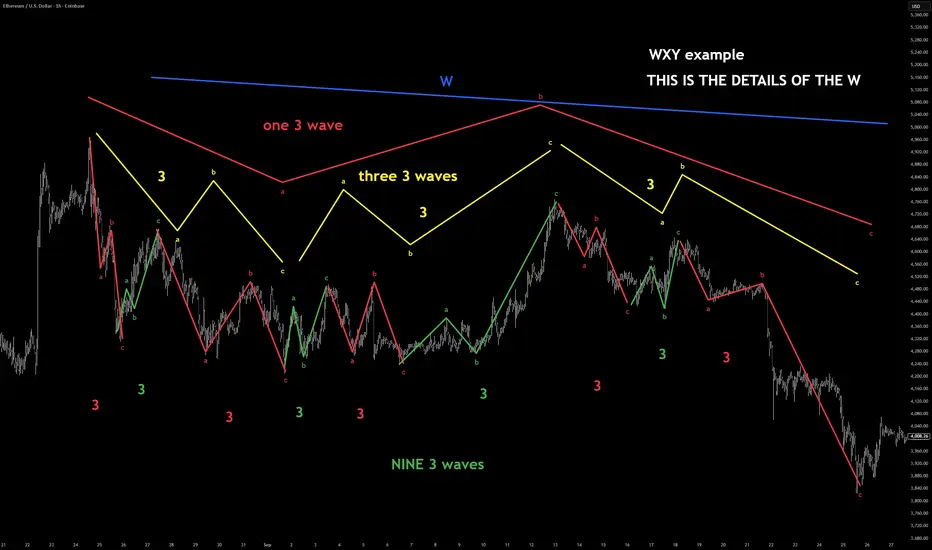
ETH was this correction a WXY- elliot wave tutorial nine 3 waveIts possible this is wave 4 and crypto is going to make a new ATH. theres no way for me to actually know this until after the fact. but it does look like this to me.
wave W is the main chart. to see the other legs see the notes
*** Elliott Wave: Quick Guide to W-X-Y (Double Three) Corrections
A W-X-Y is a complex corrective pattern in Elliott Wave Theory.
If your chart keeps printing choppy overlapping waves that refuse to trend/count cleanly, you’re probably looking at one of these.
- What W-X-Y Actually Is
A W-X-Y is simply:
W = 3 waves
X = 3 waves
Y = 3 waves
So the entire structure is:
*** 3 – 3 – 3 (total of nine internal waves which is 27 on a lower degree)
W and Y are corrective patterns (they can be zigzags or flats), and the X wave is a connecting correction—usually shallow, sideways, and time-wasting.
- What Each Leg Can Be
W:ABC or any corrective 3-wave structure
X: ABC pullback, often sideways
Y: ABC or another corrective structure
None of the legs are impulsive.
If you see a clean 1-2-3-4-5 impulse, it cannot be W, X, or Y.
- How to Recognize a W-X-Y
Corrections subdivide into threes, not fives
Price action is sloppy, overlapping, and often sideways
X wave is typically small relative to W or Y
Y often mirrors W in slope, depth, or duration
The whole thing looks like “two corrections glued together with an X in the middle”
- Where W-X-Y Appears
You’ll see W-X-Y commonly in:
B waves
Wave 4 corrections
The middle section of complex pullbacks
Crypto consolidations (extremely common)
Understanding ELLIOT WAVES ---a technical B waveJust wanted to share this part of the chart because it was pretty hard to see live — it formed on a very low timeframe. I’m posting it on the 15-minute since TradingView won’t let me publish anything lower, but I’ll drop it down and link the lower timeframes below so you can see more of the detail.
This is today’s Ethereum move. I was waiting for the bullish breakout and got in right at the low because I spotted the B wave setup forming. The B wave is the cipher — it tells you where you are within the Elliott structure if you know how to read it.
In this case, the B wave formed a big expanding triangle. You could also map it as an internal ABC inside the B itself. It was a very technical structure, so I wanted to post it to show how a complex B wave can look in real time. Recognizing these patterns helps a lot when you’re tracking the transition from correction to impulse.
FOLLOW AND COMMENT FOR MORE ELLIOT WAVE EXAMPLES AND LESSONS

YOUR JOB IS TO FIND CONFLUENCE - Here is how I do it.....All the information you need to find a high probability trade are in front of you on the charts so build your trading decisions on 'the facts' of the chart NOT what you think or what you want to happen or even what you heard will happen. If you have enough facts telling you to trade in a certain direction and therefore enough confluence to take a trade, then this is how you will gain consistency in you trading and build confidence. Check out my trade idea!!
www.tradingview.com

HOW-TO: Trade-o-Scope Plot Custom Data v2This is a short HOW-TO on using the Trade-o-Scope "Plot Custom Data v2" indicator

Multiple Correlated Currencies = Confluence to take the trade All the information you need to find a high probability trade are in front of you on the charts so build your trading decisions on 'the facts' of the chart NOT what you think or what you want to happen or even what you heard will happen. If you have enough facts telling you to trade in a certain direction and therefore enough confluence to take a trade, then this is how you will gain consistency in you trading and build confidence. Check out my trade idea!!
www.tradingview.com

The Impact of News on Price: Should You React?"
In trading, news has always been a powerful factor capable of moving markets by double digits within hours. A single headline in the financial media or a tweet from a politician can send an asset soaring or crashing, wiping out stop-losses and creating waves of panic. Many traders have faced moments when a sudden “breaking story” ruined carefully built plans: technical analysis showed a steady trend, but a flood of headlines turned the market in the opposite direction. Naturally, the question arises: should we react to news immediately, or is it better to stay calm?
Most traders make their biggest mistakes during such moments. The temptation appears to jump straight into a position or close one in fear. Emotions take over: fear of missing out and greed for quick profits. The problem is, these decisions rarely come from a system. More often, they turn trading into gambling, where outcomes depend on luck instead of analysis.
The truth is, news itself doesn’t always have a straightforward impact on the market. What matters more is how participants react. The same piece of information can trigger a rally or a sell-off depending on how major players interpret it. Blindly following the headlines rarely leads to consistent results.
A more effective approach is to treat news as background, not as a direct call to action. At the core of successful trading lies discipline and an understanding of levels, not headlines. If the price is approaching a pre-marked zone, that zone—not a comment on a news feed—defines the scenario. This way, the trader avoids guessing crowd reactions and focuses on what is objectively visible on the chart.
Consider two scenarios. In the first, a trader sees news that a large fund has purchased crypto and instantly opens a long. In the second, the same trader reads the same news but acts only after confirming the move technically, at pre-defined levels. The difference is striking: the first approach is emotional, the second is structured. And it’s the latter that reduces chaotic mistakes.
To trade this way, it’s not enough to simply recognize levels—you need a system to control them. That’s where structured analysis comes in: viewing price step by step, turning trading into a managed process. With this approach, profit targets, risk zones, and scenarios are mapped out in advance. Strong news flow becomes a side factor, not the core driver of decisions.
Experienced traders know that news will always shake markets. Instead of chasing every headline, it’s more effective to build trades that can withstand volatility. What helps here is having a process that removes emotions and focuses on numbers. Automation of analysis and clear visualization of key levels transform trading from chaotic reactions into a disciplined plan.
So, should you react to news? The answer is: yes, but not directly. React through your system. If the news aligns with the technical picture, it can add conviction. If it contradicts it, the priority remains with structure, not emotion. This is what allows you to operate calmly, without panic or euphoria.
Markets will never stop being unpredictable, and news is just one facet of that uncertainty. But discipline, technical analysis, and structured control can turn even the noisiest events into a manageable process. In the end, it’s not the headlines that matter most, but your ability to stay focused and consistent. And this is exactly where tools that automate the process, reduce chaos, and keep logic at the center become indispensable."
What Does a Range-Bound Market MeanThe market isn’t always driven by dynamic, trending moves. There are periods when price seems to “freeze” between levels, moving up and down but without a clear direction. This condition is called a range-bound market, or flat (sideways movement). Such phases often become a real test for traders because trend-following strategies stop working, and chaotic trades frequently lead to losses.
What Is a Range-Bound Market
A range-bound market is a section of the chart where price oscillates within a narrow channel, repeatedly testing support and resistance levels without a decisive breakout. In such phases, the market is essentially “resting” after a strong move, consolidating energy and preparing for the next impulse.
From a market psychology perspective, flat conditions represent a balance between buyers and sellers. Some participants wait for a favorable entry point, while others lock in profits or reduce exposure. As a result, price fluctuates within a corridor until an imbalance of forces triggers a breakout.
Why Flat Conditions Are Risky
At first glance, sideways movement may seem safe: price isn’t crashing or soaring dramatically. But this is exactly where the danger lies for traders.
- False breakouts: Price often moves beyond the range briefly, creating the illusion of a new trend, only to snap back. Traders who rushed in usually end up with losses.
- Increased transaction costs: Frequent entries and exits within a range lead to numerous small trades, and commissions eat into potential profits.
- Emotional burnout: A prolonged sideways market makes it hard to stay focused. Mistakes stem from fatigue and the urge to “make something happen.”
That’s why many traders consider a range-bound market the worst state: it offers little directional movement but creates plenty of opportunities to overtrade and lose.
How to Trade During Flat Conditions
The most common mistake is trying to trade a flat market the same way as a trending one. Instead, a different playbook applies here.
- Define the range boundaries: Support and resistance levels become critical. Mark them clearly and pay attention to repeated touches.
- Trade from the edges: It’s usually better to enter near support (buy) or resistance (sell) rather than in the middle of the range.
- Take profits quickly: Don’t expect large moves. Targets in range trading are much smaller than in trending conditions.
- Reduce trade frequency: Avoid reacting to every small price swing. Wait for confirmations at levels and act selectively.
- Watch the volume: Breakouts are often accompanied by a volume spike. That can be the first signal of a directional move ahead.
When to Expect a Breakout
Every range eventually ends. The question is when and in which direction. To avoid guessing, look for signs of preparation:
- Price starts compressing within the range, forming a triangle pattern.
- Trading volume decreases, followed by a sudden surge.
- Support or resistance levels get tested more frequently.
A breakout confirmed by price consolidation above resistance or below support usually marks the start of a new trend. These moments often create the best entry opportunities.
Why a Systematic Approach Matters Most
Most traders lose money in sideways markets not because they lack knowledge, but because they give in to emotions. The urge to chase every move, fear of missing “the breakout,” or frustration from inactivity turn trading into random gambling. A systematic approach changes the picture. When a trader has a clear algorithm—how to spot ranges, which levels to mark, where to take profits, and when to wait for a breakout—the market becomes structured, not chaotic. Discipline is even more important in flat conditions than in trends, because this is where the foundation for the next strong move is laid.
The Practical Value of Automation
Flat phases are where automation tools are especially helpful. Algorithms that highlight levels, suggest take-profit zones, and manage risk allow traders to avoid guesswork and emotional mistakes.
- For beginners, this serves as a navigation tool: they learn to recognize market structure and understand when to act and when to stay out.
- For experienced traders, automation supports discipline, speeds up analysis, and reduces emotional bias.
Conclusion
A range-bound market isn’t the enemy of traders—it’s a natural state of the market. It may be exhausting with its unpredictability and tempting false moves, but these periods build the energy for future trends.
Traders who can identify flat conditions and follow a structured system not only protect their capital but also position themselves for strong moves that always follow consolidation.
The market will always test traders’ nerves. But with discipline, technical analysis, and automation, even the chaos of a sideways phase becomes a controlled process. And that’s what separates random luck from consistent results.

What Is a Trend and How Not to Confuse It With a Correction"One of the first words every trader hears when entering the market is “trend.” It seems simple: a trend is the direction of price movement. But in practice, this is where most mistakes and debates arise. Where is the actual trend, and where is just a correction? What is a reversal, and what is only a pause? Misunderstanding these questions costs money — sometimes an entire account.
Why Is It So Hard to See the Trend?
The challenge lies in the fact that markets always move in waves. Even during a strong uptrend, price will pause, pull back, and create local highs and lows. For a trader, especially a beginner, it’s easy to mistake a correction for a reversal. This often leads to closing trades too early, or holding them too long when it no longer makes sense. Imagine Bitcoin rises from $100,000 to $118,000. Suddenly, price drops to $114,000. Is this the start of a downtrend, or just a pullback before the next push higher? The answer doesn’t lie in emotions but in reading the structure of the trend.
How to Distinguish Trend From Correction
A trend is a sequence of moves where each new impulse confirms the previous one.
- In an uptrend, each new high is higher than the last, and each low also moves higher.
- In a downtrend, each new low drops below the last, and highs remain capped.
A correction, however, is a temporary pullback against the main direction. It doesn’t break the structure. If price in an uptrend pulls back but holds above key support, it’s a correction, not a reversal. Levels and volumes often provide the confirmation. When price tests and holds strong support, the trend stays intact. But if it breaks and consolidates beyond that level, it’s a signal that the market may be reversing.
The Role of Psychology in Mistakes
Most of the time, the problem isn’t theory — it’s psychology. Traders see “collapse” where there is only a normal correction. Or they hope for continuation when the structure is already broken. Greed stops them from taking profit when they should, while fear forces them to close trades at every pullback. Trading then becomes a set of random emotional decisions instead of a structured plan.
What Really Helps
1. Technical analysis. Trendlines, support/resistance, and patterns provide a framework.
2. Multi-timeframe analysis. On lower charts, a correction may look like a full reversal. On higher timeframes, it’s just a pause. You need both perspectives.
3. Algorithmic approach. Automation removes unnecessary emotions. When a system highlights zones, profit levels, and trend shifts, traders can stick to their plan.
4. Staged profit-taking. Even if the market reverses unexpectedly, part of the profit is already secured.
Why This Matters to Every Trader
For beginners, trends and corrections often look identical. Visualization and structure act as a navigator, showing what’s just a pullback and what requires caution — saving years of trial and error.
For intermediate traders, the value is in acceleration. They already know how to read charts but often hesitate in execution. A structured system reduces emotional mistakes and provides clear reference points.
For professionals, the priority is time and discipline. They don’t need definitions of trends — they need a tool that filters out noise, keeps trades consistent, and maximizes holding potential.
For investors, understanding trend vs. correction provides clarity on where to accumulate and where to reduce exposure. It’s not a guessing game but a framework for managing capital.
Final Note
Trend and correction aren’t just textbook terms — they are the foundation of trading. Those who can tell them apart manage trades, instead of being managed by market chaos.
The market will always try to knock you off balance emotionally. But a systematic approach based on technical analysis highlights structure, pinpoints key levels, and removes guesswork. That’s what transforms trading from a lottery into a structured process, where emotions fade and decisions come from cold logic."
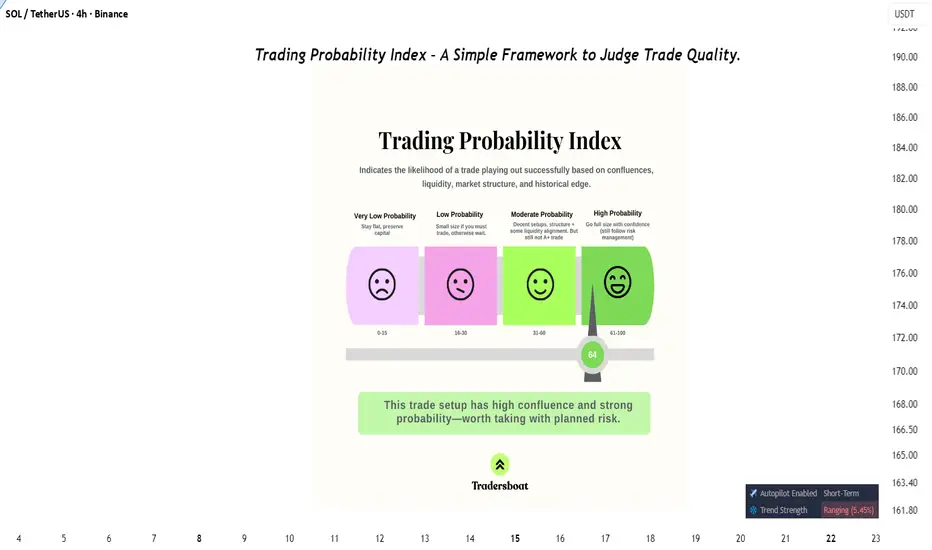
Trading Probability Index – A Simple Framework to Judge Trade Qu📖 Description:
Most traders enter positions without measuring probability. This framework solves that.
The Trading Probability Index (TPI) combines:
✔️ Confluences (indicators & structure)
✔️ Liquidity zones
✔️ Market structure shifts
✔️ Historical edge
It categorizes setups from Very Low → High Probability so traders know when to stay flat, go small, or go big with conviction.
📊 In this example, the trade scored 64 → High Probability Zone, meaning the setup has strong confluence and is worth taking—with proper risk management.
This tool helps traders filter noise, focus on quality setups, and avoid overtrading.
👉 Do you have your own system to measure trade quality? Or do you go by gut feeling?
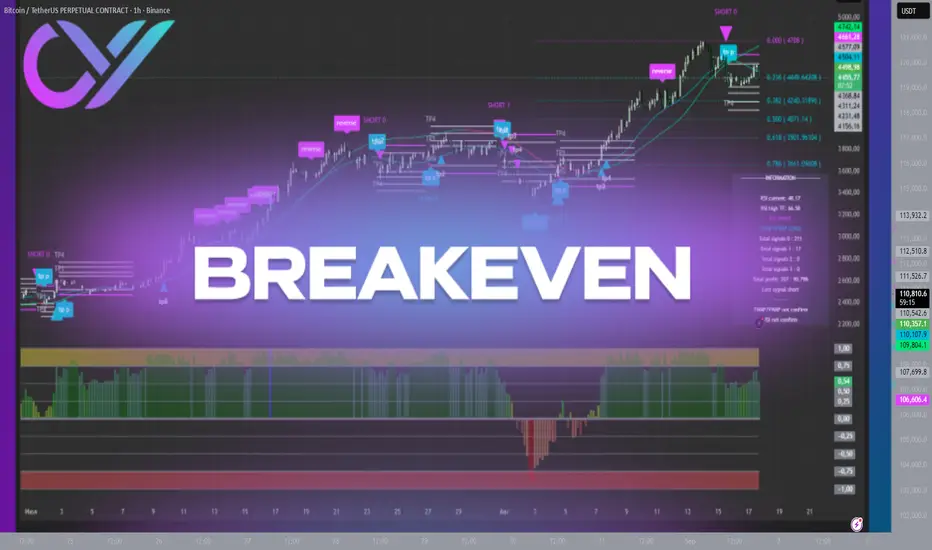
What is Breakeven"In trading, every step is about risk management. Any position can end in profit or loss, and the trader’s task is to minimize the latter. One of the most debated techniques in this field is moving the stop-loss to breakeven. For beginners, it raises many questions: when should it be done? is it always correct? does it limit profits?
What is Breakeven
Breakeven is the level at which a trade closes without profit and without loss. The trader locks in zero result, preserving capital and avoiding risk if the market suddenly turns against them. Technically, this means the stop-loss is moved to the entry price after the position moves a certain distance in the trader’s favor.
The essence of the technique is to remove the worst-case scenario — taking a loss when the plan fails.
Why Move the Stop to Zero
The main benefit is psychological. While the stop is in the red, a trader feels tension: every fluctuation could knock them out and cut their capital. Moving to breakeven removes that pressure. The trade becomes “free”: it’s either profit, or nothing. This creates calmness and focus for further decisions.
Another aspect is discipline. Breakeven builds the habit of protecting capital. Many traders lose money not because their ideas are bad, but because they lack rules for managing trades. Breakeven enforces discipline and reminds: the priority is not giving more to the market than you planned.
When to Move the Stop to Zero
This is where most beginners go wrong. Moving to breakeven too early means not allowing the trade natural space to breathe. The market almost never moves in a straight line — it pulls back. If the stop is too tight, the position gets closed at zero, and then price continues in the expected direction.
Experienced traders only move stops after price crosses a meaningful level that truly confirms trend strength. This could be:
- a breakout of a significant support or resistance;
- consolidation above a local range;
- reaching the first target level (TP1).
That way, breakeven is not a random act for calming nerves, but part of systematic trade management.
Why Breakeven is Not Always the Best Choice
While useful, the technique has a downside. Moving stops too frequently or too early often leaves traders with “nothing trades” — positions closed at zero while the market later moves in their favor. This slows capital growth.Professionals use breakeven selectively, and always as part of a broader risk and position management strategy. Sometimes it’s more profitable to leave a stop in the red but beyond the level that truly invalidates the scenario. That gives the market room to develop while keeping risk under control.
How to Integrate Breakeven Into a System
Breakeven is not a universal rule, but a tool. To use it effectively, a trader should:
- predefine conditions for moving the stop (e.g., only after TP1 is reached);
- avoid emotional rushes;
- consider market structure and trend strength;
- combine the technique with technical analysis: levels, volumes, candlestick patterns.
With a system in place, breakeven becomes part of the bigger picture rather than a random “just in case” action.
Automation and Cold Logic
The hardest part is that the decision to move a stop is often made under emotional pressure. A trader sees a small retracement and quickly protects themselves. But emotions are exactly what rob good trades of their potential. The solution comes with algorithms. Tools that highlight key levels, guide trade management, and allow partial profit-taking remove emotional bias. A machine doesn’t panic, doesn’t get greedy, and doesn’t hesitate. It follows conditions with statistical precision. In this framework, breakeven is no longer an emotional gesture but a logical step: price broke a level, consolidated, scenario confirmed — the stop is moved.
Conclusion
Breakeven is a powerful risk management tool, but only when used as part of a system. It protects capital, reduces psychological pressure, and builds discipline. But moving stops too early or chaotically can block profits and turn strategy into randomness. In trading, winners are not those who know the most, but those who can keep a clear head and trust the plan. When rules are predefined and tools help visualize the market and control key levels, every decision becomes deliberate. That’s what separates a professional from a gambler."
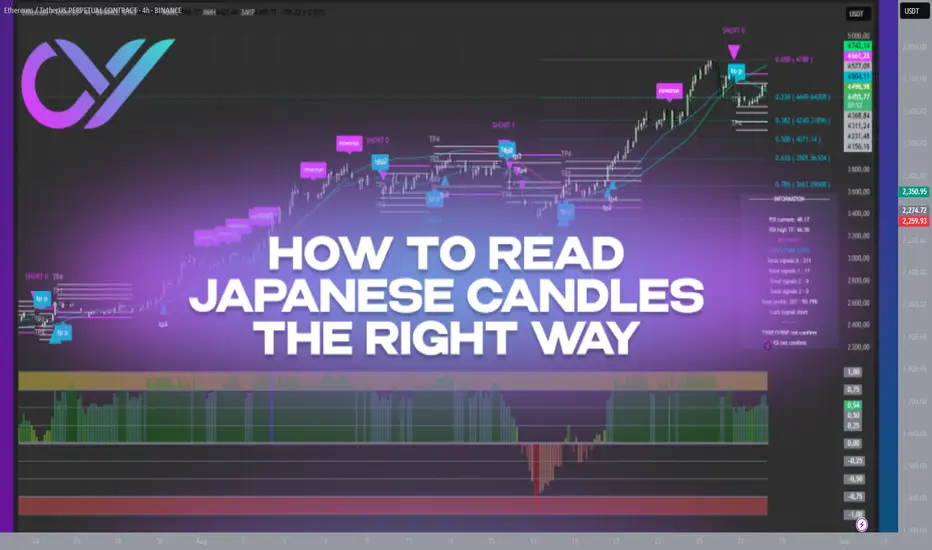
How to Read Japanese Candles ProperlyWhen traders first look at a chart, they often see what looks like a chaotic mix of red and green bars with shadows. These are Japanese candlesticks — the main language of financial markets. But for many, they remain a mystery: what does a long wick mean? Why does one candle look strong while another looks weak? How can you find structure in this chaos?
In reality, candles are not just colored shapes. Each one represents a small battle between buyers and sellers. The body shows where price opened and closed, while the wicks mark the extremes of that session. A green candle reflects bullish control, a red one shows bearish dominance.
The details matter most. A long upper wick signals that buyers tried to push higher but sellers pushed back. A long lower wick means the opposite — heavy selling pressure was absorbed, and buyers regained control. A doji with small body and long wicks highlights indecision and often warns of a possible shift.
Single candles rarely tell the whole story; combinations and context are far more valuable. A “hammer” at support after a downtrend hints at reversal. A “bullish engulfing” pattern after a series of red candles shows momentum shifting to buyers. On the flip side, a “hanging man” near resistance often warns of correction.
Timeframe also changes the narrative. A candle on the 1-minute chart tells a completely different story than a candle on the daily chart. Aligning short-term candles with higher timeframes helps distinguish noise from meaningful moves.
Experienced traders never rely on candles alone — they integrate them into a system. Candles are confirmed with support and resistance, volume dynamics, divergences, and overall trend structure. Only then does a clear picture of the market emerge.
The key, however, is eliminating emotions. Traders who focus only on candles often act chaotically — exiting too early, holding losing trades too long, or entering impulsively. But when combined with algorithmic analysis and structured trade management, candles become a clear language: they show where the market weakens, where momentum builds, and where it makes sense to take profits.
Japanese candlesticks mirror crowd psychology. Yet only a systematic approach allows traders to truly read their signals. When the market looks chaotic, structure and automation bring control back to the trader, turning emotions into cold calculation.
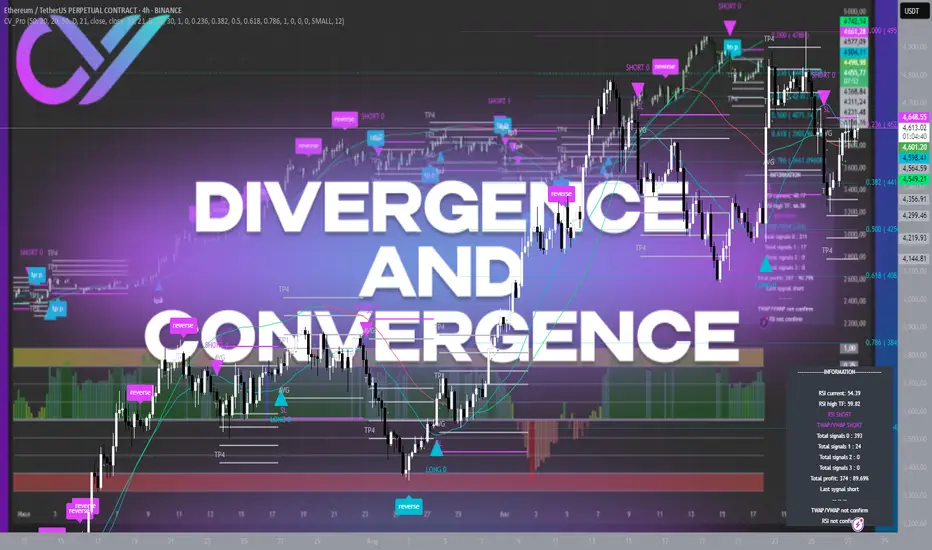
Divergence and Convergence: How to Read Market SignalsThe cryptocurrency market, like any financial market, is full of paradoxes. Price can rise, yet the strength of the trend is already weakening. Indicators may show that the move is “running on fumes,” but most traders keep buying at the top or selling at the bottom. The result is always the same: emotional trading and chaos instead of system and consistency.
The main problem is that most participants only look at price. But price is just the tip of the iceberg. Beneath it lie volumes, momentum, trader sentiment, and recurring statistical patterns. This is where divergence and convergence come into play — signals that often warn of a trend change long before it becomes obvious.
What are Divergence and Convergence
Divergence occurs when the price makes new highs or lows, but a momentum indicator (such as RSI or MACD) shows the opposite — weakening strength. It’s a signal that the trend is losing energy and the probability of reversal is rising.
Convergence is the opposite. The price updates a low, but the indicator shows higher readings. This suggests sellers are losing steam and buyers may soon regain control.
On the chart, these may look like small details, but for an attentive trader, they mark turning points — the very beginnings of shifts that later become obvious to everyone else.
Why These Signals Matter
Imagine Bitcoin climbing from $105,000 to $118,000. Everyone is euphoric, and newcomers rush to open longs, hoping for more upside. Meanwhile, RSI is already showing divergence: price is up, momentum is down. For a careful trader, that’s a red flag.
Moments like this help avoid buying at the peak and prepare for an incoming correction. More importantly, divergences not only give exit signals but also highlight potential reversal zones — places where traders can plan new entries in the opposite direction.
How to Read Divergence and Convergence
Compare price highs/lows with the indicator. If price rises but the indicator falls — it’s divergence.
Check the context. A single signal on the indicator means little. Support/resistance levels, volumes, and candlestick structure matter.
Be patient. Divergence can form over several candles, and the market often makes one last push before turning.
Combine tools. Use divergence alongside TP/SL zones and trendlines to improve accuracy.
Common Mistakes
Many beginners make the same error: they see divergence and instantly trade against the trend. That’s wrong. Divergence isn’t a “buy/sell button,” it’s a warning. It says: “Be cautious, momentum is fading.” The actual reversal must still be confirmed by price structure and volumes.
Another mistake is ignoring timeframe. Divergence on a 5-minute chart may only play out for a few dollars, but on a 4H or daily chart, the move could be massive.
Building it Into a System
This is the crucial part. An indicator alone won’t make a trader successful. Divergence and convergence need to be part of a system where:
- entry and exit zones are pre-defined,
- profit targets are clearly marked,
- risk is limited by stop-losses,
- and decisions are made without emotions, based on structure.
This is where algorithms and automation prove invaluable. An automated model spots divergence earlier than the eye, flags conditions for a probable trend shift, and guides the trade step by step.
Why It Works
Markets move in cycles, and history repeats. Divergence and convergence are not magic, but a reflection of market physics: momentum fades, energy runs out, and no trend lasts forever. Ignoring these signals means trading blind.
Integrating them into a structured process means having a map of potential scenarios ahead of time. It doesn’t guarantee perfection, but it eliminates guesswork and replaces it with probabilities and discipline.
Conclusion
Divergence and convergence are market warnings for those who pay attention. They help traders exit on time, avoid entering at peaks, and prepare for reversals. Most importantly, they train discipline and patience — the qualities that separate long-term survivors from those who get washed out.
In a world where emotions break strategies, systematic analysis provides the edge. Automation, technical tools, and the ability to read market structure turn chaos into a structured process. For traders seeking to look deeper than just price, divergence and convergence are signals worth learning to read as carefully as a book.
Emotions vs. StrategyTrading rarely breaks us technically — more often, it breaks us psychologically. Anyone who has ever opened a position knows this feeling: your heart races, your hand wants to close the trade too early, and the thought “What if I was wrong?” keeps gnawing at you. Emotions are a trader’s biggest enemy. And more often than not, they are the true reason for losses, not the market itself.
Imagine this: you open a long, and the price immediately moves against you. Instead of calmly waiting for your pre-set stop-loss, you move it, or worse — remove it altogether. Or the opposite: the trade is profitable, but the fear of losing makes you close far too early. The result? The strategy collapses, trades become chaotic, and the account balance shrinks.
Every trader has had that moment of realization: “I knew what I should have done, I had a plan — but I couldn’t handle the pressure.” That’s the most frustrating part, because knowledge and analysis were there, but discipline failed. And in those moments, you understand that the winners in this game are not the smartest ones — they’re the ones who can stay calm and stick to the system.
What really helps
1. A systematic approach. Trading must be built on an algorithm, not on impulses or guesses. If you have a clear plan — entry, stop-loss, profit targets — the risk of chaotic actions drops dramatically.
2. Writing the rules down. A written plan works better than one you keep “in your head.” Many successful traders keep a trading journal: why they entered, what emotions they felt, where they made mistakes. This builds awareness and helps improve discipline.
3. Automation and tools. Using algorithms that help manage trades takes away most of the emotional burden. Machines don’t hesitate, don’t fear, and don’t regret — they simply act according to conditions.
4. Proper risk management. Emotions flare up when the risk per trade is too large. If a position risks only 1–2% of your account, market swings don’t feel as painful — and that allows you to calmly stick to the plan.
5. Stop-losses and take-profits. These are not only for controlling risk and locking profits — they are tools for peace of mind. A trader who sets them in advance is less likely to act impulsively.
6. Diversification. Putting all of your capital into one trade is the fastest way to emotional burnout. Splitting positions across assets reduces pressure and makes price movements easier to tolerate.
7. Working on emotions directly. Meditation, sports, walks, proper sleep — they might sound trivial, but psychological resilience is built on these habits. A tired trader is far more likely to make poor decisions.
The market is chaotic only for those who approach it without a system. When you have an algorithm that highlights key zones, identifies trend shifts, and guides trade management step by step, emotions fade into the background. This is what transforms trading from a stressful lottery into a structured process. The core idea is simple: cold calculation instead of emotions, an algorithm instead of chaos, technical analysis instead of guesses. Everything else follows from that choice.

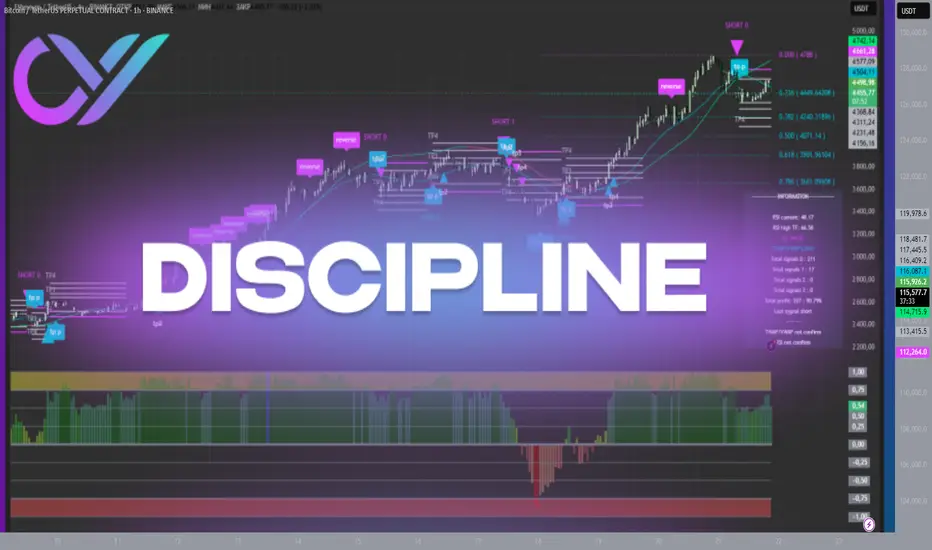
Discipline in Trading: How to Not Break Your Own RulesSuccess in trading rarely depends on a single "magic" indicator or strategy. Over the long term, the deciding factor becomes discipline. It is what separates those who earn consistently from those who lose their deposit in emotional trades.
Why Discipline is More Important Than Knowledge
You can know dozens of patterns, read charts flawlessly, and even possess strong analytical skills, but all of this loses its value if a trader cannot follow their own rules. The problem for most beginners is not a lack of knowledge, but that they violate their own conditions: they move their stop-loss, enter with more leverage than planned, or close a trade early out of fear.
Trading is an environment where emotions work against you. Greed, the fear of missing out (FOMO), and the hope for a "bounce" turn trading into a chaotic process. Discipline, however, allows you to turn chaos into a system.
How Discipline is Formed
The first step is a clear trading plan. Every trade must have pre-defined entry points, stop-loss and take-profit levels, as well as an acceptable risk. When a trader opens a position without these parameters, they are essentially abandoning discipline.
The second step is to adhere to risk management. Even the most precise trade does not guarantee a profit, and a trader must be prepared to accept a loss. When risk is limited in advance, it is easier to maintain discipline: you know that the loss will not destroy your deposit.
The third step is to keep a trading journal. By recording all trades, the trader sees where they break the rules and can work on correcting mistakes. It is a simple but very effective control tool.
Why It's So Easy to Break the Rules
A trader's brain seeks quick results. When a trade is in profit, you want to "take" the profit early. When it's in a loss, you want to hold the position hoping for a reversal. It is at this moment that discipline is tested: will you be able to hold the position according to the plan, or will your emotions take over?
This is why experienced traders often say: trading is not a game against the market, but a game against yourself.
Conclusion
Discipline is the foundation of successful trading. It doesn't appear overnight; it must be developed through practice and constant self-control. A clear plan, risk management, and a trading journal are simple tools that help keep emotions in check.
In the market, you cannot control the price. But you can always control yourself. And that is what determines whether trading becomes a source of stable income or an endless series of mistakes.
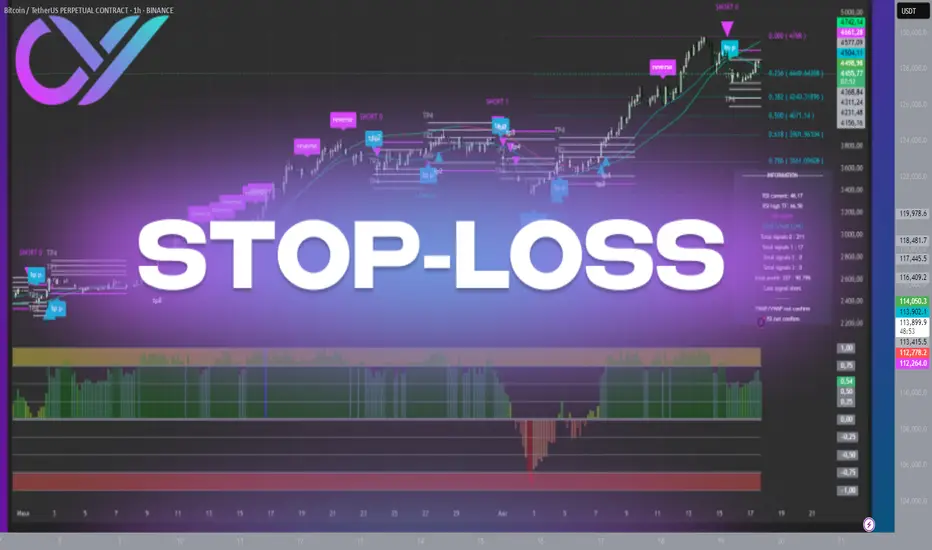
How to Properly Use Stop-Loss in TradingStop-loss is one of the simplest yet most underestimated tools in trading. Many beginners see it only as a “loss limiter” and place it randomly. In reality, stop-loss is a core element of a trading system, defining not only the risk size but also the logic behind the trade itself.
What is a stop-loss?
A stop-loss (SL) is a pre-set price level at which your trade closes automatically to limit losses. If you enter a long position, the SL is placed below your entry point. If you go short, it’s set above.
The main purpose of SL is to ensure you never lose more than planned. That’s why experienced traders say: a stop-loss is not just protection against losses — it’s a capital management tool.
Where to place a stop-loss correctly?
The biggest mistake beginners make is placing stops “by guess.” Professionals always base it on market structure. Here are the key principles:
- Beyond support or resistance. In a long, the stop is placed slightly below support; in a short, slightly above resistance.
- Considering volatility. On calm markets, the stop can be tighter. On volatile moves, it’s safer to widen the distance.
- By indicator signals. If an algorithm highlights a key zone, the SL is best hidden in that range.
So, a stop-loss is not a random number, but a logical point where your trade idea becomes invalid.
How does stop-loss relate to risk management?
Another common mistake is ignoring the risk/reward ratio (RRR). Professionals never take trades where the potential loss equals or exceeds the potential profit.
For example, if you go long on BTC at $114,000, set a stop at $112,000 (risk: $2,000), and a target at $118,000 (profit: $4,000), your RRR is 1:2 — a good setup. But if your target is only $115,000 (profit: $1,000), the trade doesn’t make sense since the risk outweighs the reward.
Why is it essential to always use a stop-loss?
Many beginners think: “I’ll close the trade manually when needed.” But markets are faster and harsher. One sudden move can wipe out a position before you react.
That’s why the golden rule is: it’s better to exit on a stop than to lose your account by holding onto losses.
Conclusion
A stop-loss is not “insurance against mistakes” — it’s a strategic tool. It defines the level where your trade idea stops being valid and enforces discipline by removing the temptation to hold onto losses.
Remember: you can’t control price, but you can control your risk. And it’s the stop-loss that turns trading from chaos into a manageable process.
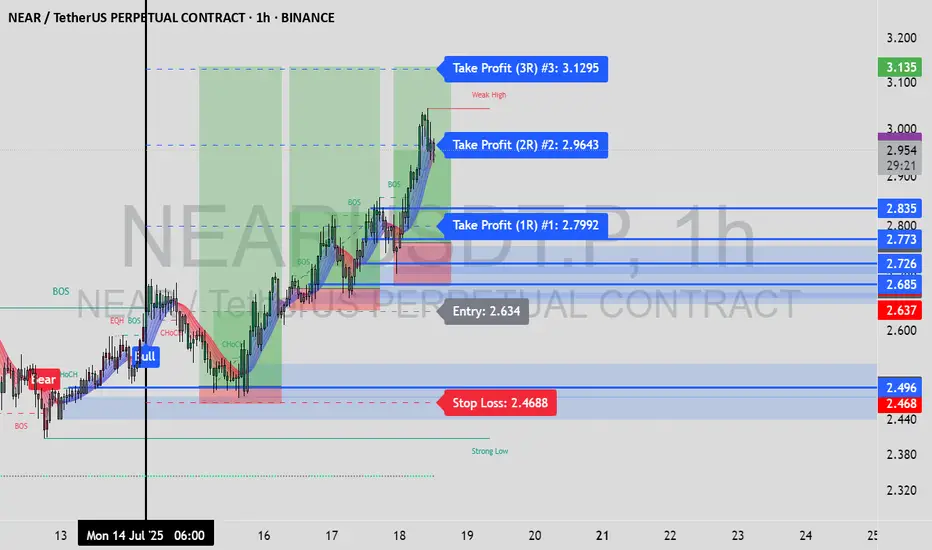
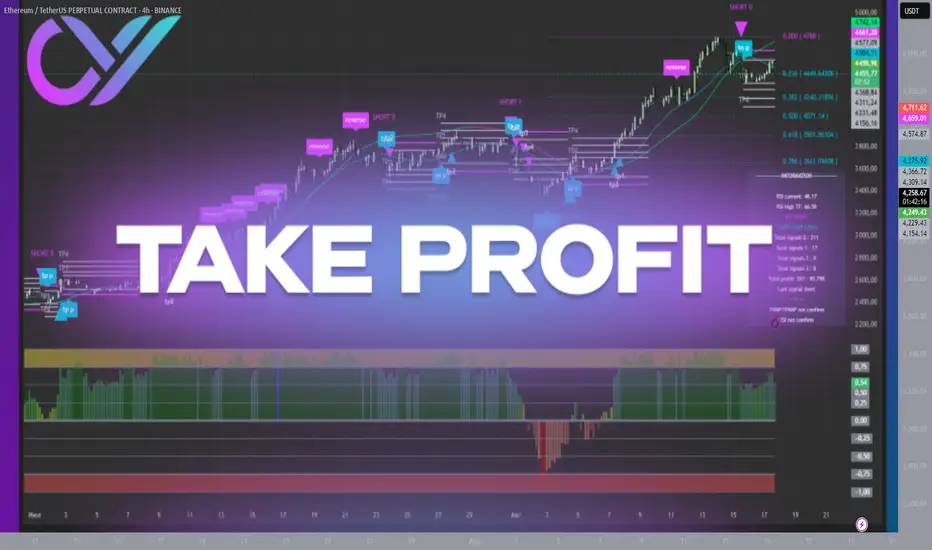
Take Profit in Trading: How Profit Levels WorkIn trading, profit isn’t secured when you “guess” the market direction — it’s secured when you already know where to close your trade. For this purpose, traders use a tool called Take Profit (TP).
What is Take Profit?
Take Profit is a pre-set price level at which your position automatically closes with profit. In essence, it’s the opposite of a stop-loss, which protects against loss. A TP removes the need to constantly monitor charts and ensures you capture profit exactly where you planned.
Example: A trader enters a long position on BTC at $114,000 and sets a TP at $118,000. Once the price touches that level, the trade closes automatically and profit is secured.
Why Do We Need Take Profit Levels?
The key role of TP is discipline. Without clear targets, traders risk closing trades too early or waiting too long until the market reverses. Take Profit levels help to:
lock in profit step by step,
avoid emotional decision-making,
move stop-loss to breakeven after reaching the first target.
Take Profit Levels (TP1, TP2, TP3, TP4)
In professional trading, as well as with CV_Pro, multiple TP levels are often used:
TP1 — the first target. Partial profit is taken, and stop-loss is moved to breakeven.
TP2 — confirms trend strength and allows further profit-taking.
TP3 and TP4 — extended goals for strong trend moves, when the market offers maximum potential.
This approach is called partial profit-taking. Instead of waiting for the “perfect” level, traders secure profits gradually. This reduces risk and increases consistency.
Take Profit and Trade Management
Working with TP is always a balance between greed and discipline. If the market moves in your favor, TP helps you capture more from the trend, and if the market reverses, you already leave with gains. Remember: it’s better to take profits according to plan than to wait and lose the entire move.
Conclusion
Take Profit is the foundation of professional trading. It turns random entries into a structured strategy. By using TP levels, a trader gains not only profit but also confidence that their trading is controlled and systematic.
Stablecoins: Stability in a World of VolatilityIn the cryptocurrency space, everything changes rapidly: trends form within hours, and assets can rise or fall by double-digit percentages in a single day. In such conditions, traders need a tool that allows them to preserve capital and act without haste. That tool is the stablecoin — a digital asset with a fixed price.
They serve as a kind of “safe harbor” in the storms of the crypto market. Even if Bitcoin or Ethereum face a sharp correction, a stablecoin theoretically remains equal to 1 US dollar (or another pegged currency).
What is a Stablecoin
A stablecoin is a token whose value is pegged to a base asset at a 1:1 ratio. Most commonly, this peg is to the US dollar, but there are stablecoins linked to the euro, gold, or even a basket of assets.
The idea is simple: combine the convenience of cryptocurrencies (fast transfers, no borders, transparency) with the predictability of traditional money. This allows traders to quickly move capital between positions or exchanges without losing value to volatility.
Main Types of Stablecoins
1. Fiat-Backed
The issuer holds actual dollar reserves in bank accounts.
The peg is maintained by allowing token holders to redeem them for fiat at any time.
Examples: USDT (Tether), USDC.
Pros: high liquidity, easy to understand.
Cons: reliance on the issuer and a centralized structure.
2. Crypto-Backed
Backed by other cryptocurrencies used as collateral.
Collateral often exceeds the token’s face value to protect against volatility.
Example: DAI by MakerDAO.
Pros: decentralization and blockchain transparency.
Cons: risk of a sudden drop in collateral value, which can trigger liquidations.
3. Algorithmic
The peg to the dollar is maintained via smart contracts that regulate the supply of tokens.
Tokens are minted when the price rises and burned when it falls.
Examples: former UST (Terra) before its 2022 collapse.
Pros: decentralization, no need for real reserves.
Cons: highly vulnerable to market panic.
Why Stablecoins Matter to Traders
Locking in Profits
Closed a profitable ETH long? Instead of cashing out to fiat, you can convert to a stablecoin and preserve purchasing power until your next entry.
Protection from Volatility
When the market looks overheated or uncertain, stablecoins allow you to “go into cash” without leaving the crypto ecosystem.
Liquidity and Transfer Speed
A traditional bank transfer may take days, while moving USDT or USDC takes minutes — crucial for arbitrage or quick reactions to news.
A Tool for Margin Trading
Many futures platforms use stablecoins as the base currency for settlements, simplifying profit and loss calculations.
Risks and Pitfalls
Regulatory Pressure
Centralized issuers can freeze addresses or restrict operations in response to government requests.
Losing the Peg (Depeg)
If confidence in the issuer or system drops, the stablecoin’s price may deviate from $1. Algorithmic stablecoins are particularly vulnerable.
Centralization
Fiat-backed tokens depend on the issuing company, which controls reserves and redemption processes.
💡 Practical Use with CV_Pro
When trading crypto futures with CV_Pro, stablecoins can serve as a “parking spot” between trades. Closed a profitable position? Move funds into USDT, wait for the next signal, then re-enter. This reduces the impact of volatility and gives you time to make thoughtful entries.

Altcoins and Altseason:How to Understand and Use Them in Trading
The cryptocurrency market has long moved beyond Bitcoin’s monopoly. Today, it consists of thousands of digital assets, each with its own technology, goals, and economic model. Among traders, two terms are frequently used — “altcoin” and “altseason,” and understanding them is essential for anyone aiming to earn consistently in crypto.
An altcoin is any cryptocurrency other than Bitcoin. The first alternative coins appeared in 2011, when developers sought to improve BTC by offering faster transactions, new algorithms, or additional features. Today, some of the most well-known altcoins include:
Ethereum (ETH) — the leader in smart contracts and decentralized applications.
Ripple (XRP) — focused on fast international transfers.
Cardano (ADA) — known for its scientific approach and energy efficiency.
Solana (SOL) — prioritizes ultra-fast transaction speeds.
Polygon (MATIC) — tackles blockchain scalability issues.
Altseason refers to a period when altcoins become the main growth drivers of the market, outperforming Bitcoin in both speed and volume of price gains. During this time, investors often take profits from BTC and move capital into other projects. As Bitcoin’s dominance declines, space opens up for alternative coins to rally. In such phases, traders shift their attention to promising technologies and big news stories, with many altcoin charts showing growth that far exceeds that of Bitcoin.
For a trader, altseason is not just a flashy market phase — it’s a period of maximum opportunity. With the right analysis, it can deliver returns that are hard to achieve during normal market conditions. However, the potential for high profit also comes with high risk. The altcoin market is known for sharp volatility, and choosing the wrong asset can result in losses just as significant as potential gains.
That’s why it’s crucial not only to understand what altcoins and altseason are but also to recognize them in time. This requires a combination of fundamental and technical analysis, tracking Bitcoin dominance trends, and using reliable trading tools that can spot shifts in market cycles. With a thoughtful approach, altseason can become the window of opportunity that opens the door to new results in trading.
Understanding Trend Reversals: Switch Levels & Peak Formations EAs traders, one of our biggest challenges is identifying the trend and recognizing when it's rolling over to form a peak formation. In this video, I’ll give you a quick yet powerful introduction to the theory behind switch levels and peak formations — key concepts for understanding trend strength, spotting reversal zones, and determining when a high or low is potentially locked in.
Whether you’re a beginner or refining your strategy, this video will help you better develop your bias by recognizing when a trend is losing momentum.
📌 Topics Covered:
What are Switch Levels?
Identifying Peak Formations
How to Confirm a Locked-In High or Low
Reading Trend Strength and Shift Signals

HOW-TO: Auto Harmonic Screener - UltimateXHello Everyone,
In this video, we have discussed on how to use our new Auto Harmonic Screener - UltimateX. We have covered the following topics.
Difference between Auto Harmonic Screener - UltimateX (Current script) and Auto Harmonic Pattern - UltimateX and how to use both the scripts together
Difference between Auto Harmonic Screener - UltimateX (Current script) and the existing screener Auto Harmonic Pattern - Screener which is built on request.security calls. We have discussed how the limitations of old script and how using the new script with Pine screener utility will help overcome those problems.
We have gone through the indicator settings (which are almost similar to that of Auto Harmonic Pattern UltimateX
Short demo on how to use the script with Pine Screener
Also check our existing video on How to use the new Pine Screener Utility.

The Trader’s Journey: From Hope to MasteryLadies and gentlemen, fellow traders,
Whether you've just opened your first trading account or you’re already seeing consistent returns, I want to speak directly to your journey — The Trader’s Journey. It’s a path filled with hope, confusion, pain, breakthroughs, and ultimately, mastery.
Trading is not a get-rich-quick scheme — it’s a mirror. It shows you your discipline, your patience, your weaknesses, and your potential. Let me walk you through six powerful stages that every successful trader must face.
Stage 1: The Beginner
This is where the fire is lit.
You’ve just discovered trading — maybe you saw a video of someone making thousands in minutes, or a friend introduced you. You’re excited. You dream of quitting your job, making money in your sleep, living free. You don’t know much, but your heart is in it.
And that’s okay. Every trader starts here — driven by curiosity and ambition.
But beware: this is where most get trapped in illusion.
Stage 2: The Gambler
Without knowledge, the beginner becomes the gambler.
You enter trades without analysis. You chase signals from Telegram channels. You over-leverage, revenge trade, and your emotions run the show. You win once, lose three times, and still believe the next trade is “the one.”
At this stage, you’re not trading — you’re hoping. There’s no edge. Only chaos.
The gambler loses money, but gains the most valuable asset: humility.
Stage 3: The Sponge
Now that you’ve felt the pain of gambling, you decide to get serious. You become the sponge.
You buy courses. Watch endless YouTube videos. Download PDFs. Join mentorships. You’re learning — and learning — and learning.
But here’s the danger: information overload. You start to believe more knowledge equals better results. But unless that knowledge is applied, tested, and internalized, it’s just noise.
The sponge must eventually learn to filter, to focus, and to practice.
Stage 4: The Fighter
You’ve gained skills. Your chart looks cleaner. You can explain concepts now. You win some trades. You lose some. Sometimes you even feel like you’ve cracked it.
But you’re still fighting.
You jump from one strategy to another. You change your system after one bad week. You second-guess yourself. You're in the emotional trenches — and it’s exhausting.
But this stage is crucial. Because it’s here that most quit.
To move forward, the fighter must develop emotional control, patience, and a trading plan they can trust.
Stage 5: The Climber
Now, you're becoming a climber. You’ve found your edge. You follow your rules. You journal your trades. You’re no longer driven by thrill, but by execution. You’ve stopped chasing profits — now you chase process.
You start seeing consistent returns.
Risk management is no longer optional — it’s your oxygen. And trading is no longer about proving yourself — it’s about preserving and growing.
The climber is building the foundation of long-term wealth.
Stage 6: The Oracle
And finally, the oracle.
This trader has mastered not just the charts — but themselves. They understand that trading is 80% psychology and 20% execution. They know when not to trade. They know when to rest. Their results speak, but their ego is silent.
They don’t need to be right — they need to be disciplined.
They live by probabilities. They’ve seen every market condition. And they’ve turned trading into a business — not a hobby.
This is mastery. This is where the journey leads.
In Conclusion
My fellow traders — wherever you are in this journey, honor it. Don’t rush the process. Each stage has its purpose, and each stage will shape you.
You’ll lose trades. You’ll doubt yourself. You’ll feel like giving up.
But if you stay committed — not just to profits, but to growth — you will climb.
Remember: The market doesn’t reward perfection. It rewards consistency. It rewards discipline. It rewards self-awareness.
So I ask you:
🔥 Are you willing to fight through frustration?
🔥 Are you willing to outlast the noise?
🔥 Are you willing to master yourself before mastering the market?
Because if you are… then one day, you won’t just be another trader.
You’ll be a professional. An oracle.
Thank you — and trade well.