Trades for today Tuesday 10/7 B2 shortTrades for today Tuesday 10/7 B2 short using PAR, divergences and a Demark Quarterly Pivot
Contains IO script

Trades for today Tuesday 10/7 BNB shortTrades for today Tuesday 10/7 BNB short Using PAR LTF momentum shift and pivots

Trades for today Tuesday 10/7 BTC shortTrades for today Tuesday 10/7 BTC short....Using PAR, Pd highs and lows and divergences.

Find the ALT TopThis magical chart has successfully found the ALT top since 2021. I've stared at this for countless hours so you don't have to. If you actually run into this, congrats.
1. Wait until a candle on this chart touches the white box.
2. Once hit, move to a 3D chart on your favorite alt.
3. Using marketcipher or the tool of your choice, decide when to sell on the 1>3Day (you can use 1 if 3Day is about to turn for a quicker exit)
4. ????
5. Profit and GTFO into stables > stake > wait for the collapse
IMO NFA GL!

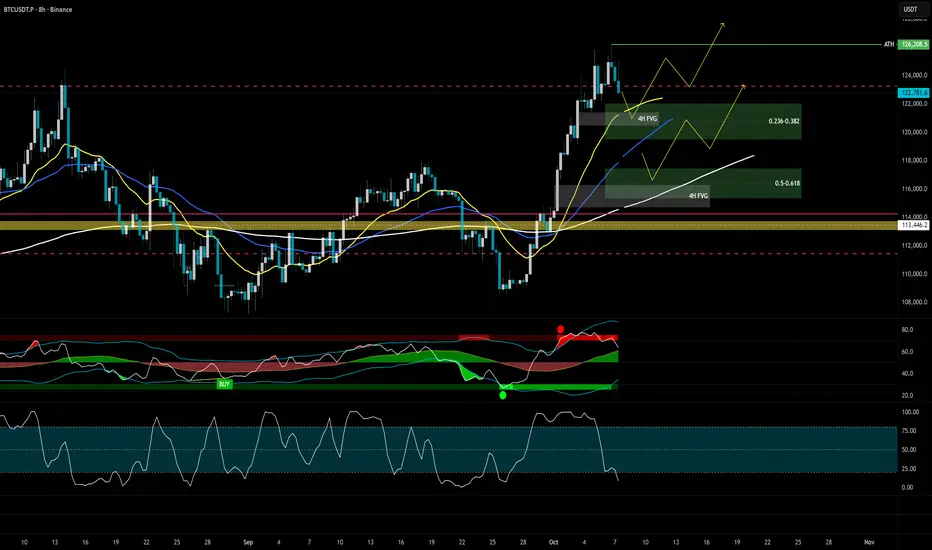
BTC 8H chart - bullish fibonacci pullback zones for resersalCRYPTOCAP:BTC 8H. Not worried about the pullback. Expecting it to hold bullish fibonacci pullback zones.
I have high probability two scenarios in mind approx. 4-8% pullback.
Notice lower oscillator indicator, Stoch RSI on 8H already starting to build momentum at the bottom zone.
Might take couple of days to consolidate in those levels.
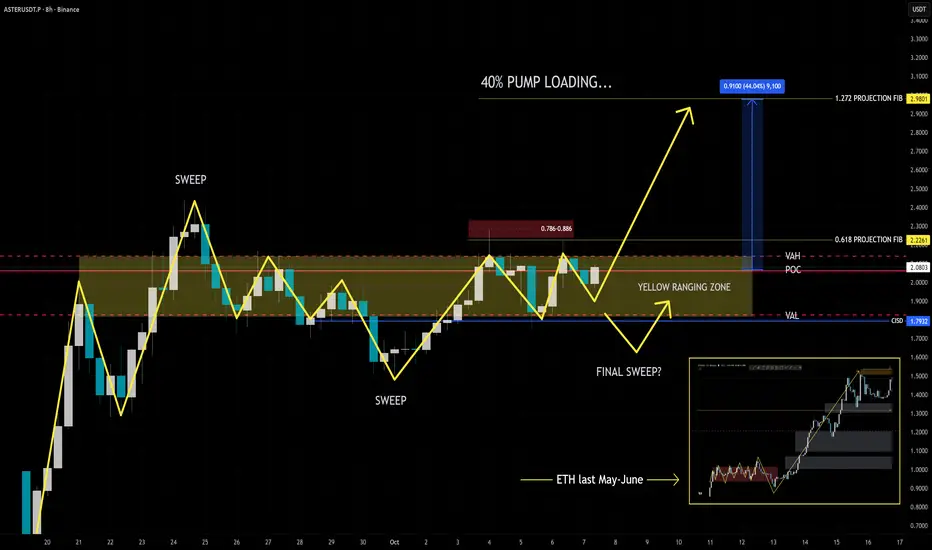
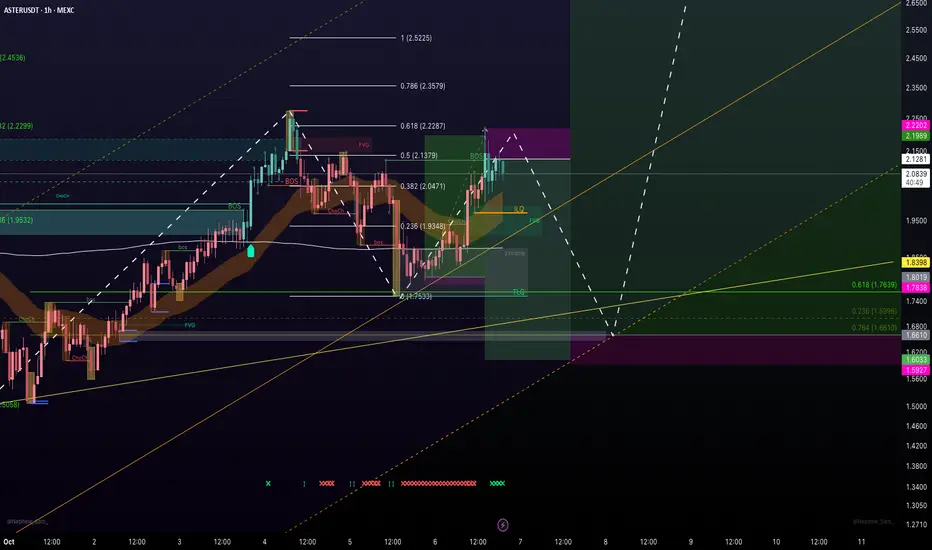
ASTER could be loading a nice pump to $3 regionCheck out the smaller ETH chart on the lower right side. ASTER is now making similar moves by sweeping and taking liquidity on both buy and sell side before high probability continuation upwards.
Are you going to load on these same levels where pink POC level is or wait for lower, maybe Value Are Low (VAL) levels?
I think POC is very good DCA level at this point. If BTC takes little more pullback we easily get 10-20% pullbacks on ALTS so you should always make decisions on risk management first in mind.
Long Term Euro AnalysesDue to Macro-Economic Factors i have an extrmeely Negative Bias for Europe.
Euro
inception - 2008: Strong uptrend (trendline up) + Peak 2008
2008 - 2020: initiating downtrend - Finding support at the uptrend - finding resistence at Downtrend #1
2020 - Now: Indecisiveness
Creating new downtend (blue line).
In 2022 it went below parity 1-1 signaling Weakness .
Right now sep 2025 it is touching the blue downtrend line again. It could find resitence here.
IF it would brake trough the blue downtrend, i am looking at the supplied levels for resistence.
Shifting to dollars now i asume is safe. risking a short term FX pain off 4%-6%.
I have 2 agressive downtrend lines for the future and 2 less agressive ones.
Target: 0.85

Long ARGT ETFShould the 48.46 level hold then I think we'll see an expansion to 100. Price got ahead of itself due to overoptimism with Milei. People expected an overwhelming victory in the most recent elections, and he didn't deliver that. He lost the Buenos Aires election, but his party elected more people than in the last election and the leftist lost seats. It was growth but not at the rate people were hyped up for, nonetheless the direction remains good.

ASTER Short filled - let's go fill my bids down below ASTER is in a paralel channel. Looks like BTC.D want to retest the highs once more before we nuke down and we get some alt action.
Multiple Correlated Currencies = Confluence to take the trade All the information you need to find a high probability trade are in front of you on the charts so build your trading decisions on 'the facts' of the chart NOT what you think or what you want to happen or even what you heard will happen. If you have enough facts telling you to trade in a certain direction and therefore enough confluence to take a trade, then this is how you will gain consistency in you trading and build confidence. Check out my trade idea!!
www.tradingview.com

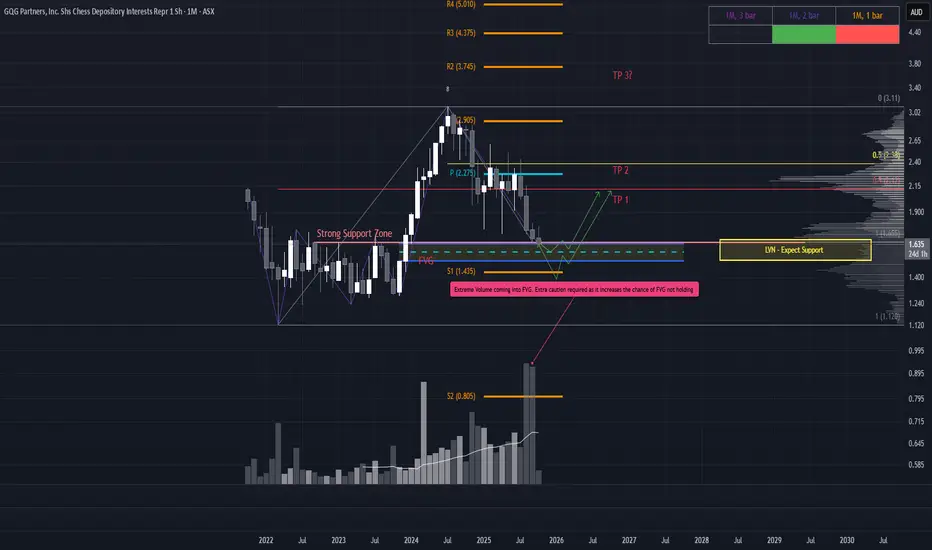
GQG Approaching Strategic Area of InterestGQG has pulled back sharply from the $3.12 high and is now approaching a key Fair Value Gap (FVG) that warrants close tracking. While the probability of this zone holding is reduced due to excessive volume pressure, the setup still offers potential for a favorable risk-to-reward trade, especially if structure and timing align.
Why the FVG Still Matters
Price is testing a major support zone formed by previous highs.
The area sits within a Low Volume Node (LVN), which may act as a barrier to price acceptance.
Proximity to the yearly S1 pivot opens the door for a classic fakeout scenario. Price could spike below the FVG, trap late shorts, stop out longs, and then close back above the pivot.
Trade Scenarios (Early Framework) Still developing, these are preliminary overlays to add to watchlist.
Scenario 1 – Less Likely
Price prints and closes a high-volume bullish monthly candle that tags the Equilibrium of the FVG.
If confirmed, entry would be on the open of the next monthly candle.
Scenario 2 – More Likely
Price pushes down to the yearly S1 pivot, then prints a bullish reversal candle.
Entry would be on the open of the next candle, contingent on structure and volume confirmation.
Targets
Initial target: Macro 50% retracement projected from ATH to ATL.
If price breaks and closes above this level, we could begin mapping for new highs, but for now, we take it one leg at a time.
This isn’t a rush setup, it’s a structure-first, and just being patient.
BITCOIN’S 3 DRIVES OF BULLISH DIVERGENCE ON THE WEEKLY CONFIRMEDBITCOIN’S 3 DRIVES OF BULLISH DIVERGENCE: A WEEKLY RSI SIGNAL YOU CAN’T IGNORE
Bitcoin’s technical structure on the weekly timeframe is flashing a powerful setup that seasoned traders know too well — the Three Drives of Bullish Divergence. This pattern has historically preceded major macro reversals, and it’s now aligning perfectly with Fibonacci extension targets that point to the next potential leg higher.
1️⃣ The 3 Drives of Bullish Divergence
Looking at the RSI oscillator below the chart, we can clearly identify three consecutive higher lows on RSI, while the price printed relatively equal or slightly lower swing lows.
This RSI structure is a textbook “3 Drives of Bullish Divergence” — a pattern that signals waning bearish momentum before a major upside reversal.
Each of the three drives shows buyers stepping in earlier and with greater strength:
1st Drive: RSI bottomed near ~57, signaling initial absorption.
2nd Drive: RSI held higher around ~53, confirming momentum recovery.
3rd Drive: RSI reclaimed the ~55 line with strong bullish follow-through — historically the ignition point for macro rallies.
This sequence often marks the transition from distribution to full trend continuation — and in Bitcoin’s case, the bulls appear ready to take back control.
2️⃣ Fibonacci Extensions — The Roadmap Ahead
Overlaying the Fibonacci extensions from the last correction projects several key upside levels that traders are eyeing:
1.272 extension: ~$132,290
1.414 extension: ~$136,000
1.618 extension: ~$141,425
2.0 extension: ~$151,510
2.618 extension: ~$167,825
Historically, Bitcoin’s rallies after multi-drive RSI divergences have extended toward the 1.618–2.618 zones, making $140K–$167K a high-probability target zone if momentum continues to build.
3️⃣ RSI Momentum Confirmation
The RSI crossing back above its EMA and breaking out of the midline zone (~50) is a critical validation signal. It indicates that underlying buying pressure is expanding even before price fully confirms — a hallmark of institutional accumulation phases.
The combination of a three-drive divergence pattern and a bullish RSI crossover on the weekly timeframe gives a rare confluence of macro momentum and market structure alignment.
4️⃣ What It Means for Bitcoin’s Macro Cycle
This setup mirrors prior long-term inflection points — similar divergences were seen in 2019 and 2020, both preceding multi-month rallies of over 250%.
Given the RSI structure, Fibonacci projections, and improving on-chain accumulation, Bitcoin appears to be entering the expansion phase of its next macro cycle.
⚡ Conclusion
Bitcoin’s chart is sending a clear message — momentum is rebuilding under the surface.
Three bullish drives on RSI, confirmed by strong Fibonacci confluence levels, suggest a technical roadmap toward $140K–$167K in the coming cycle.
The market is evolving — and those who understand the deeper signals will rise with it.
📘 For a deeper dive into how institutional cycles, technical structures, and macro adoption converge in crypto’s evolution, explore my book Rise with Crypto — available worldwide in 🇺🇸 🇪🇸 🇧🇷 on Amazon.
#Bitcoin #BTC #CryptoMarkets #TechnicalAnalysis #Blockchain #RiseWithCrypto #RSI #Fibonacci #CryptoTrading #DigitalAssets

BTC to new ATH. Next reversal pullback at $132K-$135K$BTC. Congrats new ATH after ATH. Price heading to 132-135K zone.
I put resistance/reversal zone on the chart. Based on two different Fibonacci projections on different weekly swings.
Lets see how accurately it works. On backtesting it has been amazingly accurate. Especially when price going to discovery mode.

Ethereum ATH Incoming - As soon as BTC goes back to sleep.
Our BINANCE:ETHUSDT.P algorithm triggered a long position.
All of our technical indicators calculate a 77.8% arithmetic average long signal strength . The most important piece of "evidence" for our speculation that Ethereum will reach new ATH levels within the next month is the fact that Extreme Trend BREAKOUTS and the High-Volatility TREND FOLLOWER conditions triggered the trade together and sit at 100% long signal strength at the time of writing.
Our other breakout condition - Double-Filtered Channel BREAKOUTS sits at 80% long signal strength too. Why is all that relevant? Because these conditions (made up out of 5-6 technical indicators each) are meant to detect and enter breakouts, following the trend from the very start.
While it is programmed to exit at 2%, we believe that a bigger move is in preparation. We recently saw BINANCE:BTCUSDT.P reach unprecedented highs. Historically, when Bitcoin stops it's parabolic growth and money starts flowing back into fiat and other cryptos - ETH benefits first.
Fundamentally, Ethereum is the backbone of the smart-contract and Web3 revolution. Solana, PolkaDot, BNB and other alt-coins are all derived from and inspired by the Ethereum virtual machine. This makes us ask the question - why is Ethereum lagging behind so much behind Bitcoin?
Well, there are a couple of possible answers and they all lead to the same conclusion:
- Solana, with it's lower barriers for entry, profited the most from the retail excitement around meme-coins. The easy coding language and simple, but functional and cheap websites for creating these "meme-coins" took away a large chunk of the retail volume that would otherwise go towards Ethereum.
- Ethereum's switch from proof-of-work to proof-of-stake is just now completing. The release of pre-PoS era staked ETH to large investors over the last year is finally reaching a point in time and price where it is more profitable for large ETH stakers to be incentivized to start keeping their original investment. Basically - there is less and less incentive to sell your staked Ethereum and more incentives to stake more (and therefore buy on Spot).
From the picture above we can see that the $4700 level is a major resistance level. Once that is broken, we have very little historical references for what may happen.
Or in other words - 4700 is the level from which we will bounce into price discovery after hopefully turning into support.
Not a lot of time is left in this crypto cycle. And Ethereum tends to finish it's parabolic increase towards the end of the classical 4-year cycle.

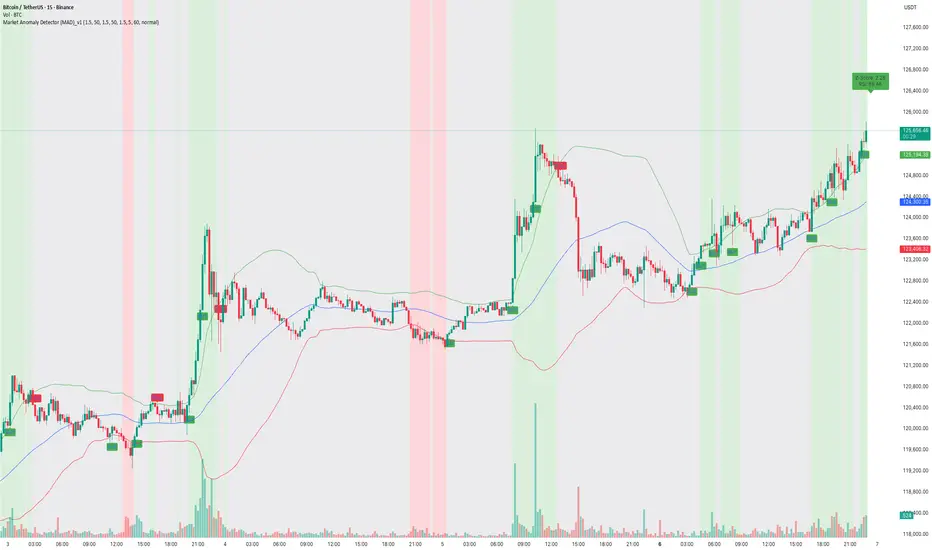
How to capture trend using MAD Indicator!📝 Description:
Watch how the Market Anomaly Detector (MAD) precisely captured the start of the Bitcoin breakout on the 15-minute chart — with no lag, early confirmation, and clear signals.
This BTC/USDT rally was flagged using:
• ✅ Z-Score Spike + RSI confirmation
• ✅ Volume Thrust + Trend Strength Filter
• ✅ Dynamic Zone Coloring for Visual Clarity
• ✅ Trade Cooldown Filter to avoid signal noise
💡 The green background highlights anomaly confirmation zones, while red indicates potential fakeouts or traps.
In this rally:
• The MAD indicator identified the compression breakout
• Maintained bullish zone with no false exit
• Generated a clean trend-following environment using adaptive logic.
🔍 Why MAD Works:
The MAD Indicator isn’t just about spotting anomalies — it adapts based on:
• Market volatility and relative volume
• Internal momentum using z-score logic
• Confirmation from RSI & EMAs
• A cooldown filter to prevent overtrading in choppy zones
📈 Perfect for scalpers, intraday traders, and short-term swing setups on crypto and stocks.
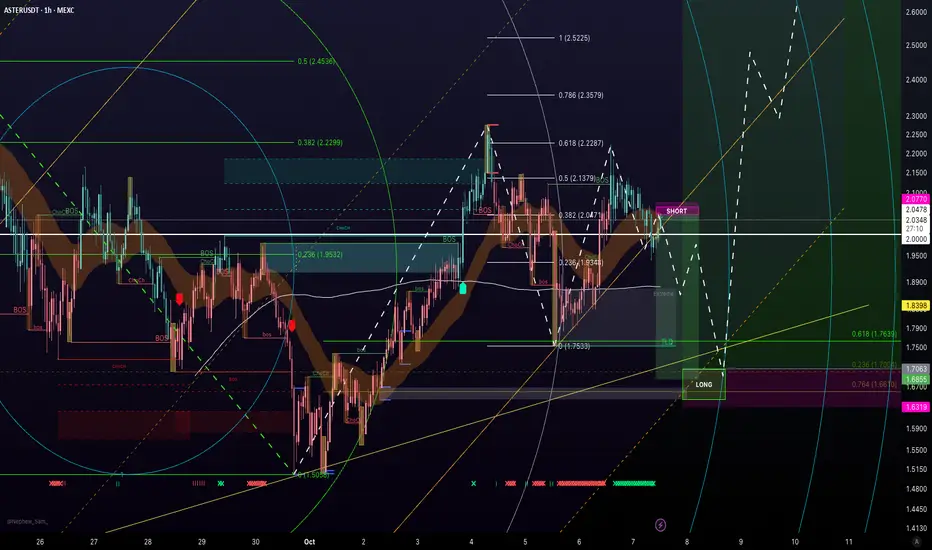
ASTER might be looking for final touch down before lift off We can see some confluence in the area of 1.65 - 1.7 area. Hedging the long from previous .618 retest. BTC.D might be looking for some unexpected upside before we start the next leg down.
Long term bullishTriple bottom at 217 and historically strong support. Good tech. MACD and RSI bullish buy signals.

Baby doge bulish momentum Baby doge big move in next few days
0.096 cent soon
Don't miss this opportunity

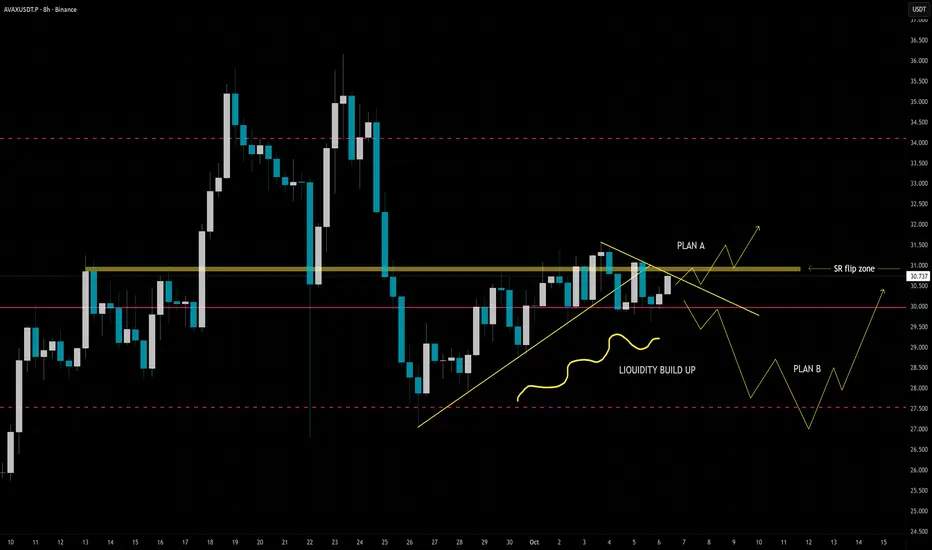
AVAX 8HCRYPTOCAP:AVAX 8H. Plan A please, thank you, por favor.
We broke below trendline, made fakeout upwards and back down again. In case we don't reclaim support of yellow SR flip zone and break down pink POC level there is a higher chance for Plan B to get in action some level.
Plan B. Pink dotted line = VAL = Value Area Low areas is the extreme around 10% drop. I don't expect price to go that low but check out that big wick on the left. There is possibility to make similar kind of wick under POC level.
BTC WILL NOT BE THERE🪙 CRYPTOCAP:BTC October 10th 😅 Straddle breakevens:
118000 & 127000
🪙 CRYPTOCAP:BTC October 17th 😅 Straddle breakevens:
116000 & 130000
σ Sigma probabilities:
October 10th
| σ | Multiplier × 😅 | Probability
| 1σ | 117000 & 128000 | ≈68%
| 2σ | 112000 & 133000 | ≈95%
October 17th
| σ | Multiplier × 😅 | Probability
| 1σ | 114000 & 131000 | ≈68%
| 2σ | 106000 & 139000 | ≈95%

NIFTY METAL INDEX - LONGNSE:CNXMETAL Weekly chart showing outperformance for coming months also possible. In commodities also showing price consolidations breakout in some of the metals. Jsw steel, Hind Zinc, Jspl, Moil,Jsl,Hindalco looks positive on chart.

ETH: Drop from $4334On September 22, Ethereum turned downward from the $4334 level on the 1-hour timeframe. The move was strong: the price broke through all four profit-taking stages and reached $3819, giving a difference of more than $500 per coin. Those who held the trade systematically captured a result that would have been painful to miss.
I managed the trade step by step: the algorithm highlighted key profit zones and moved the position to breakeven in time. This removed emotions and allowed me to focus on strategy rather than doubts. Such an approach works like a navigator — the road is clear in advance, even when the market throws sharp turns.
An interesting fact: most financial indicators are based on mathematical formulas that exclude the psychological factor. That’s why discipline and algorithm often outperform intuition. In my experience, the win rate for Ethereum trades stays above 80%, and this case only confirmed that statistic.
The market will always look chaotic to those who act emotionally. But when the process is built on a system, trading shifts from guessing to a structured process, where results are defined by discipline.

BTC: Growth from $109KOn September 28, Bitcoin turned into an upward movement on the 1-hour chart from the $109,804 zone. From this level, the market went through all four stages of profit-taking and reached $120,999, giving a potential difference of more than $11,000 per coin. Those who followed the system were able to capture the maximum from this trend.
The key point here is how the movement was managed. The algorithm highlighted important zones, helped secure the position in time, and reduced risks. No emotions, no guessing—just a step-by-step process where every action was clear in advance and confirmed by market structure.
For beginners, such a tool works like a navigator: it shows where it’s safer to lock in profits and when it makes sense to hold longer. In conditions of high volatility, discipline, automation, and technical analysis become the main advantage. That’s what turns the market from a chaotic game into a structured process. An interesting fact I’ve noticed is that this indicator shows an 84% win rate on Bitcoin trades.
