RISING AND FALLING WEDGES
Good afternoon.
Today we are looking at another chart pattern
RISING AND FALLING WEDGES .
Let’s get on it.
Wedges can either be continuation or reversal patterns.
Just to refresh your memory, continuation patterns are formations that show side way price action, signalling a temporary pause in the trend; whereas reversal patterns indicate a change in the trend.
Whether wedges are continuation or reversal, it’s not really significant, what matters is spotting the pattern, and knowing how to make money out of it.
Wedge patterns are classified as either RISING WEDGES OR FALLING WEDGES.
Rising wedges, as the name implies, slopes upwards, and they eventually break to the downside
Graphically, rising wedges look like the above sketch chart(Sketch 1)
notice how the slope of the support line is steeper than that of the resistance.
This indicates that higher lows are being formed faster than higher highs. That is precisely how the wedge pattern get to be formed.
The inverse of the rising wedge is the FALLING WEDGE , which usually breaks to the upside.(Sketch 2)
Just like on the rising wedge pattern, the falling trend line connecting the highs (resistance) is steeper than the trend line connecting the lows (support).
As mentioned earlier, rising and falling wedges can either be continuation or reversal patterns.
But whether they be continuation or reversal patterns is not our focus, our focus is on making money when these patterns ‘BREAKOUT’ .
If you case you are wondering what we mean by ‘breakout’; consider the chart above(Sketch 3) of a falling wedge and a rising wedge, and how they typically break to the upside and downside, respectively
Now let’s look at how we can make money out of a RISING WEDGE PATTERN.
Let’s start by considering the chart (Sketch 4)
Now, when entering a Short trade based on a rising wedge, it’s important to wait for a break and close below the support line.
After this close, aggressive traders can ‘pull the trigger’.
But a more conservative way to enter the trade, is to wait for a retest of the previous support (now resistance) before pulling the trigger.
In this case the sequence will be something like this:
1. Wait for a close below support
2. Wait for a retest of the previous support
3. If the previous support act as resistance, then enter short trade
A Long trade based on a falling wedge is entered on the same principle (but in reverse), that is,
1. Wait for a price close above resistance
2. Enter Long trade at that close (for aggressive traders)
3. For conservative traders, wait for a retest of the previous resistance (now support) before pulling the trigger
That’s ENTRY, now let’s look at placing stop loss and take profit levels when trading wedge patterns.
Take profit target should ideally be the height of the wedge formation.
Consider the chart above(Sketch 4)
Stop loss orders should always be placed at a level that if hit, it will invalidate the trading set up.
In the case of rising wedges, this level will be the area just above resistance.
The opposite is true for falling wedges, place stop loss just below support.
Thanks for your Likes and Support....
Until next time, let’s keep if Profitable!
Continuationpatterns


GBPUSD shortAfter a target hit in the previous analysis bears lost momentum allowing a retrace to a critical zone around 1.2500. Bears have regained strength as predicted leading the down trend to lower price levels. A critical target support zone can be established at 1.2200 where price should either consolidate or go into a reversal trend. A partial profit (Take profit 1) can be set at 1.2350.

Possible bull continuation at the bottom of a forming triangleTriangle formation at 1D time frame. It is resisted three times to the long side along the trendline. It also supported two times the second time with a hammer at the bottom. I could possibly continue up to the bull side if we get one or preferably two more confirmations to enter. It could also retest and continue down to the main upward trendline, but again we need more confirmation to enter either side, but for now I am inclining myself more to the bull side.

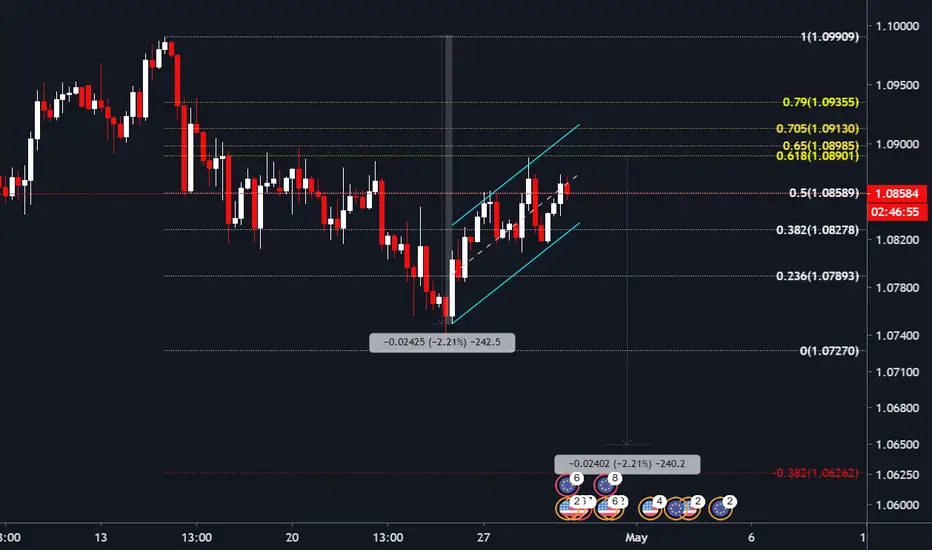
EURJPY 4Hour analysis- Falling Wedge continuation patternEURJPY has formed a beautiful falling wedge continuation pattern. we will be expecting a retest as a Doji candle has previously formed, after that we expecting major impulses to the upside. Lets milk this pair.

AUDNZD-Long Price is at support level and currently trading in a falling wedge creating a area confluence for a nice buy setup.

USDJPY 4HR - Bullish Continuation Setup The USDJPY recently put in a beautiful rising channel right into a previous level of structure resistance...and it failed. Now that we've broken the simple pattern 7 the previous level of structure, there's a chance that we can continue going higher & a pullback trade would be an excellent place to get involved prior to the move.
Something to keep in the back of your mind however is that although there is a smaller structure zone above that would make a good place for target, we are technically trading within the higher timeframe structure zone.
For more on this trading opportunity please check out the youtube video "Learn to Trade - Small Differences in Good vs. Great Trading Opportunities" around the 5:15 mark
I hope you guys have a great week of trading.
Your Trading Coach - Akil

Gravity's force will bring the BTCUSD down from the 12300 price!The force of gravity will bring the BTCUSD down on the 12300 price !!
After doing an exhaustive analysis, about trends, harmonic patterns, Elliot's waves, continuation and reversal patterns, I have come to the conclusion that the BTCUSD will probably be falling from the sky due to the force of gravity of the price, and we will probably see it in floor.
AT 12300
SL: 14290
Final TP: 6351

Big Biotechs Ascending TriangleIBB is forming an ascending triangle, which is a continuation pattern after the breakout.
Important to note the 20sma, which has been very supportive in the trend. The is also some support we can see many candlesticks with bottom wicks, meaning the shorts were met with buyers very quickly.

THETA Crypto Bullish Triangle / Pennant PatternTriangle / Pennant Pattern on crypto Theta. Has a recent history of breaking out to the upside, volatility on williams vix fix declining so my guess is breakout to the upside.
Previous divergence of vix lead to breakout to the upside not long ago. Current Vix Reading not quite diverging from price but nonetheless it is declining with the pattern forming.

BUY in BTCUSD! at now. It could reach 14.4K!Doing a better analysis, and taking into account the crab and bat patterns, I conclude that the BTCUSD would be rising strongly from now on, up to the 11-14K zone, confirmed by Elliot waves, and the continuation pattern.
And then make a new fall, well ...
Do not miss the opportunity, see you there for the 11-14K!


GBPAUD 1.89751 -0.25% SHORT IDEAGOOD DAY TRADERS
HERE'S AN UPDATE ON THE GBPAUD PAIR
> CONTINUATION TO THE DOWN SIDE
IF YOU TOOK THIS ONE ADJUST SL TO THE PREVIOUSE SWING HIGH
IF NOT LOOKING OUT FOR SHORT OPPORTUNITIES ON LOWER TIMEFRAMES
PERIOD - SWING
RISK MAMAGENNT
> >> IF YOU LIKE THIS IDEA KINDLY LEAVE A LIKE AND COMMENT... KINDLY FOLLOW AS WELL FOR MORE SWING AND DAY TRADE IDEAS, APPRECIATE IT..

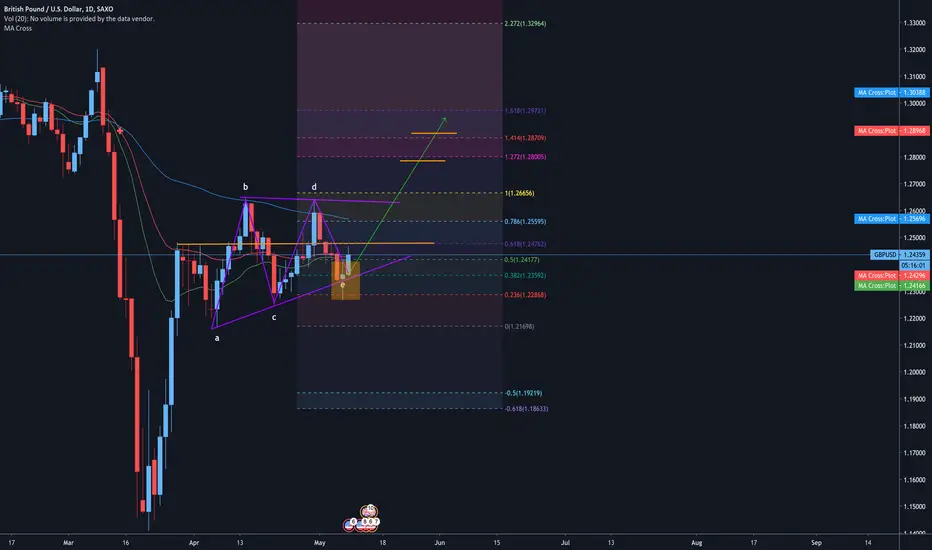
GBP/USD LONG POSITIONSGBPUSD long possitions wedge continuationpatterns.
look rejection in 0.236, like morning star (+).
BUY NOW or Breakout position, TP orange line, SL 1.22680
GBPCAD bearish To 1.74800 .As we can see here we have end of correction 50.0 Fibo. and we see break of flag continuation all this confirmation support GBPCAD
Bearish To 1.74800.
Thank you.
" MK "

NZDCHF SHORT-continuation pattern back to the 200EMA
-Rejection candles needed to execute this trade
Follow my Instagram @_Selfmademo

#EURUSD - Possible Bearflag as wellPrice rejected at .618
the trend is bearish looks like we will continue if H&S idea works out
then I will just keep moving my stops for the bear flag targets
#DYOR
A/U BULL RUNPrice Action says it all.
1.Up trend
2.Break-out
3.Break-out retest
4.Let price/market decide what it does

COST setting up nicelyThe weekly looks to be developing a nice base. The daily is not quite ready yet but the weekly is showing a potential buying opportunity through 325 if everything lines up.


#Bitcoin TriangleEither this is a continuation triangle and we will continue the dump
or we gonna breakout up & BART UP to 7300
u know the drill whichever side breaks enter the trade long or short on the retest


