BTC: Careful out there.Bitcoin has lost it's momentum, also evident in GOLD/BTCUSD graph (meaning, gold has stole the show from btc). Lower Lows in this graph would mean bear market or a deeper correction Imo.
Other bad sign is SOXX/SPX lower highs, underperforming. Could be a sign for market top but lets see.
Correction

$BTC Correction DOES NOT = Bear MarketPeople are rushing to call it a 🐻 market for CRYPTOCAP:BTC while the correction is 27.8%
Fun Facts:
There were 2x 32%+ corrections between 2024-25
On average, there are at least 3x 30%+ every bull cycle
🐻are in control since summer no doubt
But it's not a 🐻market yet...

BTCUSD Bulls Aim Higher: Buyers Eye Breakout Toward $107,500Hello traders! Let’s take a look at the current BTCUSD structure. After an extended corrective phase within a descending movement, the market found solid support near the $100,000–$100,200 Buyer Zone, which aligns with both the horizontal Support Level and the lower boundary of the broader structure. This zone has repeatedly triggered strong buying reactions in the past, confirming it as a key demand area. Recently, Bitcoin began forming a bullish correction channel, where price has been developing higher highs and higher lows, suggesting early signs of trend recovery. Within this structure, buyers successfully defended the Buyer Zone, followed by a steady rise toward the $107,000–$107,500 Resistance Level — a zone that previously acted as a Seller Zone during prior rejections. At the moment, BTCUSD is consolidating inside this ascending channel, trading slightly below resistance. The market may attempt another push toward TP1 at $107,500, which aligns with the upper resistance line and marks a potential short-term target. If price manages a confirmed breakout above this level, we could see further continuation toward the next resistance around $111,000. However, if the price faces rejection at the current resistance, a temporary pullback toward the Support Line or Buyer Zone ($100,200–$101,000) could occur before the next wave of growth. The structure remains bullish as long as Bitcoin stays above the ascending Support Line. Please share this idea with your friends and click Boost 🚀

Monitoring AI Valuation - Precision on Upcoming CorrectionThese are the three largest market-cap listed companies on the Nasdaq.
If we are concerned about an AI bubble, I’m going to show you how I perform a quick glance at some top companies and their index to determine the likelihood of an upcoming short-, mid-, or long-term correction.
In 2017, Microsoft’s P/E reached its highest at 45 — and it continued to rise after that.
In 2023, Nvidia’s P/E reached its highest at 147 — and it continued to rise after that.
In 2024, Apple’s P/E reached its highest at 40 — and it continued to rise after that.
Micro E-mini Nasdaq-100 Index
Ticker: MNQ
Minimum fluctuation:
0.25 index points = $0.50
Disclaimer:
• What presented here is not a recommendation, please consult your licensed broker.
• Our mission is to create lateral thinking skills for every investor and trader, knowing when to take a calculated risk with market uncertainty and a bolder risk when opportunity arises.
CME Real-time Market Data help identify trading set-ups in real-time and express my market views. If you have futures in your trading portfolio, you can check out on CME Group data plans available that suit your trading needs www.tradingview.com

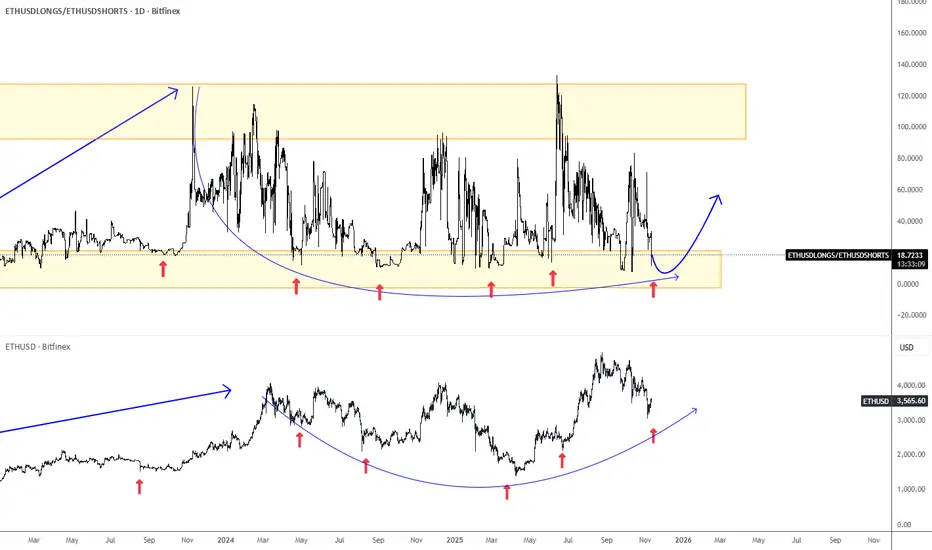
Ethereum Is Approaching SupportEthereum has been slowing down since August, but the wave structure remains slow, choppy, and overlapping, which suggests a correction within an ongoing uptrend. The ideal support area appears to be around the 3000 level.
One of the main reasons Ethereum may find support is the ETHUSD Longs/Shorts ratio chart, which came back to the lower end of its range. This indicates that many speculators are attempting to short the market while giving up on long positions.
If we take past cycles into account, Ethereum may experience limited weakness. Therefore, keep an eye out for a potential rebound and a bullish continuation, while the ETHUSD Longs/Shorts ratio chart could move back toward the upper side of its range.
DCR - The Calm Before the Next Impulse!📈DCR has recently surged in a parabolic manner, posting one of its strongest rallies in months. However, after such a vertical move, a correction phase was inevitable, and that’s exactly what we’re seeing now.
📉At the moment, price is retracing within a clear descending channel, approaching a massive confluence zone marked by the demand area and the lower red trendline. This intersection represents a key area of interest to look for potential long setups.
⚔️If buyers manage to defend this zone, DCR could soon resume its next impulsive leg upward, potentially breaking out of the correction structure and extending the broader bullish momentum.
⚠️ Disclaimer: This is not financial advice. Always do your own research and manage risk properly.
📊All Strategies Are Good; If Managed Properly!
~Richard Nasr

BTCUSD Tests Buyer Zone — Eyes Break Below $100KHello traders, here’s my current outlook on Bitcoin (BTCUSD). The market continues to trade within a broader bearish structure after breaking down from the previous rising channel. The price failed to hold above the $110,000–$111,000 Seller Zone, where multiple fake breakouts occurred, indicating strong bearish pressure and aggressive selling activity in that region. After the rejection from the Seller Zone, BTC shifted into a descending trend structure, forming lower highs along a clearly defined Resistance Trendline. Each corrective move to the upside has been capped by this trendline, confirming that sellers are maintaining control. Meanwhile, the Support Level around $100,200–$101,000 has acted as a key Buyer Zone, where price has repeatedly paused and reacted, suggesting that buyers are attempting to absorb selling pressure here. Currently, BTC is consolidating just above this Support Zone, but the overall momentum remains bearish. If the price fails to break above the descending Resistance Line, we could see a continuation of the downtrend, likely pushing toward a retest of the $100,200 Support Level. A confirmed breakdown below this level would expose the next downside support levels and reinforce the sellers’ dominance. However, if buyers manage to hold the price above $100,200 and force a breakout above the descending Resistance Line, a short-term corrective recovery could unfold toward the $103,000–$105,000 region. This area remains critical and is likely where sellers may look to re-enter the market based on previous reaction structure. For now, the market structure favors a bearish bias, with the trend down and sellers maintaining stronger control. I am watching for a reaction at the current support — if the level breaks, continuation lower becomes the primary expectation. Please share this idea with your friends and click Boost 🚀

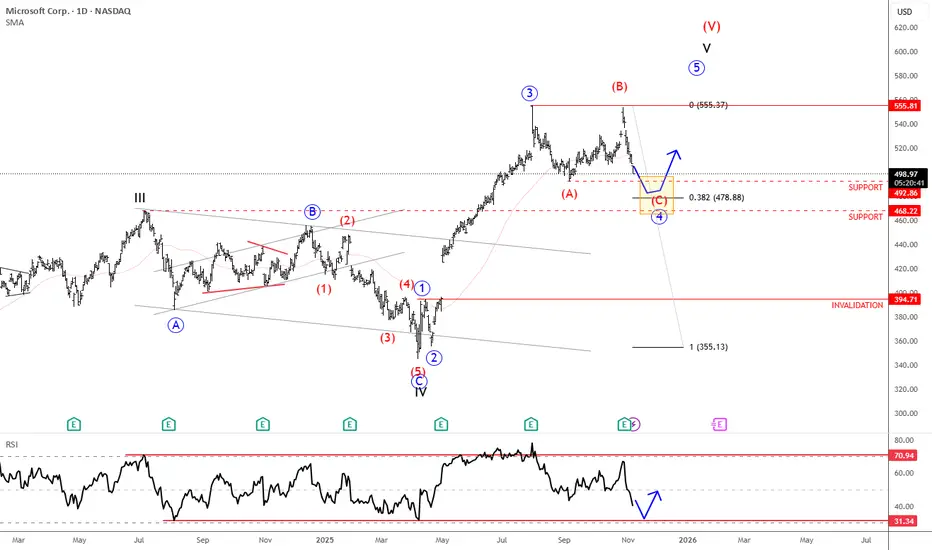
Microsoft Is Finishing Wave 4 CorrectionMicrosoft is in a wave 4 correction, and once it's fully completed, it can extend the rally within wave 5 from a technical point of view and according to Elliott wave theory.
Microsoft is a global technology company founded by Bill Gates and Paul Allen in 1975. It’s best known for its Windows operating system, Microsoft Office suite, and cloud platform Azure. Over the years, Microsoft has expanded into gaming (with Xbox), professional networking (LinkedIn), and AI (through partnerships like OpenAI). Today, it’s one of the world’s most valuable and influential companies, shaping software, hardware, and cloud computing industries.
Microsoft reported earnings last Wednesday after the close, with the price turning lower after reaching new highs. The structure still appears to be a wave four in progress — a flat correction where the current drop likely represents wave C. Wave C often stabilizes near wave A levels, suggesting support around 492 and 468 (the former 2024 high). Holding this zone could set up the next rebound into the final higher-degree wave five.
Highlights:
Trend: Corrective phase, wave C of flat in progress
Potential: Rebound toward new highs once support holds
Support: 492 / 468
Invalidation: Below 394
Note: Watch for stabilization at support before potential wave five continuation
EUR/USD - Bearish Correction 🧠 Bias: Bearish continuation after correction
After a strong impulsive drop, EUR/USD is now pausing to retrace and correct before the next leg lower. Price is showing all the classic correction signs — structure shift, smaller candles, reduced volume, and internal pullbacks.
📉 Dai ly Breakdown
The pair completed a 5-wave bearish impulse (ending around 1.1500).
Current movement is wave (iv) correction — a retracement leg after that drop.
We’re reacting to a minor 4H demand zone, but overall, structure remains bearish under the descending trendline.
There’s a liquidity void just above (orange zone), which price might fill before continuing downward.
The next major buy zone sits around 1.1350–1.1400, aligning with daily + weekly demand and 200 EMA confluence.
⏱ Weekly Context
Weekly chart shows a clean rejection from 1.1800 weekly supply (BSL sweep → BOS down).
As long as we trade below that 1.1600–1.1650 weekly zone, bias remains bearish.
The long-term target aligns with 1.0700, the next untouched weekly demand area.
🎯 Expectations
Short-term:
Correction toward 1.1600 – 1.1650 possible (liquidity fill + premium zone).
Medium-term:
From that area, expect a continuation leg down toward 1.1350 (daily demand) or even 1.0700 (weekly demand).
⚙️ Risk Management
Avoid early longs — the correction could still push lower to retest previous lows.
Look for a premium retracement entry (71% fib + OB confluence) for the next swing short.
Stops above 1.1700, targeting 1.1350 then 1.0700.
🧩 Summary
EUR/USD is cooling off after a solid bearish wave — a textbook correctional stage before the next impulse down. Expect a slow climb into premium pricing before the bears reload for another leg south.

BTCUSD Rebounds from Support — Bulls Eye $106K Recovery MoveHello traders, I want to share with you my opinion about Bitcoin (BTCUSD). Bitcoin has been experiencing a prolonged corrective phase following a previous bullish rally. The market recently retested the Buyer Zone near $103,800–$104,200, where strong demand has once again emerged. This area has historically acted as a reliable support level, preventing deeper declines and triggering multiple rebounds. Currently, the structure is forming a descending wedge pattern, characterized by converging resistance and support lines. This technical formation often signals potential bullish reversals, especially when it appears near a key demand zone. The latest test of the lower wedge boundary coincided with the Support Level, resulting in a sharp reaction from buyers. From my perspective, as long as the price holds above the Buyer Zone, the probability of a bullish breakout increases. A confirmed breakout above the resistance line would likely validate a move toward the $106,000 TP1 level, which aligns with previous local highs and the upper boundary of the pattern. However, if BTC fails to break the resistance and falls back below $103,800, sellers could temporarily regain control, pushing the price lower before another accumulation phase develops. Overall, the current setup favors the bulls, with clear structural support and a tightening pattern suggesting that Bitcoin may soon attempt a rebound toward $106,000 and potentially higher levels. Please share this idea with your friends and click Boost 🚀

GOLD XAU/USD: Wave ((1)) Near Completion - Wave 2 Zigzag vs Flat GOLD: WAVE ((1)) COMPLETE - WHAT'S NEXT?
Wave ((1)) nearly finished at ~$3,989. Next: Wave ((2)) correction
to the $4,250 area. But which pattern?
━━━━━━━━━━━━━━━━━━━━━━━━━━━━━━━━━━━━
ZIGZAG (60% Probability) Pattern: A-B-C (sharp, V-shaped)
• Wave (A): Sharp 1-2-3-4-5 impulse
• Wave (B): Brief recovery (~30-40% of wave A)
• Wave (C): Sharp impulse (~equal to A or 1.618x A)
━━━━━━━━━━━━━━━━━━━━━━━━━━━━━━━━━━━━
FLAT (40% Probability) Pattern: A-B-C (sideways consolidation)
• Wave (A): Moderate move
• Wave (B): Recovery that reclaims wave A (~80-120% of A)
• Wave (C): Normally sharp 1-2-3-4-5 impulse (~50-120% of A)
If price retraces 100% of wave 1 (above $3,956) Structure INVALID
MY BIAS: ZIGZAG
Wave 1 was powerful → Sharp corrections follow
Support: $3,956 (invalidation level)
Resistance: $4,150 - $4,200 - $4,250
IMPORTANT ELLIOTT WAVE RULES FOR WAVE 2:
━━━━━━━━━━━━━━━━━━━━━━━━━━━━━━━━━━━━━━━━
✓ Wave 2 CANNOT retrace more than 100% of wave 1 (invalidation rule)
✓ Wave 2 CANNOT be a triangle (only B and (iv) can be triangles)
✓ Wave 2 CANNOT be a combination beginning with a zigzag
(combinations only if starting with a flat)
These rules help us eliminate possibilities and confirm structure.

BTCUSDT: Buyers Aim for Recovery Toward $115K ResistanceHello everyone, here is my breakdown of the current Bitcoin setup.
Market Analysis
Bitcoin (BTCUSDT) is showing a constructive bullish setup after rebounding from the 106,600–107,000 Support Zone. This area has consistently acted as a strong demand region, confirming buyers’ interest each time price tested the lower boundary of the Upward Channel. The market structure has remained bullish overall, characterized by a series of higher highs and higher lows since the correction phase in mid-October.After a recent fake breakout below the support line, buyers quickly regained control, pushing price back above the channel’s lower boundary. This rejection from support and recovery above 110,000 suggests renewed bullish momentum.
Currently, BTCUSDT is approaching the midline of the channel, while short-term resistance lies at 115,400 — a level that coincides with a previous fake breakout zone and horizontal supply area.
My Scenario & Strategy
As long as BTCUSDT holds above the 109,000–110,000 region, the bullish scenario remains valid. I expect the price to continue climbing toward the 113,000–115,400 Resistance Zone in the near term. A clean breakout above 115,400 could open the way for another bullish leg toward the upper boundary of the channel near 117,000–118,000.
However, a confirmed rejection from 115,400 could trigger a temporary pullback toward the support trendline before another potential push higher. In my view, Bitcoin remains in a healthy uptrend, and I prefer to look for long opportunities from dips above the support line, targeting 115,400 (TP1) and potentially 117,000 (TP2).
That's the setup I'm tracking. Thank you for your attention, and always manage your risk.

BTCUSD Rebound Setup: Buyers Target 114K Resistance ZoneHello traders, I want to share with you my opinion about Bitcoin (BTCUSD). Bitcoin continues to move within a well-defined descending channel, forming a consistent pattern of lower highs and lower lows. This confirms that the market remains under bearish control, with sellers actively defending each retest of the resistance line. The Resistance Level at 115,600 has acted as a major cap for bullish attempts, rejecting multiple upside moves over the past few weeks. Recently, BTC retested the Buyer Zone near 108,000–109,000, where strong demand emerged, preventing further downside. This level aligns with both the Support Line of the channel and the horizontal Support Level at 106,400, making it a critical zone for potential bullish reactions. At the current stage, the price is showing early signs of a corrective rebound from the Buyer Zone. I believe this recovery could push the price toward the Seller Zone and Resistance Line, with a short-term target (TP1) around 114,000. However, this move should be viewed as a correction within a broader bearish trend unless BTC manages to break and hold above the 115,600 resistance area. My scenario suggests that BTC could face selling pressure once it reaches the upper boundary of the channel, possibly leading to another bearish leg unless bulls confirm a breakout. Please share this idea with your friends and click Boost 🚀

XAUUSD: Correction Phase Aiming Toward 3,900 SupportHello everyone, here is my breakdown of the current Gold setup.
Market Analysis
Gold (XAUUSD) has shifted from a strong bullish phase into a clear bearish structure after failing to sustain momentum above the 4,130 Resistance Zone. The market initially traded within an Upward Channel, forming a steady series of higher highs and higher lows until buyers lost strength near the top of the range. A breakout from the channel confirmed the end of the bullish impulse, followed by a range formation and multiple fake breakouts, indicating indecision and growing selling pressure. Eventually, the market broke below the range, retested the resistance area, and established a Downward Channel, showing that sellers have regained control.
Currently, Gold is moving within this descending structure, respecting both the upper and lower boundaries of the channel. The Resistance Zone around 4,130 has once again acted as a strong supply area, rejecting price and pushing it lower toward the Support Zone near 3,900.
My Scenario & Strategy
From my perspective, XAUUSD is likely to continue its short-term bearish correction toward the 3,900 support level, which aligns with the lower boundary of the channel. A successful test of this area could trigger a short-term reaction or even a potential reversal if buyers step in.
As long as price remains below the Resistance Zone (4,130) and within the Downward Channel, the bearish sentiment remains dominant. A confirmed breakdown below 3,900 could open the door for a deeper move toward the 3,850–3,820 zone. For now, I remain bearish in the short term, looking for short opportunities from the upper channel resistance with a primary target at 3,900.
That's the setup I'm tracking. Thank you for your attention, and always manage your risk.

BTCUSDT Breakdown Ahead: Sellers Eye $108K SupportHello everyone, here is my breakdown of the current Bitcoin setup.
Market Analysis
BTCUSDT has been consolidating within a well-defined range, facing multiple rejections from the $121,700 Resistance Zone. After several failed breakout attempts above this area, the market shifted into a bearish phase, confirming sellers’ dominance. The structure now forms a descending triangle pattern, a classic bearish continuation signal. We can see multiple breakouts and retests throughout the move, with price respecting both the Triangle Resistance Line and Support Line. The most recent rejection from the upper boundary of the triangle shows that buyers are losing momentum, while sellers are gradually regaining control.
Currently, BTCUSDT is approaching the Triangle Support Zone around $110,000–$108,800, a crucial level where previous reactions occurred. A clean break below this support area could accelerate the downside move, confirming a continuation toward the lower Support Zone near $105,000–$103,000.
My Scenario & Strategy
In my view, BTC remains in a vulnerable technical position. If the price closes below the $108,800 level, this would likely trigger a fresh bearish impulse, leading to deeper declines. Until a confirmed breakout happens, short-term traders may look for retest entries after breakdowns for better risk-to-reward setups.
However, if BTC finds strong support and rebounds from this level, we could see a short-term correction toward $114,000–$116,000, which would act as a retest of the Triangle Resistance Line before further decline. For now, my bias remains bearish, expecting continuation to the downside as long as price stays below the $114,000–$116,000 resistance zone.
That's the setup I'm tracking. Thank you for your attention, and always manage your risk.

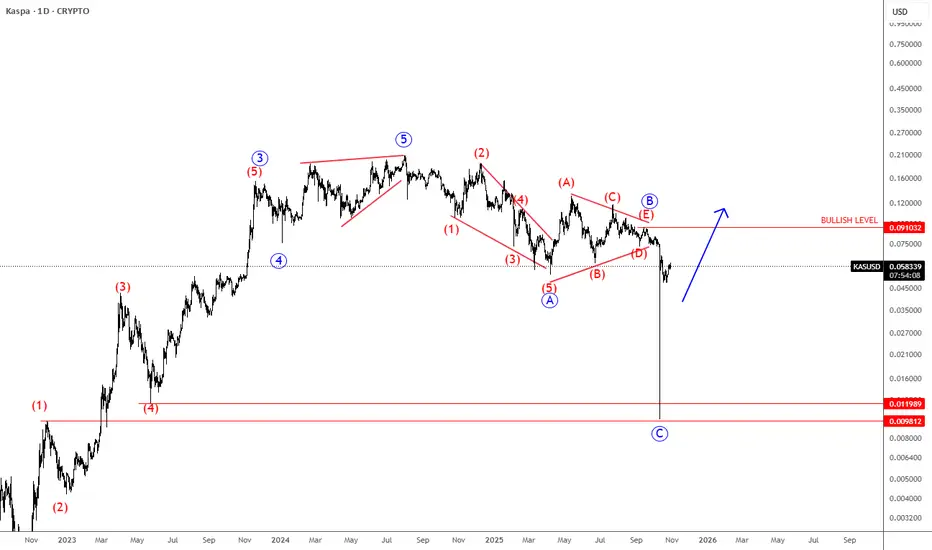
Kaspa Completes A Correction After A Huge SpikeKaspa Completes A Correction After A Huge Spike that can be supportive, as we see a corrective structure within the uptrend by Elliott wave theory.
Kaspa is a proof-of-work (PoW) cryptocurrency that uses the novel GHOSTDAG protocol (a block-DAG consensus rather than a single linear chain) to allow many blocks to be produced more rapidly and co-exist. It was launched without an ICO / pre-mine (fair launch) and positions itself as more scalable than many PoW chains. Because of this, it has attracted interest as a “next-gen PoW” or “fast chain” alternative.
Kaspa’s sell-off appears of a combination of leveraged long liquidations intensifying a move down, weak macro/altcoin sentiment and structural risks (adoption/supply concentration). Despite a massive price drop, sparking fear and pessimism across the market, such deep pullbacks often create opportunity rather than signal failure. Despite the volatility, Kaspa’s fundamentals remain solid. Its innovative GHOSTDAG technology, fair launch, and strong network activity continue to set it apart. When fear dominates and sentiment turns overly negative, it can actually be a supportive setup for long-term investors looking to accumulate quality projects at discounted levels.
From Elliott wave perspective, KASUSD(Kaspa) spiked down out of a wave B triangle pattern into wave C, so it’s a higher degree ABC correction. It still looks promising for the future, and we may still see some rally in the current bullish cycle. Bullish confirmation is above 0.091 area.
When Generals Run and Soldiers Nap — The Market’s Odd ParadeEver seen an army march where the generals sprint ahead, but the soldiers just yawn and stay behind?
That’s exactly what’s happening in the U.S. futures battlefield right now.
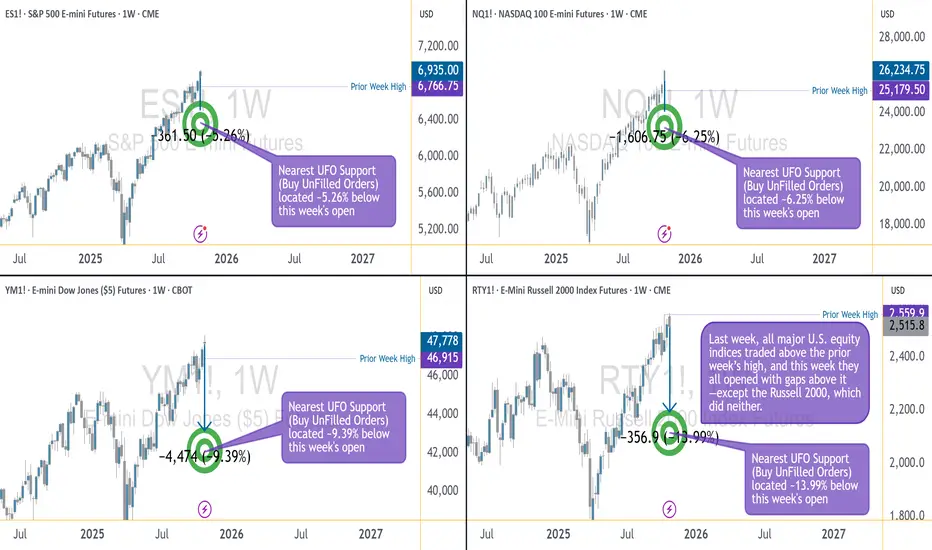
The ES, NQ, and YM — our large-cap “generals” — opened the week above their prior highs, looking ready for victory speeches. But the RTY, representing small caps, is still lagging like it hit the snooze button.
The Breadth Problem
Healthy rallies need everyone on board. When small caps don’t join the charge, it’s like running a marathon with only one leg — you might move forward, but not for long.
That’s why this gap between the big guys and the small ones is called bearish divergence — momentum without muscle.
How Deep Could It Go?
Under the surface, liquidity pockets (UFO supports) show the “landing zones” below price:
ES: ~5% lower
NQ: ~6% lower
YM: ~9% lower
RTY: ~14% lower (!)
Translation: if the market trips, the generals may bruise a knee — but the soldiers could roll down the hill.
Tick, Margin, and Scale
CME index futures come in two flavors — E-minis for the pros, Micro E-minis for precision control:
S&P 500 (ES/MES): tick 0.25 → $12.50 / $1.25; margin ≈ $21K / $2.1K
Nasdaq 100 (NQ/MNQ): tick 0.25 → $5 / $0.50; margin ≈ $30K / $3K
Dow Jones (YM/MYM): tick 1 → $5 / $0.50; margin ≈ $13K / $1.3K
Russell 2000 (RTY/M2K): tick 0.10 → $5 / $0.50; margin ≈ $9K / $0.9K
(Approximate numbers, educational only.)
The Lesson
Breadth divergences don’t “predict” the end of the rally — they just whisper: “Careful, this parade’s out of sync.”
So before chasing the next breakout, remember:
even the best generals can’t win a war if their soldiers stay in camp.
Want More Depth?
If you’d like to go deeper into the building blocks of trading, check out our From Mystery to Mastery trilogy, three cornerstone articles that complement this one:
🔗 From Mystery to Mastery: Trading Essentials
🔗 From Mystery to Mastery: Futures Explained
🔗 From Mystery to Mastery: Options Explained
When charting futures, the data provided could be delayed. Traders working with the ticker symbols discussed in this idea may prefer to use CME Group real-time data plan on TradingView: www.tradingview.com - This consideration is particularly important for shorter-term traders, whereas it may be less critical for those focused on longer-term trading strategies.
General Disclaimer:
The trade ideas presented herein are solely for illustrative purposes forming a part of a case study intended to demonstrate key principles in risk management within the context of the specific market scenarios discussed. These ideas are not to be interpreted as investment recommendations or financial advice. They do not endorse or promote any specific trading strategies, financial products, or services. The information provided is based on data believed to be reliable; however, its accuracy or completeness cannot be guaranteed. Trading in financial markets involves risks, including the potential loss of principal. Each individual should conduct their own research and consult with professional financial advisors before making any investment decisions. The author or publisher of this content bears no responsibility for any actions taken based on the information provided or for any resultant financial or other losses.
EURUSD Breakdown Looms: Sellers Target 1.1560 Support ZoneHello traders, I want to share my opinion about the current EURUSD setup. After an extended bearish movement, EURUSD continues to trade within a descending channel, clearly defined by a Resistance Line connecting recent lower highs and a Support Line connecting the local lows. This structure outlines the ongoing corrective trend that has been developing over the past weeks. Recently, the price made a moderate bullish correction after rebounding from the Buyer Zone (1.15600–1.15800) — a key demand area where strong buying activity had previously emerged. However, this rebound brought EURUSD back into the Seller Zone, aligning with the upper boundary of the descending channel and the Resistance Level near 1.16600. At this stage, the market is showing early signs of bearish pressure from this confluence area. If sellers continue to hold the upper boundary, a rejection from the Resistance Line would confirm the continuation of the descending trend structure. I expect the price to rotate back down toward the Buyer Zone near 1.15600, which remains the main local support area. A confirmed breakdown below this level could trigger further momentum toward lower support targets, while a strong rebound could indicate the start of a potential accumulation phase. As of now, my scenario favors a short-term bearish continuation from resistance toward the 1.15600 target zone (TP1). Please share this idea with your friends and click Boost 🚀

DXY relative perf. to predict market tops.Using intermarket analysis. During expensive markets, demand for US dollar grows - and often it correlates with stock market tops. Step further - we can use intermarket analysis of DXY/SPX. Look for trend break out and Higher Lows in the structure. ✅

EURGBP Is Looking For A Larger RecoveryEURGBP Is Looking For A Larger Recovery with a complex correction from a technical point of view and by Elliott wave theory.
EURGBP has turned around strongly this year and even broke above the downward channel connected from the 2023 highs. This suggests that wave C has ended at the lower side of a very big triangle, and the pair could still be recovering within subwave D. It may eventually reach the upper side of the pattern around 0.89 within W-X-Y formation, where wave Y can now be in play; ideally it will reach higher prices soon with break out from current triangle.

XAUUSD: Bullish Reversal Setup From Triangle SupportHello everyone, here is my breakdown of the current Gold setup.
Market Analysis
Gold (XAUUSD) continues to trade within a larger bullish market structure, maintaining higher lows above its key ascending Trend Line. After a strong impulsive rally that pushed the price above the 4,200 resistance, the market faced rejection near the top of the Range and entered a corrective phase. This correction evolved into a triangle pattern, with price now testing the Triangle Support Line, aligning closely with the horizontal Support area around 4,020 – 4,000 — a historically important demand zone.
Currently, the price is consolidating near the lower boundary of this structure, showing early signs of stabilization. This region also coincides with the previous breakout point, adding further confluence for potential buyer interest.
My Scenario & Strategy
I expect the price to hold above the Triangle Support Line and form a bullish reversal structure, signaling that buyers are once again defending this level. A confirmed breakout above the Triangle Resistance Line would indicate renewed bullish momentum and a potential continuation of the overall uptrend.
My primary target zone lies around 4,215, where previous resistance and the upper range boundary converge. However, if the support near 4,000 fails to hold, it could trigger a deeper correction toward 3,950, where the next demand zone is located. This setup offers a favorable risk-to-reward opportunity for traders anticipating a rebound from a major technical confluence zone.
That's the setup I'm tracking. Thank you for your attention, and always manage your risk.

Gold Market Update: Correction Mode 3750/3500 USD possible🟡 Where We Are Right now
After ripping to fresh records, gold snapped hard — WSJ logged the steepest one-day loss in years last week and a follow-through weekly drop as longs unwound.
Analysts across Kitco and others frame this as a technical/positioning correction after a parabolic run, with a fight around the $4k handle and scope to probe $3,750 → $3,500 if selling persists.
Sentiment/flows flipped: GLD and other gold ETFs saw notable outflows into the selloff after heavy YTD inflows. That flow reversal is consistent with a near-term correction phase.
🔻 Why the Market Is Correcting Now
1️⃣ Positioning & Froth Unwinds
The rally attracted outsized speculative length; once momentum cracked, forced de-risking kicked in. WSJ called out “long unwind” dynamics; Kitco says the correction could persist for months as near-term drivers fade.
2️⃣ $4k Failed on First Retest; Technical Break Triggered Stops
Kitco flagged a “fight for $4k” with downside risk if that shelf gives. Once sub-4k prints hit, systematic sellers likely accelerated.
3️⃣ Flow Flip in ETFs
After massive 2025 inflows, GLD posted a sharp daily outflow during the drop — classic late-cycle reversal behavior for a momentum move.
4️⃣ Macro Balance Less Supportive at the Margin
Even with long-term tailwinds (deficits/geopolitics), the recent leg higher ran ahead of fundamentals. Kitco and others note easing physical tightness and cooling central-bank buying pace compared with earlier in the year, removing a key prop for spot.
⚙️ Near-Term Levels That Matter (Tactical)
$4,000 → Battle zone. Regaining and holding above turns near-term tone neutral.
$3,750 → First meaningful downside target; aligns with multiple analysts’ “healthy pullback” zone.
$3,500 → Deeper correction magnet if flows/positioning continue to bleed; widely discussed as a plausible washout level.
🔮 4–8 Week Catalyst Map (What Can Push Price)
🏛️ Macro / Policy
Treasury Quarterly Refunding (Nov 5): Mix/size guidance can sway the long-end, USD, and real yields — key for gold. A heavier bill tilt (and steady coupons) is less threatening than a surprise coupon ramp.
Fed Communication Cadence: With the Oct 28–29 FOMC just occurred, watch minutes (Nov 19) + any guidance shifts. A less-dovish tone or firmer real yields = near-term headwind; growth scares or easing bias = support.
US Data Prints: CPI/PCE, NFP, ISM — anything that re-prices the path of real rates. (Direction of real yields remains the single most important macro input.)
💰 Flows & Positioning
ETF Flows (GLD/IAU): Continued outflows would confirm distribution; a turn back to net inflows often leads price inflections.
COT Positioning: If spec length compresses materially, downside fuel diminishes — setting up a cleaner base. (Track weekly CFTC updates.)
🪙 Physical / Seasonal
India Demand (festive/wedding season) and China retail demand can stabilize spot if discounts narrow and premiums re-emerge, but Kitco notes near-term tightness has eased versus the squeeze earlier in the rally.
📈 Base Case Outlook (Next 4–8 Weeks)
Trend: We’re in a bull-market correction — momentum currently with sellers — inside a bigger, intact secular uptrend. WSJ + Kitco both frame it as a technical consolidation after a near-vertical ascent.
Range Expectation: $3,500–$4,100 with whipsaws around $4k. The market likely tests $3,750 and could overshoot to $3,500 on negative macro surprises or persistent outflows before attempting a higher-low base.
Bull Re-acceleration Triggers:
(a) USD/real-yield rollover post-Refunding/Fed minutes
(b) A visible reversal in ETF flows
(c) Stabilization in Asia physical premiums
(d) Fresh geopolitical shocks
Bear Extension Risks:
(a) Firmer real yields / stronger USD
(b) Deeper ETF outflows and CTA/systematic supply
(c) Evidence of slower central-bank demand than H1
(d) Soft physical uptake into dips
⚔️ Trade / Hedge Tactics
If Underweight/Flat:
Stagger bids $3,760 → $3,520, scale size smaller into weakness; insist on confirmation (stops above prior day’s high) before adding.
If Long From Higher:
Respect $3,750 — below it, tighten or partially hedge (short miners, long USD vs. FX beta, or buy short-dated puts) targeting $3,500 as a potential flush.
If Momentum Trader:
Let $4,000 decide regime. Sustained reclaims with rising on-balance volume/ETF creations = green light for a bounce to $4,080–$4,150; failure = fade rallies into $3,950–$3,980.
🧭 What I’m Watching Day-to-Day
1️⃣ Treasury refunding headlines (Nov 5) and term-premium reaction.
2️⃣ Fed minutes (Nov 19) and any shift in balance-of-risks language.
3️⃣ GLD/IAU flow tape (creations/redemptions).
4️⃣ Kitco/WSJ desk color on physical tightness and dealer inventories.

Is Nasdaq Set for a Pullback? | Fibonacci Resistance Zone ahead!In this video I map out the idea of the Nasdaq being over extended and on route to approaching a key Fibonacci resistance level 27000 ,
This may set up a potential correction in the week ahead."
This is a counter-trend setup within a larger uptrend, so risk management is key. I'm not calling a top to the entire rally, but rather a healthy pullback to bring in new buyers."
I demonstrate how i see the price action moving forward over the course of the month ahead with valuable insights.
Tools used in this video Standard Fib , Fib Expansion, Fib extension + Anchored vwap and Volume profile and TPO chart
