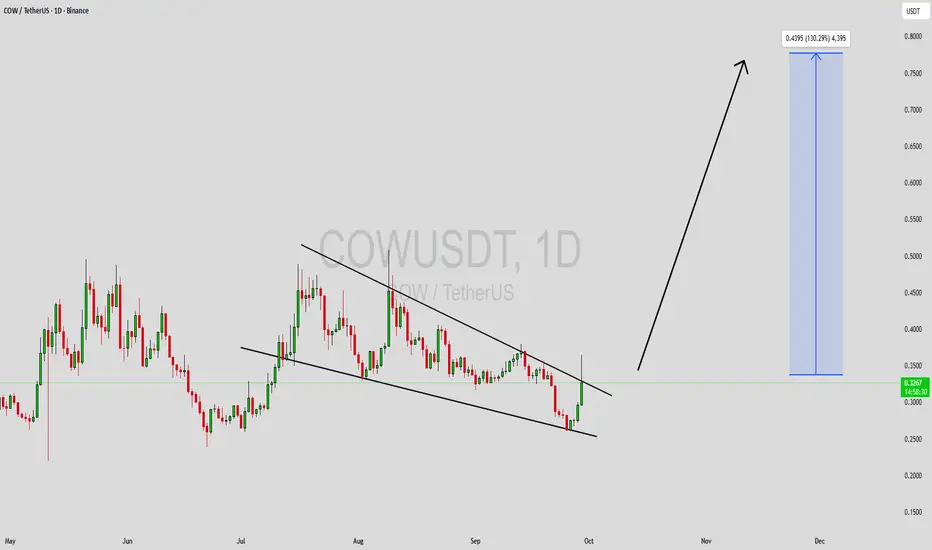
COWUSDT Forming Falling WedgeCOWUSDT is currently forming a falling wedge pattern, a strong bullish reversal setup that often precedes significant upward movements. The price action is consolidating within a narrowing range, which typically signals that momentum is building for a potential breakout. With good trading volume accompanying this structure, the chances of a powerful bullish move are greatly increasing. Based on this setup, the expected gain could range between 90% to 100%+ once the breakout is confirmed.
The falling wedge pattern suggests that selling pressure is weakening while buying interest is gradually increasing. This kind of technical structure often results in sharp rallies as market sentiment shifts in favor of the bulls. Traders closely watching COWUSDT will likely see key resistance levels tested soon, and a breakout could trigger a strong wave of buying activity.
Investors are also showing growing interest in this project, which adds further strength to the bullish outlook. Increased market participation, combined with the strong technical setup, makes COWUSDT an attractive candidate for significant upside potential. As long as volume continues to support the move, this pair could be preparing for a major trend reversal.
✅ Show your support by hitting the like button and
✅ Leaving a comment below! (What is You opinion about this Coin)
Your feedback and engagement keep me inspired to share more insightful market analysis with you!
COW
Long term demand zone is holding nicely on $COW Long term demand zone is holding nicely on TSX:COW 📈
The next move could be explosif! 🚀
Relly bullish FA on the DEX they are building.
Bulls may be in control above 0.300$. .

COW - BULLISH WAVE AWAITED GM team!
Risk reward is insane on TSX:COW 🎯🚀
Confidence, Patience, you know what's coming 🎉

COW - TP2 HITTSX:COW - TP2 ✅
Clean falling wedge H4 breakout & retest ✅📈
We could see a big bull impulse similar as 🚀

COW - Monthly support is holdingTSX:COW looks good here, on the monthly demand zone.
Remember: Bullish above 0.3200$ (long term support).
I expect to see some bull reaction soon 📈

COWUSDT Forming Bullish WaveCOWUSDT is forming a bullish wave pattern, signaling strong upward potential supported by healthy market structure. This pattern often emerges when a crypto asset experiences impulsive rallies followed by corrective pullbacks, creating a wave-like movement that reflects sustained buying pressure. In this case, COWUSDT’s price action suggests the possibility of another strong upward leg as the trend continues to build momentum.
The volume remains consistently good, indicating active participation from traders and growing attention from investors. A bullish wave pattern backed by solid volume is often a sign of institutional interest and strong market conviction. If the current trend holds and breaks above the next key resistance zone, the pair could deliver 80% to 90%+ gains in the near to mid-term.
Market sentiment is leaning bullish, with technical indicators aligning in favor of continued upward momentum. Traders may look for confirmation in the form of a breakout above recent highs, which could trigger accelerated buying and push prices toward new targets. This setup positions COWUSDT as an attractive opportunity for trend-followers and swing traders alike.
✅ Show your support by hitting the like button and
✅ Leaving a comment below! (What is You opinion about this Coin)
Your feedback and engagement keep me inspired to share more insightful market analysis with you!

CoW Protocol About to Enter Bullish Zone (214% Easy Target)'Next target' has 484% profits potential. This target is projected to hit mid-term, that is, within 3 months (90 days)... Boost & keep reading below!
Good afternoon my fellow Cryptocurrency trader, I hope you are having a wonderful week and day.
COWUSDT is about to enter the bullish zone, when the action moves above EMA55. The magenta line on the chart.
This altcoin is already bullish because it is no longer bearish. The low happened 7-April and as you can see, the market has been sideways since early February. 150 days. More than 5 months.
Notice how daily trading volume is almost flat but some days stand out with increased buying. You see green bars shooting up but never red bars. This reveals a bullish bias. We are witnessing the early days before a major bullish breakout. One that will lead to 200% and up to 500% profits mid-term. Long-term, there can be more.
Thank you for reading.
Another easy trade, huge profits, easy chart. Buy and hold.
Namaste.

Trading opportunity for COWUSDTBased on technical factors there is a Sell position in :
📊 COWUSDT
🔴 Sell Now
🪫Stop loss 0.3620
🔋Target 0.1900
📏 R/R 1,2
💸RISK : 1%
We hope it is profitable for you ❤️
Please support our activity with your likes👍 and comments📝

COW Analysis (12H)From the point where the red arrow is placed on the chart, the correction of COW has started. This correction appears to be a symmetrical pattern, and it now seems that we are at the end of wave H.
The green zone is where wave I could potentially end, offering a low-risk area for entry.
Targets are marked on the chart.
A daily candle closing below the invalidation level will invalidate this analysis.
For risk management, please don't forget stop loss and capital management
Comment if you have any questions
Thank You

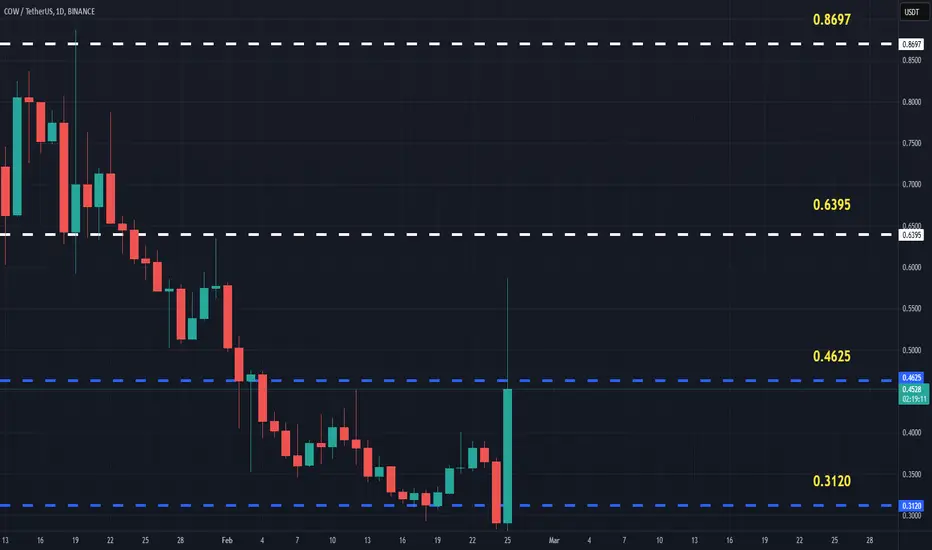
COWUSDT(CoWProtocol) Updated till 25-02-25COWUSDT(CoWProtocol) Daily timeframe range. while many alts today creating new low. it held its local low and had a retrace. 0.4625 is recent resistance confirm close above can push it further. market is unstable but better if it stay above 0.3120.
$COW ANALYSIS! COW is testing the red resistance zone 🟥.
✅ If breakout is successful, the first target is the green line level 🟩

COWUSDT (CoWProtocol) Updated till 20-01-25COWUSDT (CoWProtocol) Daily timeframe range. another alt with fairly new PA and close to price discovery. these kind of alt do offers lots of opportunity as its fresh. it will try for 0.8832 resistance but price action needs to stay above 0.5933 for that.

A new signal to maintain purchasesTo date, we have passed the middle of the month, I want to consider the prospects for the end of the year. The second half of the month opened positively on the air above 3750 and 3850, which gives signals to exit above 4000 in order to test the 4250-4500 range. This is a positive signal for altcoins, and therefore we have seen new growth impulses for coins for the upcoming continuation of the trend. Bitcoin opened the second half of the month above 100k, which reduces the probability of a retest of 75-85k in the near future. However, an opening below 102.5 gives a signal for a flat of about 100k with attempts to go lower. With this picture, it is likely to go to the 110-115k test with a further return to 100k by the end of the year, which will lead to a rollback on the air, even taking into account positive signals.
According to the overall picture, the probability of growth this week prevails as part of the continuation of the trend of the current month and quarter. But from next week until the end of the year, it is worth keeping in mind the likelihood of a new wave of pullback in the market according to the annual schedule, which may continue in January. With such a picture, it is worth being careful about overbought coins with large capitalization. As I wrote earlier, the rollback on such coins, which began at the first market disruption at the beginning of the month, may continue until the end of the year with the transition to active sales in the new year. More interesting are the oversold coins, which continue to turn the annual candle into a bullish one.
New waves of growth on the local market, in particular, can be expected for VIB. Signals have been left for further overshooting and in the event of a breakdown from the third wave of 0.125, the road to the range of 0.15-25 will open. Growth is still going against the entrenched bearish trend on the monthly chart, giving rebounds from key levels and new opportunities for safe earnings without excessive overbought.
A local replay can also show OG TROY AST. According to OG, there are clear signals for a retest of 7.5-9$ at least. The token has quite a lot of liquidity, which provides sharp breakouts.
TROY, along with OG, has signals for further overshooting. In the case of a 0.0075 breakdown, there is a probability of a powerful growth wave for the 0.0125-150 test. At the moment, we are working out the sales momentum of 0.0035, which occurred before the last wave of growth. From 0.035-40 from the third wave, there is already a chance to break above 0.0075. However, with a negative market, there is a probability of a breakdown to 0.0250-275 before the start of growth on the move.
AST has targets at 0.21-25, where it can break through in case of consolidation above 0.15. However, incomplete emission exerts additional pressure, which leads to trend disruptions and increases the likelihood of a breakdown as we approach the end of the year.
This month, there has not yet been a new delisting announcement, which threatens the dynamics of coins with the monitoring tag. If there is no announcement in the next couple of days, I will be looking at new AKRO and VITE purchases in the second half of the week. Also, with them, HARD can give a new impetus. However, the threat of delisting next week is likely to make the growth waves quite short-term.

Probable move over VIBAgainst the background of maintaining purchases this week, there is a fairly high probability of moving over VIB, which has already given 6 waves of 25-70% over the past two months. Trying to grow against the established bearish trend on the monthly chart, technical rollbacks occur from most levels to the base of the previous figure, which gives new and new opportunities for scalping, despite the fact that the token remains in a rather oversold position with a small risk of drawdown. So far, the goal in the case of a calm market is to continue the reversal of the annual candle with an attempt to test the range of 0.15-25.
To date, we are drawing a shadow on a new weekly candle. The main reversal zone is the flat range of 0.0875-950 near the strong formed support level of 0.09. The opening of the month above 0.075 gives a signal for an attempt to consolidate above 0.1. The opening of the second half of the month above 0.09 supports this dynamic.
In an optimistic scenario and in the absence of a deeper pullback on the tops, a reversal and return to the bullish VIB trend is possible today with a reversal of the current daily candle into a bullish one. With less volatility and the closing of a new daily candle above 0.09, a return to the hay is likely within a couple of days. With a reversal today and tomorrow, there is a possibility of returning to the top of growth in the binance, even with a small percentage of price increase, given the low–volatility market. This could lead to a sharp influx of liquidity and a new breakdown, which we observed over the weekend. The new wave can give up to 50-70% growth at least.
With an extremely negative market and disruption of the tops, there is a probability of a deeper retest of 0.075-80. To date, a retest of this range is more likely at the end of the month after the breakout and in the absence of price consolidation above 0.125 or with a rebound from this level from the third wave.
Besides OG and TROY, VIB has the highest goals among coins without a monitoring tag.

Cow/UsdtBINANCE:COWUSDT
🚨 Current Price: 0.3950
If the price holds around 0.3950, we could see it push higher to these levels:
💥 0.4263 – A possible resistance level, where it might face some selling.
💥 0.4600 – If it breaks through 0.4263, it could move up here next.
💥 0.5200 – This is a key level to watch for further upside.
But if the price doesn’t hold 0.3950 and starts to drop, the next support levels to watch are:
⚡ 0.3600 – A solid support level, where the price might bounce back.
⚡ 0.3138 – If it falls through 0.3600, this could be the next stopping point.
📉 Explanation:
If the price stays above 0.3950, it's showing strength, and there’s potential for it to rise toward those target levels.
If it drops below 0.3950, we might see it test those support levels, with 0.3600 and 0.3138 being key areas to watch for a potential bounce.
⚠️ Just sharing my thoughts, not financial advice! Always do your own research before making moves! 📈💡

COWUSDT %400 DAILY VOLUME INCREASE DONT SLEEP!This looks like my latest PEPEUSDT Analysis
We took %17 reaction on the last one, I believe we can take very good reaction from the first blue box and HTF buy zone in case of a crash is lower blue box.
I keep my charts clean and simple because I believe clarity leads to better decisions.
My approach is built on years of experience and a solid track record. I don’t claim to know it all, but I’m confident in my ability to spot high-probability setups.
My Previous Analysis
🐶 DOGEUSDT.P: Next Move
🎨 RENDERUSDT.P: Opportunity of the Month
💎 ETHUSDT.P: Where to Retrace
🟢 BNBUSDT.P: Potential Surge
📊 BTC Dominance: Reaction Zone
🌊 WAVESUSDT.P: Demand Zone Potential
🟣 UNIUSDT.P: Long-Term Trade
🔵 XRPUSDT.P: Entry Zones
🔗 LINKUSDT.P: Follow The River
📈 BTCUSDT.P: Two Key Demand Zones
🟩 POLUSDT: Bullish Momentum
🌟 PENDLEUSDT: Where Opportunity Meets Precision
🔥 BTCUSDT.P: Liquidation of Highly Leveraged Longs
🌊 SOLUSDT.P: SOL's Dip - Your Opportunity
🐸 1000PEPEUSDT.P: Prime Bounce Zone Unlocked
🚀 ETHUSDT.P: Set to Explode - Don't Miss This Game Changer
🤖 IQUSDT: Smart Plan
⚡️ PONDUSDT: A Trade Not Taken Is Better Than a Losing One
💼 STMXUSDT: 2 Buying Areas
🐢 TURBOUSDT: Buy Zones and Buyer Presence

Long live cattleLive cattle went to the eight hour fib and has started to create a bounce. With corn, soy beans, and we even wheat up 2 to 4% today. Live cattle is going to potentially make up that gap in the next few days.

WOLF, IS IT TIME TO JOIN THE WOLF PACK? TRENDS AND PRICE TARGETSBearish price targets are also sell targets for bulls.
Bullish price targets are sell targets for bears.
Basically, price targets are relative to your trade.
If confused, please ask.
Why are we talking about bears with WOLF?
#1 answer
Sharp Downtrends
And support trends trading in a bearish direction.
#2 answer
Gaps to the topside.
#3 answer
RSI still bearish
In an ideal world, price might project something like the guideline I've drawn.
Don't follow this guideline, it is more for me to backtrack and correct errors. On top of that, I create a lot of charts, and to remember what I was seeing on a chart, multiple months in the past can be nearly impossible. However, it is there to show you a one of many potential movements out of these trends, I often draw the most natural movement, which doesn't always align with reality. Instead, focus on trend breaks and price targets.
Earnings on the 24th of FEB.
"Hungry Like the Wolf
Duran Duran
Darken the city, night is a wire
Steam in the subway, earth is afire (do-do-do-do-do-do-do-do-do)
Woman, you want me, give me a sign
And catch my breathing even closer behind (do-do-do-do-do-do-do-do-do)
In touch with the ground
I'm on the hunt, I'm after you
Smell like I sound, I'm lost in a crowd
And I'm hungry like the wolf
Straddle the line in discord and rhyme
I'm on the hunt, I'm after you
Mouth is alive, with juices like wine
And I'm hungry like the wolf
Stalked in the forest, too close to hide
I'll be upon you by the moonlight side (do-do-do-do-do-do-do-do-do)
High blood drumming on your skin, it's so tight
You feel my heat, I'm just a moment behind (do-do-do-do-do-do-do-do-do)
In touch with the ground
I'm on the hunt I'm after you
A scent and a sound, I'm lost and I'm found
And I'm hungry like the wolf
Strut on a line, it's discord and rhyme
I howl and I whine, I'm after you
Mouth is alive, all running inside
And I'm hungry like the wolf
Hungry like the wolf
Hungry like the wolf
Hungry like the wolf
Burning the ground, I break from the crowd
I'm on the hunt, I'm after you
I smell like I sound, I'm lost and I'm found
And I'm hungry like the wolf
Strut on a line, it's discord and rhyme
I'm on the hunt, I'm after you
Mouth is alive, with juices like wine
And I'm hungry like the wolf
Burning the ground, I break from the crowd
I'm on the hunt, I'm after you
Scent and a sound, I'm lost and I'm found
And I'm hungry like the wolf
Strut on a line, it's discord and rhyme
I'm on the hunt, I'm after you
Mouth is alive all running inside
Songwriters: John Taylor, Simon Le Bon, Nick Rhodes, Andy Taylor, Roger Taylor. For non-commercial use only."

CowSwap COW - Reload Price rangesJust setting this up as a reminding to build my position.
Start DCA at prices below 0.15
DCA harder anything below 0.10
Deploy all capital for anything below 0.075
Bold strategy cotton, lets see if it pays off for him.

Live Cattle Drift LowerCattle Summary
Daily Cutout Values
Choice: 258.34, Down 1.45 from the previous day.
Select: 237.74, Down 1.94 from the previous day.
Choice/Select Spread: 20.60
5 Area Average Cattle Price
Live Steer: 144.85
Live Heifer:145.00
Dressed Steer: 229.85
Dressed Heifer: 229.80
Daily Slaughter
Estimated at 125,000 head, 1,000 more than last week and 6,000more than the same week last year.
Feeder Cattle Index
8/30/2022: 183.04
8/29/2022: 183.00
Technical Snapshot
Live Cattle
October live cattle broke lower yesterday, taking out the previous day's low, making its way closer to the cluster of major moving averages, which we've listed as near-term downside target for some time now. If the market is unable to defend this support pocket, it's possible that we see the selling accelerate. We are keeping a very close eye on outside markets as they remain volatile and seemingly uneasy.
Resistance: 145.10-145.975***, 147.35-147.50**
Pivot: 143.25-143.775
Support: 141.75-142.10****, 138.025-138.35****
Futures trading involves substantial risk of loss and may not be suitable for all investors. Trading advice is based on information taken from trade and statistical services and other sources Blue Line Futures, LLC believes are reliable. We do not guarantee that such information is accurate or complete and it should not be relied upon as such. Trading advice reflects our good faith judgment at a specific time and is subject to change without notice. There is no guarantee that the advice we give will result in profitable trades. All trading decisions will be made by the account holder. Past performance is not necessarily indicative of future results.

Live Cattle Shrug Off Outside Market WeaknessCattle Summary
Daily Cutout Values
Choice: 259.79, Down 3.25 from the previous day.
Select: 239.68, Down 3.07 from the previous day.
Choice/Select Spread: 20.11
5 Area Average Cattle Price
Live Steer: 144.00
Live Heifer: N/A
Dressed Steer: N/A
Dressed Heifer: N/A
Daily Slaughter
Estimated at 126,000. Unchanged from last week and 6,000 more than the same week last year.
Feeder Cattle Index
8/29/2022: 183.00
8/26/2022: 183.16
Technical Snapshot
Live Cattle
October live cattle futures were able to break the 4-day streak of lower prices, on a day when the outside markets saw meaningful pressure. If you're bullish the market, this is your silver lining. The market finished the session right near the upper end of our pivot pocket, 143.25-143.775. If the Bulls can keep yesterday's momentum alive, perhaps we see a retest of 145.10-145.975. We are in the camp that the cash market may stall out, which could limit the upside. We are monitoring outside markets and commodities as a whole, if they continue to trend lower, it will be an uphill climb for live cattle. We are still in the camp that the three major moving averages could be tested in the near term.
Resistance: 145.10-145.975***, 147.35-147.50**
Pivot: 143.25-143.775
Support: 141.75-142.10****, 138.025-138.35****
Futures trading involves substantial risk of loss and may not be suitable for all investors. Trading advice is based on information taken from trade and statistical services and other sources Blue Line Futures, LLC believes are reliable. We do not guarantee that such information is accurate or complete and it should not be relied upon as such. Trading advice reflects our good faith judgment at a specific time and is subject to change without notice. There is no guarantee that the advice we give will result in profitable trades. All trading decisions will be made by the account holder. Past performance is not necessarily indicative of future results.

Cattle Futures Finished Lower Yesterday. More of the Same TodayCattle Summary
Daily Cutout Values
Choice: 264.46, Up 1.09 from the previous day.
Select: 239.72, Up .13 from the previous day.
Choice/Select Spread: 24.74
5 Area Average Cattle Price
Live Steer: 144.39
Live Heifer: 143.70
Dressed Steer: 229.93
Dressed Heifer: 229.86
Daily Slaughter
Estimated at 124,000. 5,000 more than last week and 6,000 more than the same week last year.
Feeder Cattle Index
8/12/2022: 179.04
8/11/2022: 178.28
Technical Snapshot
Live Cattle
October live cattle held well early in the session but gave up ground as the day continued. The Pullback brought prices back into our pivot pocket from 142.75-143.75. In yesterday’s report we noted that “The Bulls have the technical advantage until we see a breakdown back below this pocket.”. A failure to defend this level in today’s session could lead to a retest of trendline support and three major moving averages. All of these indicators come in from 141.35-141.90. With so many indicators converging in one pocket, we are labeling this as a MUST HOLD level.
Resistance: 145.10-145.975****, 147.35-147.50**
Pivot: 142.75-143.75
Support: 141.35-141.90****, 138.025-138.35****
Futures trading involves substantial risk of loss and may not be suitable for all investors. Trading advice is based on information taken from trade and statistical services and other sources Blue Line Futures, LLC believes are reliable. We do not guarantee that such information is accurate or complete and it should not be relied upon as such. Trading advice reflects our good faith judgment at a specific time and is subject to change without notice. There is no guarantee that the advice we give will result in profitable trades. All trading decisions will be made by the account holder. Past performance is not necessarily indicative of future results.

Cattle Futures are on the MOOOveCattle
Daily Cutout Values
Choice: 263.23, Down 1.50 from the previous day.
Select: 237.08 Down .62 from the previous day.
Choice/Select Spread: 26.15
5 Area Average Cattle Price
Live Steer: 146.00
Live Heifer: 139.15
Dressed Steer: 231.87
Dressed Heifer: N/A
Daily Slaughter is estimated at 126,000. 2,000 more than last week and 8,000 more than the same week last year.
Weekly Export Sales
Beef: Net sales of 14,600 MT for 2022 were up 22 percent from the previous week, but down 17 percent from the prior 4-week average.
Technical Snapshot
Live Cattle
October live cattle recovered all of the losses from the previous session and then some, achieving their highest daily close since the month of May. If the Bulls are able to defend support and mark higher lows, then the April gap is still in-play, 145.10-145.975.
Resistance: 145.10-145.975****, 147.35-147.50**
Pivot: 142.75-143.75
Support: 141.425-141.90***, 138.025-138.35****
Futures trading involves substantial risk of loss and may not be suitable for all investors. Trading advice is based on information taken from trade and statistical services and other sources Blue Line Futures, LLC believes are reliable. We do not guarantee that such information is accurate or complete and it should not be relied upon as such. Trading advice reflects our good faith judgment at a specific time and is subject to change without notice. There is no guarantee that the advice we give will result in profitable trades. All trading decisions will be made by the account holder. Past performance is not necessarily indicative of future results.
