$EUIRYY - E.U CPI (December/2025) ECONOMICS:EUIRYY
December/2025
source: EUROSTAT
- Euro area consumer price inflation eased to 2.0% in December 2025, down from 2.1% in November, according to a preliminary estimate.
This marks the lowest rate since August, returning to the ECB’s midpoint target and reinforcing expectations that interest rates are likely to remain steady for the foreseeable future.
Core inflation, which excludes energy, food, alcohol, and tobacco, fell to 2.3%, the lowest in four months and just below expectations of 2.4%.
Among Europe’s largest economies, HICP rates eased in Germany (2.0% vs. 2.6%),
France (0.7% vs. 0.8%), and Spain (3.0% vs. 3.2%), while Italy bucked the trend with harmonized inflation rising slightly to 1.2% from 1.1%.
CPI

EURUSD BULLSBased on this chart we can see a formation of bullish trend 1HR, 4HR time frames. Earlier we experienced lower than expected CPI, confirming the Fed dot plot which favored one rate cut in 2026. Tomorrow we will have the US GDP which is expected to decline, so any lower than expected forecast will mean continuation of the bullish trend. Traders should expect the market to follow the technical structure given that we already expect thanksgiving towards the close of the week and new year coming up next week. Any sells will need strong convincing. As I close my analysis but I hope to do another one before the year ends and if not, I want to wish everyone that has been with me through the year a merry Christmas and a happy new year.

GOLD | CPI Volatility Incoming — Watching 4314 & 4291GOLD (XAUUSD) | Short Technical Overview
Gold is currently trading around the 4314 pivot line, showing a consolidation pattern after failing to break the 4347 resistance zone.
The chart indicates two possible paths: a short bullish correction back toward 4340–4347, or a continuation of the bearish move toward the 4291 support if the pivot breaks.
Today’s U.S. CPI is expected to be released above 3.00%, which typically strengthens the USD and pressures Gold downward.
If CPI comes in higher, Gold may drop toward 4291, and a break below it could open the way toward deeper support levels.
Key Levels:
Pivot: 4314
Resistance: 4334 → 4347
Support: 4303 → 4291 → 4267

USOIL (WTI) | Moving Downtrend...USOIL | Technical Overview🕯
Bearish Setup:
USOIL continues to show bearish momentum as long as the price trades below 56.40 and 56.05, maintaining pressure toward the next target at 54.38.
Bullish Setup:
To shift into a bullish structure, the market must close a 4H candle above 56.40, which would support an upside move toward 57.40.
Key Levels
Pivot Zone: 56.00 – 56.40
Support: 55.00, 54.40
Resistance: 56.90, 57.40
Timeframe: 4H | Bias: Bearish Volatility | Current Price: 56.00
previous idea:

GBPUSD | Bearish Structure Below 1.3372 Ahead of CPIGBPUSD | Technical Overview
The price has stabilized below the pivot level at 1.3372, which maintains a bearish outlook for the pair.
As long as GBPUSD trades under this level, the market is expected to move toward 1.3295, and a break below this zone may extend the decline toward 1.3232.
A 4H candle close above 1.3410 is required to reverse the current structure and activate a bullish momentum toward 1.3445.
Today’s U.S. CPI release will significantly impact market direction and volatility.
Pivot Line: 1.3372
Support: 1.3295, 1.3232
Resistance: 1.3410, 1.3445
Timeframe: 4H
Bias: Bearish while below 1.3372

GBP/EUR Outlook: Sterling Plunges on Inflation MissMarket Volatility and Economic Shifts
The British Pound (GBP) crashed violently on Wednesday. Markets reacted instantly to the UK’s surprising inflation data. Headline inflation dropped to 3.2% in November. This figure missed the 3.5% forecast significantly. Core inflation also fell to 3.2%, signaling deep economic cooling. Traders immediately bet on a Bank of England (BoE) rate cut. The sudden drop reshapes the short-term currency landscape completely.
Geostrategy and Monetary Divergence
A clear strategic gap now exists between European powers. The BoE must prioritize growth, forcing a dovish pivot. Officials will likely cut rates to stabilize the economy. In contrast, the European Central Bank (ECB) holds firm. ECB President Lagarde maintains a strict, neutral policy stance. This divergence draws global capital away from London. Investors now favor the stability of the Eurozone.
High-Tech Trading and Cyber Impact
Modern currency moves often stem from automated systems. High-frequency trading algorithms executed massive sell orders on Wednesday. These bots react to data variances in milliseconds. The inflation "miss" triggered pre-programmed selling cascades. This cyber-driven volatility punishes currencies instantly. Human traders struggle to match this algorithmic speed. Such technological dominance defines current market liquidity.
Business Models and Industry Trends
Currency devaluation impacts UK corporate strategy deeply. Importers face immediate cost spikes, squeezing profit margins. Management teams must renegotiate supply chain contracts quickly. Conversely, the high-tech export sector gains a competitive edge. Cheaper Sterling makes UK innovation more attractive abroad. This shift rewards companies with agile, export-oriented business models.
Innovation and Patent Analysis
A lower exchange rate can stimulate scientific investment. UK firms often rely on foreign capital for R&D. A cheaper Pound makes UK assets and patents attractive targets. Foreign investors may acquire undervalued British intellectual property. This trend could accelerate cross-border mergers in biotech and science. However, retaining top talent becomes harder with a weaker currency.
Forecast: The Policy Path Ahead
Attention now locks onto the BoE’s forward guidance. Investors demand a clear roadmap for 2026 interest rates. A confirmed dovish stance will drive Sterling lower. Meanwhile, the Euro stands resilient despite mixed German data. The policy gap between the UK and the EU is widening. This structural divergence points to further GBP/EUR downside.

XAUUSD is ranging before CPI direction comes after the newsGold is currently consolidating sideways near the upper zone around 434x as the market awaits inflation data and updates from the BOJ. Short-term volatility may occur, but the overall structure remains intact, with no clear breakout signal seen in the previous session.
Before the news, the preferred strategy is to trade within the range. Traders can look for reaction setups when price approaches 4346–4348, with a mandatory stop-loss, as this area has been tested multiple times.
After the news is released, the market is expected to choose a new direction. If price breaks and holds firmly above the 435x zone, the bullish trend will be confirmed. In that case, the focus shifts to buying the breakout, with targets toward the previous high and potentially a new ATH.
👉 Before the news: trade the range – react at key levels.
👉 After the news: wait for confirmation – follow the trend.

$GBIRYY - U.K CPI (November/2025) ECONOMICS:GBIRYY 3.2%
November/2025 (-0.4%)
source: Office for National Statistics
- The annual inflation rate in the UK slowed to 3.2% in November,
the lowest in eight months, compared to 3.6% in October and forecasts of 3.5%.
The figure is also lower than the BoE's prediction of 3.4%, led by a slowdown in food and non-alcoholic beverages.

4 Biggest trading opportunities this week This week presents several key events traders should keep a close eye on:
Korean inflation – Monday 6pm
The last reading for SK CPI came in at +2.4% year‑on‑year in October 2025, above the 2.1% expected by economists. Another surprise uptick might reinforce expectations of a rate pause (or even a re‑tightening), which could boost KRW.
Euro inflation – Tuesday 5am
Inflation data out of the eurozone will shape expectations for the European Central Bank (ECB). If inflation remains sticky or rises, it could bolster ECB hawkishness, strengthening EUR and European bond yields.
Australian GDP Growth – Tuesday 7.30am
Australia’s GDP report will offer a snapshot of the local economic picture. A strong GDP print could support the Australian dollar and lift demand for commodity‑linked assets, given Australia’s status as a major commodity exporter.
US PCE – Friday 10am
The upcoming release of the Personal Consumption Expenditures Price Index (PCE) matters because the Fed views it as its preferred inflation gauge. A hotter‑than‑expected PCE could reaffirm caution on rate cuts and lift USD, bond yields, and potentially weigh on risk assets.

$GBIRYY -U.K Inflation Rate (October/2025)ECONOMICS:GBIRYY 3.6%
October/2025
source: Office for National Statistics
- The UK’s annual inflation rate eased to 3.6% in October,
its lowest in four months, down from 3.8% in each of the previous three months.
The figure matched expectations from both the Bank of England and market analysts,
supported by a slowdown in gas and electricity prices.

BTC Range Grind: Floors to Harvest, 103.5k Cap__________________________________________________________________________________
Market Overview
__________________________________________________________________________________
Bulls defend a mid-range after a corrective leg, with price trapped under 103,500–105,000 supply and resting atop 101,700–100,400 HTF floors. Momentum is mixed intraday but the higher-timeframe trend still leans up.
Momentum: Slightly bearish intraday within an HTF uptrend; range behavior below 103,500–105,000.
Key levels:
- Resistances (HTF): 103,500 (pivot high); 104,800–105,000 (supply shelf); 106,400–106,900 (upper supply).
- Supports (HTF): 101,700 (1D floor); 100,400 (12H floor); 98,400–99,100 (multi‑TF demand cluster).
Volumes: Mostly normal; occasional moderate spikes on 1H/30m around tests of 101,700 and 103,100–103,600.
Multi-timeframe signals: 1D/12H Up; 6H/4H/2H/1H Down. This favors buying confirmed dips into 101,700/100,400 while avoiding chases into 103,500–105,000 unless reclaimed on strength.
Harvest zones: 100,400 (Cluster A) / 98,400–99,100 (Cluster B). These are ideal dip-buy zones for inverse pyramiding with confirmation.
Risk On / Risk Off Indicator context: NEUTRE VENTE (risk-off tilt). It tempers long conviction and asks for confirmation, aligning with the intraday pullback despite the HTF up-bias.
__________________________________________________________________________________
Trading Playbook
__________________________________________________________________________________
The dominant structure is a range inside an HTF uptrend; adopt a buy‑the‑dip stance at HTF floors with strict confirmations and reduced size given a risk-off backdrop.
Global bias: Neutral Buy while above 100,400–101,700; key invalidation = sustained 12H close below 100,400.
Opportunities:
- Buy the dip: Confirmed 2H/4H reversal at 101,700 or 100,400 toward 103,500.
- Breakout buy: Reclaim and hold above 103,500 on 1H/2H opens 104,800–105,000.
- Tactical sell: Clean rejection at 103,500–105,000 if 2H/4H trend remains Down and breadth weak.
Risk zones / invalidations: A 12H close below 100,400 would invalidate the dip-bid and expose the 98,400–99,100 cluster; acceptance below 100k risks a deeper slide.
Macro catalysts (Twitter, Perplexity, news):
- US government reopening vote may unlock risk appetite short term.
- Fed tone: cuts discussed; reserves near “ample” and QT wind‑down—liquidity supportive but lumpy.
- CPI print can flip the tone and break the 103,500/100,400 range.
Harvest Plan (Inverse Pyramid):
- Palier 1 (12.5%): 100,400 (Cluster A) + reversal ≥2H → entry
- Palier 2 (+12.5%): 96,400–94,400 (-4/-6% below Palier 1) → reinforcement
- TP: 50% at +12–18% from PMP → recycle cash
- Runner: hold if break & hold first R HTF (103,500)
- Invalidation: < HTF Pivot Low 100,400 or 96h no momentum
- Hedge (1x): Short first R HTF (103,500) on rejection + bearish trend → neutralize below R
__________________________________________________________________________________
Multi-Timeframe Insights
__________________________________________________________________________________
Across timeframes, HTF structure remains constructive while intraday trends lean lower, creating buy-the-dip opportunities into defined floors.
1D/12H: Uptrend intact; price capped by 103,500–105,000 supply with key demand at 101,700 and 100,400. A daily/12H bullish close off these floors keeps the path open to 103,500 then 104,800–105,000.
6H/4H/2H: Down within range; prefer long confirmations at 101,700/100,400; short bounces only if sell volume expands and 2H/4H momentum stays Down.
1H/30m/15m: Micro down-to-sideways; frequent wicks under 103,100–103,600. Use only as execution layers aligned with HTF signals.
Major confluence: Strong overlap of HTF floors at 100,400–101,700 versus a persistent supply cap at 103,500–105,000; macro risk-off explains the intraday pressure despite HTF Up.
__________________________________________________________________________________
Macro & On-Chain Drivers
__________________________________________________________________________________
Macro liquidity is tentatively supportive, but the current risk regime is cautious; together they favor selective dip-buys rather than break-chasing.
Macro events: A potential US government reopening, dovish-leaning Fed messaging (cuts discussed; reserves near “ample”; QT wind‑down), and CPI as a near-term risk event that can swing risk appetite.
Bitcoin analysis: Price hovering above 100k with signs of seller fatigue; a large short-liquidity pocket is noted above, implying squeeze potential if spot bids return and 103,500 is reclaimed.
On-chain data: Stablecoin mints (USDC/PYUSD) point to improving on-chain dollar liquidity; range bias near ~100k with dense supply 106k–118k supports the current capped-range picture.
Expected impact: While HTF structure supports buying confirmed dips, the risk-off regime argues for patience and confirmation; a reclaim of 103,500 could quickly target 104,800–105,000, with squeeze risk if flows improve.
__________________________________________________________________________________
Key Takeaways
__________________________________________________________________________________
BTC is in a range beneath 103,500–105,000 while HTF demand at 101,700/100,400 continues to attract bids.
- Trend: Neutral within an HTF uptrend; intraday pressure persists under supply.
- Setup: Primary is a confirmed dip-buy at 101,700 or 100,400, with a secondary breakout buy on strong hold above 103,500.
- Macro: Dovish Fed tone and a potential US reopening help, but CPI and a risk-off regime demand discipline.
Stay patient at floors, avoid chasing into supply, and let confirmation do the heavy lifting—just like timing a boss window in a tough raid.

BTC Playbook: Buy Floors, Fade 104k Until Confirmed__________________________________________________________________________________
Market Overview
__________________________________________________________________________________
Bitcoin faded from 104k and is cycling back into layered demand near 100.4k, with higher timeframes still constructive while intraday pressure and a risk‑off overlay dominate.
Momentum: Range with downside skew after a sharp 104k rejection and tests of 100,409 and the 99k pocket.
Key levels:
- Resistances (HTF): 102,900–103,300; 103,900–104,050; 105,600–106,000
- Supports (HTF): 100,409; 99,490; 98,760–98,944
Volumes: Very high on intraday (30m–2H); normal on 1D.
Multi-timeframe signals: 1D/12H Up; 6H/4H/2H/1H Down. HTF structure stays constructive, but LTF pressure and the risk‑off overlay cap bounces into 104k–106k.
Harvest zones: 100,400 (Cluster A) / 98,800–98,900 (Cluster B) — ideal dip‑buying areas for inverse pyramiding with confirmation.
Risk On / Risk Off Indicator context: Neutral sell bias; it currently contradicts the HTF Up filter, so treat bounces as tactical until it flips.
__________________________________________________________________________________
Trading Playbook
__________________________________________________________________________________
The dominant posture is tactical: buy confirmed dips into floors and fade weak tests of overhead supply while the macro overlay stays risk‑off.
Global bias: Cautious long into floors while HTF trend is Up; invalidate the dip‑buy thesis on sustained closes below 98,760.
Opportunities:
- Buy: Reactive long at 100,409 or 99,490–98,760/98,944 on a ≥2H bullish close; targets 102,000 then 104,045; risk below the engaged floor.
- Breakout: Acceptance above 104,045 with rising volume → add toward 105,600–106,000.
- Tactical sell: Fade 103,900–104,050 or 105,600–106,000 if rejected and Risk On / Risk Off stays neutral‑sell.
Risk zones / invalidations: Loss and acceptance below 99,490 opens 98,760; daily acceptance below 98,760 invalidates dip‑buying until reclaimed. Acceptance above 106,000 invalidates shorts.
Macro catalysts (Twitter, Perplexity, news): Fed liquidity rhetoric turning supportive; CPI/UST auctions can swing risk; geopolitical overhang keeps the risk tone fragile. Strong daily ETF inflows recently help spot demand but need persistence.
Harvest Plan (Inverse Pyramid):
- Palier 1 (12.5%): 100,400 (Cluster A) + reversal ≥2H → entry
- Palier 2 (+12.5%): 96,400–94,400 (-4/-6% below Palier 1) → reinforcement
- TP: 50% at +12–18% from PMP → recycle cash
- Runner: hold if break & hold first R HTF (103,900–104,050)
- Invalidation: < HTF Pivot Low 99,800 or 96h no momentum
- Hedge (1x): Short first R HTF on rejection + bearish trend → neutralize below R
__________________________________________________________________________________
Multi-Timeframe Insights
__________________________________________________________________________________
Overall, HTF remains constructive while LTFs are in a corrective downswing pressing demand steps.
1D/12H: Uptrend filter intact; price rotating back into 100,409 and the 99k ladder; acceptance back above 104,045 would re‑open 105,600–106,000.
6H/4H: Down within HTF Up; clean lower‑highs from 105k with buyers defending 99,490 and the 98,760–98,944 cluster; look for reversal signals there.
2H/1H/30m/15m: Down with very high sell volume; squeezes likely if 100,409 is reclaimed swiftly; failure risks a stop‑run into 99,490 → 98,8k.
Major confluence: Tight demand at 98,760–98,944 aligns with aggregate value; 100,409 is the line‑in‑the‑sand; 104,045 is the primary trigger above.
__________________________________________________________________________________
Macro & On-Chain Drivers
__________________________________________________________________________________
Macro liquidity tone is turning supportive, but near‑term event risk and a risk‑off equity regime keep the overlay defensive.
Macro events: Fed officials flagged reserves nearing “ample” and a technical easing bias; CPI and UST auctions can jolt risk; geopolitics maintains a risk premium.
Bitcoin analysis: Strongest daily US spot ETF net inflows in a month aided spot demand, while a derivatives long flush reset froth; 104k is the overhead decision zone; 100,409 and 99k are key defenses.
On-chain data: Short‑Term Holder stress and seller‑exhaustion reads favor reflex bounces near 100k; structurally, a durable reclaim above prior highs remains unconfirmed.
Expected impact: If ETF flows persist and CPI doesn’t shock, acceptance above 104,045 tilts the path toward 105,600–106,000; if 100,409 fails, a run into 99,490 → 98,8k is likely before stronger dip‑bids.
__________________________________________________________________________________
Key Takeaways
__________________________________________________________________________________
BTC is rotating within a range under 104k, pressing two‑step demand around 100.4k and 99k.
- Trend: Neutral with downside pressure while Risk On / Risk Off stays neutral‑sell.
- Setup: Buy confirmed dips at 100,409 and 99,490–98,760/98,944; add on 104,045 acceptance.
- Macro: Fed liquidity tone helps, but CPI and geopolitics can flip the tape quickly.
Stay patient, define risk at the floors, and let the market hand you the next move rather than forcing one.

$CNIRYY -China CPI (October/2025)ECONOMICS:CNIRYY +0.2%
October/2025
source: National Bureau of Statistics of China
-China’s consumer prices rose 0.2% yoy in October 2025,
defying expectations for no change and rebounding from a 0.3% decline in the prior month.
It was the first increase in consumer inflation since June and the fastest pace since January.
Non-food inflation accelerated (0.9% vs 0.7% in September), lifted by the expansion of consumer trade-in programs and increased holiday spending during the Golden Week, both of which helped boost domestic demand.
Prices continued to grow for housing (0.1% vs 0.1%), clothing (1.7% vs 1.7%), healthcare (1.4% vs 1.1%), and education (0.9% vs 0.8%).
Meantime, transport costs fell at a slower pace (-1.5% vs -2.0%). On the food side, prices logged the smallest decline in three months (-2.9% vs -4.4%).
Core inflation, which excludes food and energy, rose 1.2% yoy, the highest in 20 months, after September's 1.0% growth. On a monthly basis, consumer prices also increased 0.2%, following a 0.1% gain in September, reaching the highest level in three months. source: National Bureau of Statistics of China

BTC Rebound Into HTF Supply: Harvest Zones Mapped__________________________________________________________________________________
Market Overview
__________________________________________________________________________________
Bitcoin is rebounding from last week’s drawdown but is pressing directly into stacked higher-timeframe supply. Structure remains mixed: short-term strength versus a 12H downtrend and a neutral-sell macro backdrop.
Momentum: Cautious rebound within a broader mixed trend; rallies face HTF supply near 106,900–107,300.
Key levels:
- Resistances (HTF): 106,900–107,300; 108,700–109,700; 110,400–111,700
- Supports (HTF/LTF): 105,200–105,600 (tactical); 100,100–100,400 (2H/12H floors); 99,150–99,280 (4H/6H cluster)
Volumes: Overall normal to moderate; notable spikes occurred on lower timeframes during the reversal.
Multi-timeframe signals: 1D up, 12H down; 6H/4H/2H down; 1H/30m/15m up. Short-term momentum is improving but runs into HTF pivot-high bands.
Harvest zones: 100,200 (Cluster A) / 99,100–99,300 (Cluster B) — ideal dip-buy zones for inverse pyramiding if momentum confirms.
Risk On / Risk Off Indicator context: NEUTRE VENTE; it tempers the rebound and argues for selectivity and confirmation before longs.
__________________________________________________________________________________
Trading Playbook
__________________________________________________________________________________
The dominant context is a corrective rebound into resistance; adopt a patient, confirmation-first stance.
Global bias: Neutral sell while below 106,900–107,300; invalidation if price reclaims and holds above 107,300 on a 4H–1D basis.
Opportunities:
- Buy-the-dip: 100,100–100,400 with ≥2H bullish reversal; scale only on improving 12H momentum.
- Breakout buy: 4H close and retest-hold above 107,300 opens 108,700–109,700.
- Tactical sell: Fade 106,900–107,300 rejection (2H–4H confirmation), targeting 105,600 then 104,800–105,000.
Risk zones / invalidations:
- Break below 100,100 would invalidate the shallow-dip long and open a test of ~99,200.
- Sustained closes below ~99,100 risk a larger leg down and shift bias bearish.
Macro catalysts (Twitter, Perplexity, news):
- US CPI print and UST 10Y/30Y auctions may move yields and crypto liquidity.
- Government shutdown resolution headlines improved risk appetite, but durability is unproven.
- Fed cut 25bp with QT set to end Dec 1; guidance remains cautious.
Harvest Plan (Inverse Pyramid):
- Palier 1 (12.5%): 100,200 (Cluster A) + reversal ≥2H → entry
- Palier 2 (+12.5%): 94,200–96,200 (-6%/-4% below Palier 1)
- TP: 50% at +12–18% from PMP → recycle cash
- Runner: hold if break & hold first R HTF (106,900–107,300)
- Invalidation: < HTF Pivot Low (not provided) or 96h no momentum
- Hedge (1x): Short first R HTF on rejection + bearish trend → neutralize below R
__________________________________________________________________________________
Multi-Timeframe Insights
__________________________________________________________________________________
Higher timeframes are mixed but lean down on 12H, while intraday frames have turned up into overhead supply.
1D: Uptrend attempt, but price is still below key pivot-high bands; needs a clean reclaim above 107,300 to unlock higher liquidity.
12H/6H/4H/2H: Down or corrective; rallies into 106,900–107,300 and 108,700–109,700 require proof. 100,100–100,400 is the prime reaction zone; 99,150–99,280 is the deeper defense.
1H/30m/15m: Up and constructive, forming higher lows into resistance; best risk-reward comes from confirmed dips, not late chases into supply.
Major confluence: Tight HTF demand clusters at 100–99k align with the neutral-sell macro regime, reinforcing patience and precision.
__________________________________________________________________________________
Macro & On-Chain Drivers
__________________________________________________________________________________
Macro is balanced-to-cautious and can swing intraday liquidity, while on-chain remains defensive.
Macro events: CPI and UST auctions are near-term volatility catalysts; shutdown resolution headlines boosted risk appetite; the Fed’s 25bp cut with QT ending Dec 1 keeps policy in a “modestly easier but cautious” lane.
Bitcoin analysis: Reclaimed above 105k with key resistance 110–111k; largest overhead liquidity at 112–117k leaves squeeze potential if reclaimed; below, the CME gap near 104,160 is a magnet on weakness.
On-chain data: Price below STH cost basis with continued LTH distribution and defensive options skew — a fragile equilibrium needing a firm reclaim above 112–113k for validation.
Expected impact: Until 107,300+ is reclaimed, macro/on-chain caution aligns with a conservative, buy-the-dip-or-breakout approach; upside fuel exists above 110–111k if catalysts cooperate.
__________________________________________________________________________________
Key Takeaways
__________________________________________________________________________________
BTC is attempting a rebound into heavy resistance with a neutral-sell macro tone.
- Trend: Neutral with a bearish lean on 12H; short-term uptrends are pressing into HTF supply.
- Best setup: Confirmed dip-buys at 100,100–100,400, or a 4H reclaim/hold above 107,300 for a squeeze toward 108,700–109,700.
- Macro factor: CPI and UST auctions may drive liquidity and mark-to-market risk.
Stay disciplined: wait for the signal at the floors or the clean reclaim above resistance — don’t get caught mid-raid in the fog.

Senate ready to end GOV shutdown? Traders eye CPI comeback BREAKING: Senate Democrats are potentially ready to support a package of spending bills and a short-term funding measure, meaning that the longest government shutdown in history could soon come to an end.
If the shutdown ends, the upcoming Consumer Price Index (CPI) release will be a key data point for markets. However, the shutdown has already disrupted data collection. Federal agencies such as the Bureau of Labor Statistics (BLS) have scaled back or suspended operations, meaning parts of the inflation data may be delayed or less accurate than usual.
In the near term, markets are expected to react first to the relief of the shutdown ending, with attention shifting to the inflation figures once normal operations resume. Traders should consider the risk of a less reliable CPI print due to these disruptions and adjust exposure accordingly.

EJ Makes Massive Descent, Could Further Falls Come?Here is OANDA:EURJPY on the 4Hr Chart and after making a new Higher High @ 178.818, has created a Lower Low @ 176.098, surpassing the most recent Higher Low @ 176.629.
This is a Break in Trend and we should suspect price to fall further on EJ if price can:
- Confirm Trend Change by printing a Lower High
Now on the chart, based on the Lower Low, the Fibonacci Tool lays out a couple favorable areas
First, being the last Higher Low @ 176.629 which lays right below the 23.6% Retracement level @ 176.740.
Secondly, the 50% Retracement Level @ 177.458 where there was Consolidation before the decline in price.
*This deep of a pullback could threaten the Bearish momentum built up from the break down and creating the Lower Low.
Fundamentally, the Yen seen a rise in strength after a couple key things happened:
- BOJ held Interest Rates unchanged @ .5%
- Toyko CPI numbers came out hotter than expected with a Forecast of a .1% increase to 2.6% with Actual coming in at 2.8%, a .3% increase!
*This gives the BOJ to hike rates to help with inflation taking off too hot and this could very well strengthen the Yen more!

AUDUSD Eyes 0.6500 as Softer CPI and Weak Jobs Data Weigh on USDHey Traders,
In the coming week, we’re monitoring AUDUSD for a potential buying opportunity around the 0.65000 zone. The pair remains in a broader uptrend, with the current pullback shaping up as a healthy correction toward key structural support.
Structure:
Price continues to respect its ascending trendline, and the 0.65000 area aligns with a strong confluence of horizontal support and dynamic trend structure — a level that has previously attracted strong buying momentum.
Macro Outlook:
The latest U.S. inflation print came in softer at 3.0%, undershooting expectations, while labour market data continues to signal cooling conditions. Together, these developments reinforce a dovish shift in Fed sentiment, weighing on the U.S. Dollar Index (DXY).
At the same time, Gold continues to rally, underpinned by the weakening Dollar and rising safe-haven demand. Given the positive correlation between AUD and Gold, this macro backdrop strengthens the bullish case for AUDUSD in the coming sessions.
Next Move:
A sustained bid around 0.65000 could mark the start of another impulse leg higher — targeting a retest of recent highs if momentum confirms.
Trade safe,
Joe

EUR/USD | Breaks Higher After CPI Data – Next Stop 1.17?By analyzing the EUR/USD chart on the 2-hour timeframe, we can see that after an initial rise, price corrected to 1.15765, then gained strong buying pressure and climbed up to 1.165 so far.
Following today’s CPI report , which came in lower than expected, the euro strengthened and the U .S. dollar weakened .
I expect EUR/USD to continue its upward move, with the next target at 1.16710 . If price breaks above this level, the following targets are 1.16815 and 1.16950.
Please support me with your likes and comments to motivate me to share more analysis with you and share your opinion about the possible trend of this chart with me !
Best Regards , Arman Shaban

EURUSD Breakout and Potential RetraceHey Traders, in today's trading session we are monitoring EURUSD for a buying opportunity around 1.15600 zone, EURUSD was trading in a downtrend and successfully managed to break it out. Currently is in a correction phase in which it is approaching the retrace area at 1.15600 support.
Trade safe, Joe.

Gold Eyes 4,010 Support Ahead of CPI – Big Move Loading?Hey Traders,
In tomorrow’s trading session, we’re monitoring XAUUSD for a potential buying opportunity around the 4,010 zone. Gold remains in a broader uptrend and is currently in a correction phase, approaching a key support and resistance confluence around 4,010 that aligns with the ascending trendline.
Market Focus:
All eyes are on tomorrow’s U.S. CPI release, with expectations for headline inflation at 3.0% and core at 3.1%. A softer-than-expected print could weigh on the U.S. Dollar, potentially igniting fresh momentum for GOLD to resume its bullish trend.
Next Move:
Watching price action around 4,010 closely — if CPI data confirms disinflation, we could see a strong rebound toward recent highs as safe-haven demand strengthens.
💬 What’s your take on the CPI? Are you positioning long or waiting for confirmation? Drop your thoughts below!
Trade safe,
Joe

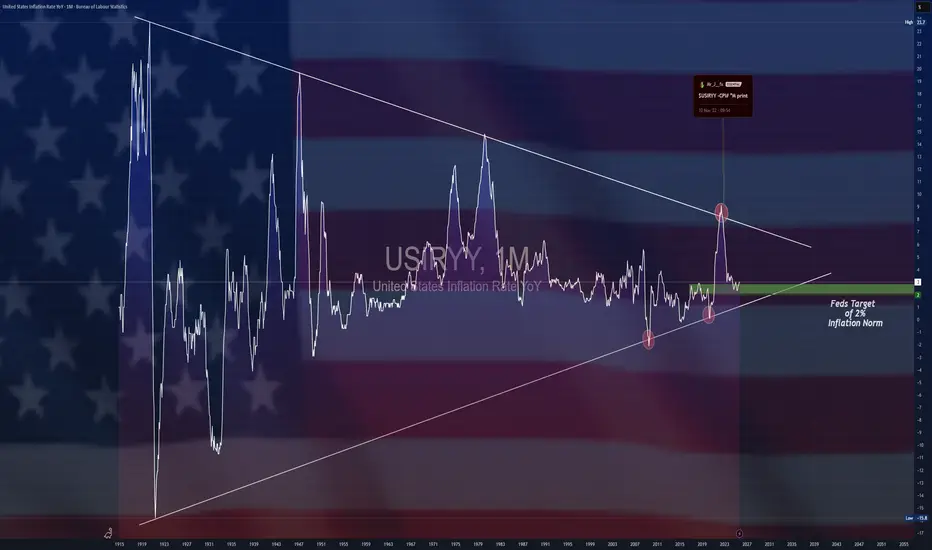
$USIRYY -U.S Inflation Rate (September/2025)ECONOMICS:USIRYY 3%
September/2025
source: U.S. Bureau of Labor Statistics
- The US annual inflation rate rose to 3.0% in September from 2.9% in August, slightly below market expectations of 3.1%.
It was the highest rate since January, mainly due to a jump in energy prices. Meanwhile, core inflation eased to 3.0% from 3.1%, while monthly headline and core CPI increased 0.3% and 0.2%, respectively.
CPI Shock Moves Gold — Easy loss avoided - Easy strategy appliedSo when it's CPI Day.
I call it a Medium Probability Trading day.
Either I risk less or observe the charts because of the volatile nature CPI has on many main markets like Gold, JSE, US500.
ANd today was no different.
We first boxed the chop - sideways market
This way we don't trade when the market moves in a consolidation period.
WHEN TO TRADE WITH MAs
Only when the price breaks OUT and the price is below 20MA and below 200MA - We look for shorts.
Or when the price breaks OUT and the price is ABOVE 20MA and above 200MA - We look for longs.
However, the price remained within the chop until CPI came out.
Came out worse than expected, which caused a RALLY with gold in the short term.
So you need to consider these anomaly and volatile times when you trade. You might avoid unnecessary losses.
Got it? These are just some tips you can take into your account that I have learnt over the last 23 years of trading the markets with the SAME breakout trading system.
So let's sum up fundamentals now for those who love economics.
When the latest CPI and Core Inflation data hit the markets, traders instantly shifted focus to gold — the ultimate inflation hedge.
Let’s break down what unfolded.
🧾 CPI & Core Inflation Data
The Consumer Price Index (CPI) came in at 324.8, just below the forecast of 325.01.
This slight miss signals that inflation is cooling — a positive sign for markets.
Core inflation stayed steady at 3.1% year-on-year, suggesting price pressures remain but are slowly easing.
📊 Market Setup Before the News
Before the release, gold prices moved sideways, reflecting trader uncertainty.
The phrase “Strike avoided” hinted at calmer market sentiment after earlier risks faded.
Everyone was waiting for the data — and volatility was brewing beneath the surface.

BTC: Breakout or a deeper dip into 105–102k?__________________________________________________________________________________
Market Overview
__________________________________________________________________________________
BTC is pinned just below 112.0–112.5k, with 12H/1D still trending up but capped by a risk‑off macro backdrop. Volatility is compressing and flows are mixed, favoring catalyst‑driven moves.
Momentum: 📉 Neutral‑to‑bearish tactically below 112.0–112.5k until a clean daily breakout confirms.
Key levels:
- Resistances (HTF): 112.0–112.5k (key pivot), 114.6–115.0k, 115.8–116.6k.
- Supports (HTF): 109.5–110.0k (demand block), 107.0–107.5k, 105.0–102.0k (ISPD staircase: 105.0 → 103.5 → 102.6–102.0k).
Volumes: Moderate to normal, no notable extremes (mainly intraday).
Multi-timeframe signals: 1D/12H = Up, 2H/4H = Down, 15/30m = Up; this mix warrants clear confirmation at key gates (112.5k up, 109.5k/107k down).
Risk On / Risk Off Indicator context: NEUTRE VENTE — a headwind that contradicts the HTF uptrend and argues for caution on break attempts.
__________________________________________________________________________________
Trading Playbook
__________________________________________________________________________________
Strategic stance: HTF trend remains constructive, but we favor patient, opportunistic execution while price sits below 112.5k.
Global bias: Neutral‑cautious (NEUTRE VENTE) while < 112.5k; bullish invalidation on a daily close above 112.5k.
Opportunities:
- Breakout buy: Buy a confirmed close/retest above 112.5k targeting 114.6k then 116.5k.
- Tactical sell: Fade a firm rejection at 111.9–112.5k with volume, target 110.0k then 107.0k.
- Buy‑the‑dip: Scale in on clean reversal within 105.0–102.0k (ISPD), add on hold above the reclaimed floor.
Risk zones / invalidations:
- Break below 109.5k opens 107.0k; losing 107.0k can accelerate toward 105.0–102.0k.
- Failed follow‑through after >112.5k breakout = trap; invalidate on a close back below 111.9k.
Macro catalysts (Twitter, Perplexity, news):
- US CPI ahead: a hotter print revives “higher for longer” and weighs on breakouts.
- US spot ETF flows: 7‑day average negative — headwind until it improves.
- Fed: 2025 cut cycle started but split views — volatility remains elevated.
Action plan:
- Breakout long: Entry 112.6k (validated retest) / Stop 111.9k / TP1 113.2k, TP2 114.6k, TP3 116.5k (R/R ≈ 1.8–2.0).
- Fade short: Entry 112.2k (confirmed rejection) / Stop 112.6k / TP1 110.0k, TP2 107.0k, TP3 105.0k (R/R ≈ 2.0).
- Dip long (scales): Entry 105.0–102.0k on ≥2H reversal candle / Stop below hit floor / TP1 107.0k, TP2 110.0k, TP3 112.5k (R/R ≈ 2–3).
__________________________________________________________________________________
Multi-Timeframe Insights
__________________________________________________________________________________
In sum, higher timeframes are constructive, but mid‑TF weakness still caps upside attempts.
1D/12H: Uptrend, yet 112.0–112.5k is the breakout “gate”; moderate volumes → demand a clean close/follow‑through before adding risk.
6H: Recovery stalls below 112.7–113.0k; watch 105.0k (6H ISPD) for a quality reversal‑buy trigger.
4H/2H/1H: Corrective bias; rallies fade near 112.9–113.4k while 109.3–110.0k holds — loss exposes 107.0k.
30m/15m: Micro uptrend inside the range; momentum trigger above 112.25–112.3k, but macro headwind argues for smaller size and confirmed follow‑through.
__________________________________________________________________________________
Macro & On-Chain Drivers
__________________________________________________________________________________
Macro is event‑driven (CPI, ETF flows), while on‑chain/derivatives point to a hedged, cautious regime.
Macro events: US CPI in focus (a “hot” print would weigh on breakouts); US spot ETF 7‑day average flows negative (risk‑off tone); the Fed started a 2025 cut cycle but remains split — volatility risk persists.
Bitcoin analysis: Range framed by 112k (daily close needed) and ~106–107k; volatility compression lifts breakout odds, but cooled flows argue for selectivity.
On-chain data: BTC below STH cost basis (~113.1k) and ~108.6k quantile; options put‑skew and elevated IV — a hedged transition regime.
Expected impact: Technical bias stays “neutral‑sell” until a daily close > 112.5k or a strong reversal on clustered floors at 105–102k.
__________________________________________________________________________________
Key Takeaways
__________________________________________________________________________________
BTC trades a liquidity‑heavy range below 112.5k with stepped supports toward 107k and 105–102k.
- Overall trend: neutral with a slight downside skew at resistance.
- Most relevant setup: confirmed breakout above 112.5k or quality reversal buy within 105–102k.
- Key macro factor: US CPI and persistently soft ETF flows shape timing and conviction.
Stay disciplined: wait for validation or quality dips before deploying risk.
