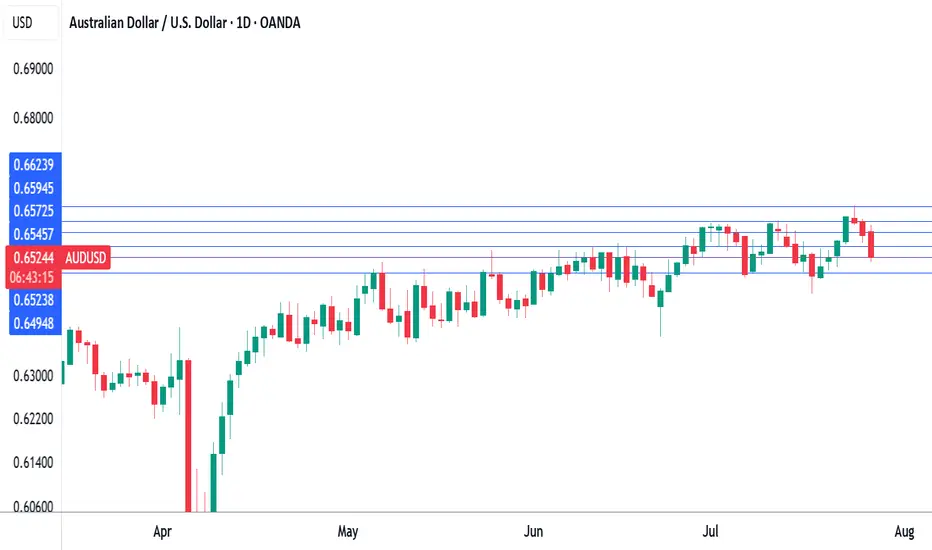
Australian CPI To Keep The RBA Cautious On RatesAustralia's monthly headline inflation metrics were all above expectations. While the basing effect and likely one-off electricity costs are a factor, it doesn't explain everything. I look at some of the CPI report's internals and outline what I think this means for AUD/USD.
Matt Simpson, Market Analyst at Forex.com and City Index
CPI

USDCAD potentail longs due to weaker than expected CAD CPI y/y The Canadian Consumer Price Index (CPI) for July 2025 showed a year-over-year (YoY) increase of 1.7%, down from 1.9% in June 2025 and below the forecast of 1.8%. The decline in headline inflation was largely due to falling gasoline prices, though food and shelter costs continued to push inflation higher.
Due to the weaker-than-expected economic data, we expect the CAD to weaken against the USD.

CAD/JPY in focus ahead of Canadian inflation data
Canada publishes its July inflation numbers shortly. The market’s looking for 0.3% MoM on the headline CPI. Median measure of CPI is expected to hold around 3.1% y/y with trimmed CPI seen steady at 3.0%.
Numbers lower than those would likely support the idea that the Bank of Canada will resume cutting before long, especially because growth risks are piling up. Only 15bp of easing is priced for October, with a full cut not seen until January. Weakening activity and labour markets at home, coupled with Fed potentially easing in September, could well force the BoC’s hand. A move in October would become more likely if data rolls over.
The CAD/JPY is an interesting CAD pair to watch given that it has recently broken a bullish trend line. Key resistance that now needs to hold is between 107.20 to 107.50 (shaded on the chart). However, it would be a bullish scenario if rates were to climb above this zone and reclaim the broken trend line.
By Fawad Razaqzadam market analyst with FOREX.com

BTC 1H Analysis – Key Triggers Ahead | Day 12💀 Hey , how's it going ? Come over here — Satoshi got something for you !
BINANCE:BTCUSDT
⌛ On the 1-hour Bitcoin timeframe, we can see that the trend has shifted from bullish to a deep correction. The reason for this move was the release of higher-than-expected Producer Price Inflation, influenced in part by Trump’s tariff policies. As a result, the likelihood of an interest rate ( CPI) cut has decreased — which is not particularly favorable news for the market.
👀 After forming a new all-time high, Bitcoin faced heavy selling pressure and a sharp rejection, pushing it towards support levels. The current key support for Bitcoin is at $117,200, which could attract market makers (buyer entries). The next support is likely around $115,000.
🎮 Fibonacci levels have been drawn from a higher low to Bitcoin’s all-time high. The most important levels are $117,200 and $119,800. A breakout above or below these levels could provide potential long or short trading opportunities.
⚙️ On the RSI, the key resistance zone is at 35.88. Historically, each time the RSI has reached this level, Bitcoin has reacted strongly. A rejection here could lead to a deeper correction, while a breakout above it could trigger upward momentum.
🕯 Both trading volume and the number of transactions are increasing, but selling pressure is leaving increasingly “red” candles. This rise in volume could be a useful signal for planning entries.
🔔 There’s no specific alarm zone today since Bitcoin is in a phase of uncertainty, and the exact reason for the market’s drop has not yet been fully absorbed.
CRYPTOCAP:USDT.D 📈USDT.D has broken a strong resistance level and is now moving toward its next resistance .
🖥 Summary: Trump’s tariffs have fueled higher producer inflation, reducing the chances of a rate cut. Bitcoin’s critical support is at $117,200; if this breaks, the price could move towards lower levels.
❤️ Disclaimer : This analysis is purely based on my personal opinion and I only trade if the stated triggers are activated .

What the Heck is Happening? Core PPI Spike & Fed’s Tough ChoiceCrazy market moves, weird data spikes… and everyone’s confused.
In under 2 minutes, I’ll break down what’s going on — and why it matters for your trades.
If it helped, smash that boost—it fuels my mission!

DXY Potential DownsidesHey Traders, in today's trading session we are monitoring DXY for a selling opportunity around 97.900 zone, DXY is trading in a downtrend and currently is in a correction phase in which it is approaching the trend at 97.900 support and resistance area.
Trade safe, Joe.

Scenario Study: (USD/JPY) BULLS vs BEARSHere’s a fresh, focused read on USD/JPY using today’s news, data, and technicals, plus trader sentiment on 4 hour charts.
What changed today so far... (Aug 13, 2025)
CPI came in mild (~2.7% YoY) → markets ramped up odds of a September Fed cut (≈94–98%) → Treasury yields/dollar slipped. That kept USD/JPY heavy after a pop to ~148.5 earlier in the week.
4-hour technicals (levels that matter)
Range defined by MAs: Price has been ping-ponging between the 4h 100-bar MA (~147.94) and 4h 200-bar MA (~146.73). A break of either side likely sets the near-term trend.
Nearby resistance: 148.00/148.50 (recent weekly high ~148.52). A sustained 4h close above opens 149.00 → 149.50.
Nearby support: 147.10 (intra-range floor) then 146.70 (4h 200-MA); below that, risk toward 146.00–145.50.
Short MAs (8 & 16 on 4h charts): With CPI softness pressuring USD, the very short MAs are flattening/near price (typical in a range). A bearish tilt re-asserts if price rides below them toward the 200-MA; a bullish turn needs reclaims above them and a close >148.00/148.50. (Directional inference from the cited 4h range behavior.)
Sentiment & positioning
Retail positioning: Net-long skew persists (~61% long / 39% short), a contrarian negative for USD/JPY if the skew persists into weakness. Ahead of/after CPI, trader bias for USD leaned bearish (BofA), and the dollar index eased post-release. That favors JPY on dips unless risk rallies push yields back up.
Tradeable take (4-hour game plan)
Bias now: Mildly bearish / range-to-down while below 148.00–148.50 and especially if price holds under the 8/16 4h MAs toward the 200-bar MA (~146.7).
Bearish continuation trigger: 4h close below 146.70 (200-MA) → momentum target 146.00 → 145.50; invalidation back above 147.20–147.40.
Bullish reversal trigger: 4h close above 148.50 (and holding above the short MAs) → targets 149.00 → 149.50; invalidation on a drop back below 148.00.
THE BOTTOM LINE
Today’s softer CPI + higher cut odds keep USD/JPY on the back foot, with the pair stuck between the 4h 100- and 200-bar MAs. Until 148.50 breaks, risk skews to a grind lower toward 146.7 → 146.0; a clean topside break flips bias to 149+~.
Thank you for reading, and happy trading!
_________________________________
DISCLAIMER: This analysis was conducted by our in-house team of multi-level traders. We are not responsible for any losses you may incur. Always do you own research before trading.

USDJPY Breakout and Potential RetraceHey Traders, in today's trading session we are monitoring USDJPY for a selling opportunity around 148.900 zone, USDJPY was trading in an uptrend and successfully managed to break it out. Currently is in a correction phase in which it is approaching the retrace area at 148.900 support and Resistance area.
Trade safe, Joe.

BTC 1H Analysis – Key Triggers Ahead | Day 9💀 Hey , how's it going ? Come over here — Satoshi got something for you !
⏰ We’re analyzing BTC on the 1-hour timeframe after today’s CPI release .
👀 Following the CPI news, Bitcoin broke through key areas — including the descending channel and the $117,000 resistance — and moved higher. It then faced rejection from the previous high, pulling back to around $118,000, which aligns with a multi-timeframe 4H SMA25 bounce. After that, it broke the $119,000 level and is now heading toward its key resistance at $120,000.
🎮 Fibonacci drawn from the current high to the price jump zone shows our current key level at 0.61, which is a relatively strong resistance. Breaking above this Fibonacci level could send BTC toward its current high and potentially lead to a new ATH.
⚙️ On the RSI oscillator, the key level is 70. Entering the overbought zone could push BTC toward its current high.
👑 The 99 MA is forming a strong base below the 0.37 level, while the 25 MA is working to break resistance and push price upward. On the 4H multi-timeframe view, the 0.23 area acts as a rebound zone after touching the 25 MA.
🕯 Volume and trade count are increasing, with solid consolidation above zones where whales have been buying and accumulating. Following today’s CPI results, fresh capital has flowed into risk assets like Bitcoin. This could be highly attractive for other coins, especially BTC pairs that are bullish in these conditions.
🔔 You can set an alert at the $120,000 area to watch price action when it reaches this level. If it matches your setup confirmations, you can open a position. Personally, I have a profitable long position on Ethereum, which is considered a BTC pair.
📊 On the 1H timeframe for USDT.D, we can see that after reacting to 4.20%, it faced a drop, and with a break below 4.10%, BTC could set a new high.
🖥 Summary: Bitcoin is moving toward its $120,000 resistance, where we could consider opening positions. The most important factor will be holding and confirming above this level.
❤️ Disclaimer : This analysis is purely based on my personal opinion and I only trade if the stated triggers are activated .

EURUSD Under Pressure Ahead of U.S. CPI ReleaseIn line with the dollar’s hold, EURUSD is trading between 1.1580 support and 1.17 resistance, forming a bullish rebound from its 200+ pip drop in July. A clean hold above 1.17 may extend gains toward the 1.18 resistance, with further upside possible toward the 2021 highs — with key levels in sight at 1.20 and 1.24.
On the downside, if the DXY recovery continues, EURUSD may face selling pressure below 1.1580, potentially pulling prices toward 1.1450 and 1.1380. A confirmed break of those levels could open the way for a deeper decline toward 1.12 and 1.11, where renewed bullish positioning may re-emerge.
- Written by Razan Hilal

SHORT ON NAS100NAS has retested a major supply zone after a nice CHOC (Change Of Character)
I will be selling NAS looking to catch over 800-100 points.
DXY (USD) CPI economic news will also be a catalyst to more this trade this morning after 8:30am.
Is Gold Ready to Break Out from 5-Month Consolidation?Gold has remained in a consolidation phase since April 2025, following its record high of 3500, trading within a narrowing range between 3450 resistance and 3260 support. With tariff-related news easing, price action has softened slightly but continues to hold within the consolidation zone near 3350, awaiting confirmation from the CPI print to either reinforce dollar weakness and rate cut expectations or reverse the current narrative.
Technically, a clean hold above 3400 and 3450 could extend the rally beyond the 3500 record, toward the 3780 level first, and the 4000 checkpoint second.
To the downside, a close below 3260 would open further risk toward 3130 and 2980, potentially offering another long-term accumulation zone.
Written by Razan Hilal, CMT

XAU/USD Intraday Plan | Support & Resistance to WatchGold is consolidating just under the $3,353 level after yesterdays drop from $3,399.Price is holding below both the 50MA (pink) and 200MA (green), keeping the short-term bias tilted bearish.
If buyers manage to reclaim $3,353 and close back above the 200MA, the first upside target would be $3,380, followed by $3,399 and $3,422 if strength builds.
Failure to reclaim $3,353 could see sellers retest $3,329, then the $3,313-$3,295 Secondary Support Zone. A deeper breakdown would expose $3,281-$3,254 Higher Timeframe Support Zone.
📌 Key Levels
Resistance:
‣ $3,353
‣ $3,380
‣ $3,399
‣ $3,422
Support:
‣ $3,329
‣ $3,313
‣ $3,295
‣ $3,281
‣ $3,254
🔎 Fundamental Focus
All eyes on today’s U.S. CPI release.
⚠️ CPI days often see false breaks and whipsaws — let the market settle before taking positions.

Nightly $SPY / $SPX Scenarios for August 12, 2025 🔮 Nightly AMEX:SPY / SP:SPX Scenarios for August 12, 2025 🔮
🌍 Market-Moving News 🌍
🇨🇳 Tariff Truce Extended 90 Days
The White House signed an order late Monday extending the U.S.–China tariff pause by 90 days—removing a key overnight risk into CPI day. Watch AMEX:SPY / SP:SPX , TVC:DXY , NASDAQ:TLT for the reaction.
💵 Dollar Firms Into CPI
The dollar edged higher ahead of this morning’s inflation print as traders recalibrate rate-cut odds; stocks and long U.S. yields were choppy into the release.
🗓️ Quiet Tape, Big Catalyst
Futures and global markets stayed cautious into CPI; positioning is tight after Monday’s drift lower.
📊 Key Data Releases & Events (ET) 📊
📅 Tue, Aug 12
6:00 AM — NFIB Small Business Optimism (July).
8:30 AM — CPI (July) & Core CPI (official BLS release).
10:00 AM — Richmond Fed Pres. Tom Barkin speaks (Chicago; 9:00 CT).
10:30 AM — Kansas City Fed Pres. Jeff Schmid speaks (9:30 CT).
2:00 PM — Monthly U.S. Federal Budget (July) (Treasury MTS, 8th business day).
⚠️ Disclaimer: Educational/informational only — not financial advice.
📌 #trading #stockmarket #economy #CPI #Fed #SPY #SPX #DXY #TLT

Inflation Countdown: BTC and ETH at Key Levels Ahead of CPIMarket focus is quickly turning to the US CPI report coming up this week. A higher-than-expected figure might weigh on risk assets like Bitcoin and Ethereum, keeping the former in rangebound mode and the latter fighting for a handle above $4,000.
Ethereum is consolidating just above the $4,150 level after a sharp rally. The recent higher highs and higher lows keep the short-term bias bullish, but a sustained move below $4,100 could indicate shifting momentum.
Bitcoin is testing resistance at $119,000 after a solid recovery from below $113,000. The price remains inside a broader range between $116,000 and $123,000, with repeated upper wicks signalling sellers defending the top of the range.
NAS100 - Stock market awaits an important week!The index is above the EMA200 and EMA50 on the four-hour timeframe and is trading in its ascending channel. If the index corrects downwards towards the drawn trend line or the specified demand zone, you can buy Nasdaq with better reward for risk.
Many Federal Reserve officials believe that tariffs could weaken the U.S. economy and push inflation higher—a dilemma that forces policymakers to choose between cutting interest rates to support growth or keeping them unchanged to control prices.
However, Miran—the economic adviser President Donald Trump intends to nominate to the Fed’s Board of Governors—rejects this view. He argues that tariffs will ultimately benefit the economy and will not significantly impact prices, allowing the Fed to resume the rate-cutting cycle it halted earlier this year.
The key question now is whether Miran’s arguments will be persuasive enough to sway the broader thinking of the central bank’s policy committee, or whether concerns over labor market weakness might prompt rate cuts regardless, rendering his arguments unnecessary.
According to analysis from The Wall Street Journal, beyond the policy disagreements, Miran has also challenged the institutional legitimacy of the Federal Reserve. He has accused Fed officials of having political motivations and criticized them for what he calls the “tariff disruption syndrome.” In a paper published last year, he argued that all senior Fed officials should be subject to dismissal at the White House’s discretion. If appointed, he would give Trump a loyal ally inside the Fed’s boardroom—someone capable of promoting the president’s views and challenging the institution’s consensus-driven culture and influential research staff.
Meanwhile, JPMorgan has revised its monetary policy forecast for 2025, now expecting the Fed to deliver three 25-basis-point rate cuts starting in September 2025, compared to its earlier projection of just one cut in December.
Miran, who holds a Ph.D. in economics from Harvard University, currently serves as Chairman of the White House Council of Economic Advisers. On Thursday, Trump announced his intention to nominate him for a newly vacant Fed board seat. This position became available unexpectedly after Adriana Kugler’s resignation last week and will expire in January. Trump also revealed plans to nominate another individual to fill this seat, who could potentially replace Jerome Powell as Fed Chair in the spring. Miran’s appointment would give Trump additional time to evaluate how candidates—whether Miran himself or Christopher Waller, whom he appointed during his first term—align with his policy views and vote on interest rates.
This week’s economic calendar is once again crowded, with a series of key inflation reports and consumer-related indicators in the spotlight.
Early Tuesday, the Reserve Bank of Australia will announce its interest rate decision, with markets expecting a 25-basis-point cut from 3.85% to 3.60%. Shortly after, traders’ attention will shift to the U.S. Consumer Price Index (CPI) for July, where core inflation is expected to rise from 0.2% in June to 0.3%.
Wednesday will be relatively quiet, with the main highlight being speeches from Fed officials Austan Goolsbee and Raphael Bostic. On Thursday, focus will return to major data releases, including the U.S. Producer Price Index (PPI), which is projected to see its core measure increase by 0.2% after holding steady in June. Weekly jobless claims figures will also be released that day.
The week will conclude with a broader look at U.S. consumer activity. July retail sales are forecast to slow from 0.6% to 0.5%, while core retail sales are expected to drop from 0.6% to 0.3%. Hours later, the preliminary August reading of the University of Michigan Consumer Sentiment Index will be released, providing insights into consumer expectations and confidence.
According to ISM data, pricing pressures have eased in the manufacturing sector but have jumped sharply in the services sector, which makes up a much larger share of the U.S. economy. This suggests that upcoming CPI and PPI reports carry an upside risk relative to forecasts. Inflation readings above expectations—even before fully factoring in the impact of retaliatory tariffs—could erase part of the market’s anticipated rate-cut outlook.

Tuesday’s triple risk: Tariffs, RBA rate cut, and U.S. inflationTraders face a busy Tuesday with developments on U.S. China trade talks, a RBA policy decision, and the latest U.S. inflation data.
U.S. China tariff deadline – Tuesday
The current truce between the U.S. and China is set to expire on 12 August, with U.S. Commerce Secretary Lutnick indicating it will likely be extended by 90 days. China may also face an additional 25% tariff on Russian oil imports, like measures already applied to India.
RBA announcement – Tuesday
The Reserve Bank of Australia is widely expected to cut rates, with a Reuters poll showing all 40 surveyed economists anticipating a 25bp reduction to 3.60%. The broader market is pricing a 98% probability of that outcome and a 2% chance of a larger 50bp cut.
U.S. CPI – Tuesday
Headline U.S. CPI for July is expected to rise 0.2% month-on-month taking the annual rate to 2.8% from 2.7%. Wells Fargo notes that the figures may show further signs of higher tariffs feeding into consumer prices.
Surely the RBA Must Cut Rates Now?The RBA defied expectations of a cut in July, despite soft trimmed mean inflation figures in the monthly CPI report. The quarterly figures have now dropped, which I suspect leaves little wriggle room to hold at 2.85% in August. I 6ake a look at the quarterly and monthly inflation prints that matter, then wrap up on AUD/USD.
Matt Simpson, Market Analyst at City Index and Forex.com

AUD/JPY: Fading the Rally at a Major Resistance ZoneWhile AUD/JPY has been in a clear uptrend, the rally is now approaching a significant technical ceiling where sellers have previously stepped in. We see a compelling opportunity for a counter-trend short, betting that this resistance level will hold and that the current bullish momentum is showing signs of exhaustion.
This trade is for those watching for a market turn, offering a well-defined risk-to-reward setup for a swing position.
🤔 The "Why" Behind the Short Setup
📰 The Fundamental Risk
The Australian Dollar is a "risk-on" currency, meaning it performs well when global markets are optimistic. The Japanese Yen, however, is a classic "safe-haven" asset that strengthens during times of uncertainty. With the upcoming high-impact Australian CPI data, any sign of economic weakness could disappoint the market, increase pressure on the RBA, and trigger a "risk-off" move that would benefit the Yen and send AUD/JPY lower.
📊 The Technical Ceiling
The chart tells a clear story. The price is currently testing a major resistance zone. Attempting to short near a strong ceiling like this provides a strategic entry to capture a potential trend reversal. We are essentially betting that the trend's multi-week momentum will stall and reverse from this key technical juncture.
✅ The High-Clarity SHORT Trade Setup
📉 Pair: AUD/JPY
👉 Direction: Short
⛔️ Entry: 96.716
🎯 Take Profit: 92.080
🛑 Stop Loss: 98.907
Rationale: This setup plays for a significant swing move. The wide stop loss is designed to withstand volatility from news events, while the deep take profit targets a full reversal back to major support levels seen earlier in the year.

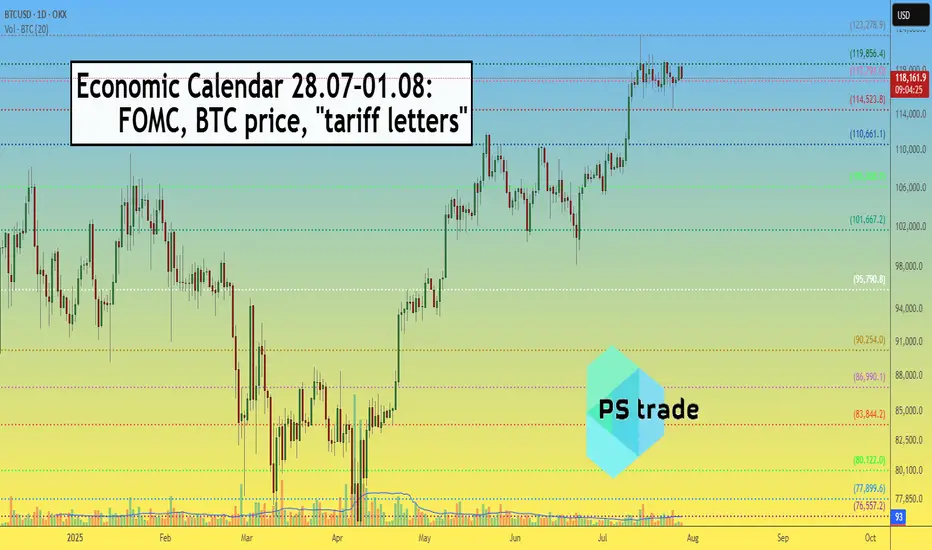
Very important Economic Calendar 28.07–01.08: FOMC, BTC, tariffsThis Week (July 28 – August 1) — the final week of the month is packed with key events.
Save this post and forward it to 3 friends 😉
📋 High volatility ahead — as the Fed’s key "threelemma" (inflation, labor market, tariffs) comes into focus.
Several important macro releases are scheduled — each one matters on its own, but combined, they can move markets sharply.
🗓 Monday (July 28)
▪️ 12:30 UTC – QRA (Part 1): upcoming US Treasury borrowing needs
▪️ 16:00 UTC – 2Y & 5Y bond auctions – key indicator of market expectations ahead of FOMC
🔗 Strong demand = stronger rate cut expectations
🗓 Tuesday (July 29)
▪️ 12:30 UTC – US GDP (Q2 estimate)
▪️ 16:00 UTC – 7Y bond auction
🗓 Wednesday (July 30)
▪️ 12:15 UTC – ADP employment report – early signal ahead of NFP
▪️ 12:30 UTC – QRA (Part 2): breakdown of Treasury borrowing
▪️ 18:00 UTC – FOMC rate decision (no change expected – 4.5%) + Powell’s press conference
🗓 Thursday (July 31)
▪️ 12:30 UTC – PCE inflation (June) – Fed’s favorite inflation gauge
🗓 Friday (August 1)
▪️ 12:30 UTC – Nonfarm Payrolls (employment)
▪️ 13:00 UTC – ISM Manufacturing Index (July)
▪️ 13:00 UTC – Univ. of Michigan Consumer Sentiment Index
▪️ All day – July auto sales data
🚨 LIBERATION DAY 2.0
Potentially the most impactful event of the week: the Trump administration will begin sending “tariff letters” to ~200 countries.
This marks the end of the temporary tariff relief (April 8 – August 1).
Markets expect a new wave of global trade tension — timing is still uncertain.
💡 Summary:
Every day brings a new potential driver.
Markets are nervous and highly reactive — sharp moves are likely...
CRYPTOCAP:BTC is currently being held above $117K, but Wednesday and Friday bring high risk of "news bombs".
Australian dollar down, eyes US GDP, Australian CPIThe Australian dollar is down for a third straight trading day. In the North American session, the US dollar has posted gains against most of the major currencies, including the Aussie. The greenback received a boost after the US and the EU reached a framework trade agreement after protracted negotiations.
The data calendar is bare on Monday, with no events out of the US or Australia. Things get very busy on Wednesday, with Australian inflation, US GDP and the Federal Reserve rate decision.
Even with no US releases, the US dollar has posted gains against most of the major currencies, including the Aussie. The greenback received a boost after the US and the EU reached a framework trade agreement after protracted negotiations.
President Trump had threatened to impose 30% tariffs on European goods if a deal was not reached by Aug. 1. With the deal, a nasty trade war between the world's two largest economies has been avoided and the US will tariff most EU products at 15%.
The deal with the EU comes on the heels of a similar agreement with Japan, bringing a sigh of relief from the financial markets that have been worried about the economic fallout from Trump's tariff policy. The agreements remove a great deal of uncertainty and investors are hopeful that the US and Chinese negotiators will wrap up their talks with an agreement in hand.
The Federal Reserve meets on Wednesday and is virtually certain to maintain interest rates for a fifth straight meeting. It will be interesting to see if President Trump, who has been sharply critical of Fed policy, reacts to the decision. The money markets are expecting at least one cut before the end of the year, with the money markets pricing in a 61% likelihood a cut in September, according to FedWatch's CME.
Bitcoin - Will Bitcoin continue its upward trend?!Bitcoin is above the EMA50 and EMA200 on the four-hour timeframe and is in its medium-term ascending channel. Bitcoin’s current upward momentum has the potential to reach its previous ATH. If it corrects, you can look for Bitcoin buying opportunities from the identified support area, which is also at the intersection of the bottom of the ascending channel.
If this support is lost, the decline will continue to around $113,000, where you can again buy Bitcoin with a better risk-reward ratio.
It should be noted that there is a possibility of heavy fluctuations and shadows due to the movement of whales in the market, and capital management will be more important in the cryptocurrency market. If the downward trend continues, we can buy within the demand range.
Last week, a group of U.S. senators released an initial draft of a new legislative proposal aimed at creating a clearer regulatory framework for the digital asset industry in the United States. The proposal builds on the recently passed CLARITY Act in the House of Representatives and focuses on strengthening market structure, enhancing consumer protection, and expanding regulatory oversight.
According to the senators, the bill addresses key areas such as banking, disclosure requirements, securities classification, and measures to combat illicit financial activity.Senator Lummis, in highlighting the proposal, stressed the urgent need for legal clarity to support the growth of this emerging industry within the U.S. The legislation aims to facilitate the integration of digital assets into banking services and would allow financial holding companies to provide services based on such assets.
The draft also includes measures aimed at preventing illegal financial activities, such as improving regulatory standards and boosting inter-agency cooperation to identify and block misuse of digital assets.
In addition, the senators have issued a “Request for Information” (RFI) to support the legislative process and have invited the public to share their opinions on more than 35 related topics, encouraging broader engagement in shaping the bill.
Meanwhile, in Asia, Japan-based firm Metaplanet announced that it has added 780 BTC worth $93 million to its digital holdings. This acquisition brings the company’s total Bitcoin reserves to 17,132 BTC, valued at roughly $2 billion. Metaplanet is fast becoming one of the largest institutional Bitcoin treasuries in the region—potentially serving as a model for other firms across Asia.
At the same time, publicly traded U.S. companies have significantly ramped up their Bitcoin holdings. By the end of Q2 2025, these companies had accumulated nearly 900,000 BTC, marking a 35% increase over the previous quarter. This surge, driven primarily by firms such as MicroStrategy, has sent demand for Bitcoin soaring.
Some analysts believe that the $1.5 trillion in free cash flow held by companies within the S&P 500 index could spark a new wave of institutional Bitcoin buying.
Looking ahead, the upcoming week is packed with critical U.S. economic data. Alongside the Non-Farm Payroll (NFP) employment report and inflation metrics via the Personal Consumption Expenditures (PCE) index, the initial estimate for Gross Domestic Product (GDP) and various other indicators will be released—potentially offering a clearer picture of where the U.S. economy is heading.
The Federal Reserve remains primarily focused on inflation and labor market dynamics. June CPI data indicated signs of inflationary pressure caused by tariffs. If Thursday’s PCE report—particularly its core reading—confirms a similar trend, the Fed may decide against a rate cut in September. As a result, financial markets have priced in only about a 65% chance of a rate cut at that meeting.

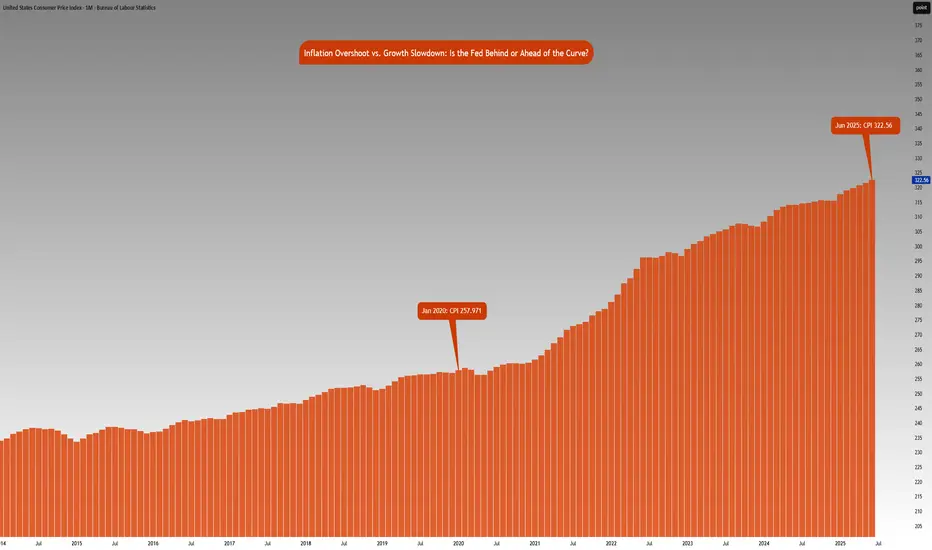
Inflation vs. Growth : Is the Fed Behind or Ahead of the Curve?CME_MINI:NQ1! CME_MINI:ES1! CME_MINI:MNQ1! CME_MINI:MES1! CBOT:ZN1!
Fed Policy recap:
There is an interesting and unusual theme to keep an eye on this week. The Fed is in a ‘blackout period’ until the FOMC meeting- this is a customary quiet period ahead of an FOMC policy meeting. Fed Chair Powell is scheduled to give a public talk on Tuesday. Although his address will be focused on the capital framework of the large banks, this appearance will be closely watched for any subtle signals on the FOMC policy stance.
Especially given that last week, Federal Reserve Governor Chris Waller made a speech, “The Case for Cutting Now” with a purpose as he stated to explain why the FOMC should reduce rate by 25 bps at the July 30th, 2025 meeting.
His stated reasons were:
1. Tariffs create one-off price level increases with transitory inflation effects, not sustained inflation momentum.
2. He argued that much of economic data points towards interest rates should be lowered to FOMC’s participants' median neutral rate, i.e, 3%.
3. His third stated reason notes that while the state of the labor market looks resilient on the surface, accounting for expected data revisions, private-sector payroll growth has peaked, with more data suggesting increased downside risks.
His speech further explains:
• Growth has decelerated sharply: Real GDP rose only ~1% annualized in 1H25, a significant slowdown from 2.8% in 2H24, and well below long-run potential.
• Consumer spending is weakening, with real PCE growth falling to ~1%, and June retail sales showing soft underlying momentum.
• Broader labor market indicators, including the Beige Book and JOLTS data, show declining labor demand and hiring caution, suggesting increasing downside risks to employment.
• Inflation is slightly above target (PCE ~2.5%) but driven primarily by temporary, one-off tariff effects. Core inflation ex-tariffs is likely near 2%, and expectations remain anchored.
• Current fed funds range (4.25%–4.50%) is well above neutral (3%), implying excessive restraint.
• With inflation risks subdued and macro conditions deteriorating, a preemptive rate cut now provides optionality and avoids falling behind the curve if the slowdown deepens. Further cuts may be warranted if trends persist.
• The tax bill contains pro-growth provisions, but its economic impact is expected to be minimal in 2025.
Source: Federal Reserve Speech, The Case for Cutting Now Governor Waller
Inflation Analysis:
Let’s compare this with what we have previously mentioned regarding inflation. CPI index stood at 257.971 points in January 2020. Projecting this at a 2% Fed target, June 2025 inflation should be around 287.655 points. However, June 2025 inflation is currently at 322.56 index points, 12.2% higher above 2% the inflation trend. Effectively, this means annualized inflation since January 2020 is roughly 4.15%.
The Fed is in a real dilemma whether cutting rates given the inflation trend in the last 5 years and risks to inflation outlook justify cutting rates.
Key Questions to ask
Markets are forward looking. Investors and participants want to know:
• How will the rates impact the cost of debt service? Currently the third largest government expenditure, over $1.03 trillion.
• Will the tariff rate offset the tax revenue losses by extending tax cuts?
• Is the fiscal path sustainable?
• What happens to the long end of the yield-curve?
• Will the Fed monetize the debt issuance imbalance?
• Is this simply Governor Waller positioning himself for the next appointment of Fed Chair when Fed Chair Powell’s term expires in May 2026?
It seems there is a huge conflict between longer term implications vs quick short term fixes that align with US administration objectives.
The Week ahead:
It is a relatively light economic calendar in the US. Flash PMI readings and housing data on the docket. The primary focus as it has been for most weeks since President Trump took office, will be on the developments in trade policy and any further comments on Fed and Chair Powell. The threat of renewed tariffs starting August 1st, is also key to monitor and whether these protectionist measures will force US’s trading partners to make further concessions to negotiate trade deals.
The earnings season is off to a good start with major US banks reporting higher EPS and revenue than expectations. This week investors will be looking at Q2 earnings reports from Alphabet, Meta, Microsoft from the Mag 7 and Tesla.