Tsla new highs Price broke below the channel so retail traders are now short. Smart money will push prices to new highs to stop them out providing liquidity to sell into. This is how a top is usually formed in all time frames.
Crash

BTC - Christmas Crash? BTC is again underneath these major bearish trendlines.
Is it possible we see a mega crash on Christmas Day?
We shall see. Chart is aligning in that direction.
Merry Christmas and be safe
- DD


VIX: Fear vs Correction principleBased on principle, where highest probability is when:
-(SPX) 50/200 UP sloping.
-Full correction
-Positive "context" (fundamentals, that change every year. For instance next year theme is new FED chair. Beginning of QE money printing etc).
Some times SPX drops and VIX flies on "fear". but strong trend stays in tact. And sometimes there is a full exhaust, meaning going up is "easy" (no resistance).

USDT.D Signalling Crypto Crash Zone & Bear Market Revisiting this study again that I originally shared months ago as a possible 'path' to either the new ATH targets and/or the Crypto Crash & Bear Market zones...
We can see the the Blue bars from the last cycle are an important fractal to follow.
USDT.D (Tether Dominance) clearly shows the inverse relationship it has with Bitcion and TOTAL market cap, which I have hidden here.
But the Yellow line is the midpoint and can be considered the 'Mean' in the 'reversion to the mean' equation.
At the lows of the USDT.D multi-year trendline going back to 2018, when touch the trendline, crypto is rallying and hitting all time highs.
In contract, when USDT.D is pushing higher (Money flowing into Stablecoins) we see markets correcting and crashing.
I've labeled the corresponding areas, which we can see that USDT.D is now forming support above the 6.5% prior resistance, indicating a deeper crash is likely coming.
Tomorrow is a Triple Witching expiration, so expect volatility.
However, in the past these usually mark reversal points in the markets.
So we'll have to watch and see...
However, most other technical signals are flagging bearish like the Monthly MACD and mult-month Bearish Divergences on the RSI, MFI, and Stoch/RSI
Good time to be out of the markets IMO until this clarifies.
Even if we get a 'Santa Rally' I'll be selling into it, b/c the USDT.D has plenty of room to run to the upside... And we're unlikely to see liquidity return to the markets without more interest rate cuts, QE, and money printing.
All eyes are on Japan's Fed Rate meeting tomorrow, where there's rumored to be a .25 rate HIKE which also has the markets on edge.

$OM MANTRA coin analysis Hi 👋🏻 it's me your " Raj_crypt0 " ..... 💚
will BINANCE:OMUSDT next KRAKEN:LUNAUSD
" Yes , I hope so - 90% new High not possible
I hope it's not possible "
coin already got squeezed at $5/5.5 in weekly to 3 month time frame as weakness we can observe
Upcoming downtrend 📉 target 🎯 is - $0.1
$0.1 / 0.0875 ...... 🎯 Support 💪🏻 let me meet u there 😂
" U have a question ⁉️ does ' alts season ' & ' BULL RUN ' completed - obviously 🙄 ' NO ' "
CRYPTOCAP:TOTAL haven't reached 5T 🎯 - still season was around corner
" Some coins complete early bull , some late _&_ some on time " nothing much ✔️


There is a chance BTC can return the 80K zone - Data should confEven with the increase from 80K zone to up 86.7K, BTC is able to return from this zone into the breakdown trend, where this will go exactly the coming time frames, which should be confirmed with time. We need to confirm this, the data change, and the last data shows a bitcoin that can get a correction again.

US Recession Imminent! WARNING!Bond traders are best when it comes to economics. Stock traders not so much.
As the chart shows, historically, when rates bunch up, what follows is a recession. During the recession, the economy tries to fix itself by fanning out the yield curve, marking it cheaper to borrow and boosting the economy.
The best time to be buying up stocks and going long the market is when the yield curve is uninverted and fanned out wide—not when it is bunched up like this.
My followers know this is my first warning of a recession since FEB. 2020.
WARNING! Things can get ugly from here very quickly!

BTC Wyckoff (pt. III), Pi Cycle Top, 350 SMA, and SPY Is A SELL!Trading Fam,
Was this the top? Where is Bitcoin going? Where are stocks going? Will the selling continue? How long? Can we find some targets? Where should we look to start DCA'ing back in? These are hard questions. Let's take a look at what my charts are showing us.
✌️Stew

Chinese stocks could hedge US tech crash Chinese stocks broke their loose correlation to US equities in 2021.
US tech stocks may or may not be in a bubble, but if they are Chinese stocks could be attractive.
The 2008 crash in the US was viewed as a major relative leap for China, because their citizens are generally savers (setting aside the reasons for those savings lol). They were able to weather the storm then and guess what, they're all padded with cash again because of the domestic deflationary storm right now.

BTC BREAKING NEWS OR BREAKING CHARTS?📰 BREAKING NEWS OR BREAKING CHARTS?
TRUMP IMPOSES TARIFFS, CAUSING A BITCOIN BLOODBATH — $20,000 DRAWDOWN IN 2 HOURS!
Bitcoin was sitting comfortably at $121,000, before a sudden macro shock — triggered by newly imposed U.S. tariffs — sent prices spiraling down to $100,000 in a matter of hours.
Bulls were liquidated. Bears rejoiced.
Now, the market stands at a crossroads: will this become a major dump continuation, or the foundation for a secret pump?
Chart Overview & Structure
On the high timeframe, BTC continues to trade within a rising wedge formation, with price now showing a significant wick rejection from the upper boundary. This move suggests a potential shift in market structure — a moment that’s likely to shake inexperienced traders. The chart reveals a clear supply and demand structure:
Supply Zone: $123,452 – $130,000
D emand Zone: $98,826 – $101,400
These zones define the battlefield between bulls and bears. In addition, eight psychological levels dominate the chart — $100K, $105K, $110K, $115K, $120K, $125K, and $130K — each representing potential liquidity clusters and reaction points.
Adding to the complexity, we can see a golden pocket (0.618–0.65 retracement) forming around $106,000, perfectly aligning with prior swing lows and the midpoint of a large Fair Value Gap (FVG) overhead. This zone could serve as a reversal or continuation point depending on whether price can reclaim and hold above the major support trendline.
Technical Insights
The market has now tapped the rising wedge resistance three times, with the last tap forming a wick above $125K, triggering liquidity before the sharp collapse. This aligns with the classical exhaustion behavior of wedges. Moreover, a potential Head and Shoulders structure is beginning to emerge, with the right shoulder aligning near $115K — a confluence area that may attract strong bearish attention.
For now, price is testing the lower support trendline — a crucial pivot area for determining whether BTC continues to break down toward demand or consolidates for recovery. This structure creates a make-or-break zone that will define the next macro leg.
Bullish Scenario
Despite the panic, this could be a classic liquidity flush — a “flush candle” event designed to wipe out leveraged long positions before a larger move upward. If BTC can maintain structure above the major support line and close above $106K–$110K, it opens the door for a relief rally.
A reclaim of $115K would confirm buyer strength.
Sustained momentum could push BTC back into the $120K–$125K range to retest the broken supply zone.
Breaking through $125K would invalidate the bearish wedge, potentially igniting a run toward $130K+ and even new highs in “Pump-tober.”
In this scenario, the deep liquidation event becomes fuel for a massive short squeeze, driving momentum and reigniting bullish sentiment across crypto markets.
Bearish Scenario
On the flip side, if BTC fails to hold above $106K or decisively breaks below the demand zone at $98K, it would confirm a rising wedge breakdown.
Below $100K, momentum could accelerate toward $95K–$92K — the next liquidity pools and volume gaps.
The Head and Shoulders completion would confirm the bearish reversal structure, further strengthening the downside case.
Macro sentiment, fueled by geopolitical and policy fears, could add weight to the bearish outlook.
A rejection from $115K without sustained reclaim would also reinforce the bearish continuation pattern, with every psychological level above turning into resistance.
Summary
Bitcoin is at an inflection point — the $100K–$115K range will define the next macro move.
The recent wick and structure breakdown hint at weakness, but the flush candle and liquidity sweep also suggest that a bullish rebound could be on the horizon.
In short:
Above $115K → Bullish continuation possible.
Below $100K → Bearish expansion likely.
With volatility at its peak, traders should expect massive liquidity hunts, fakeouts, and emotional traps on both sides.
Whether this becomes the start of a macro correction or a secret accumulation phase before a major pump — the next few daily closes will tell the story.

BTC MARKET UPDATEThe bears couldn't push the price below 16800 Support. The price bounced from the 16800 support due to the massive BUY ORDER BLOCK and moved above the 17000 key level. If we notice the daily timeframe then the price is under the consolidation box for a long time, any movement outside this box with a strong confirmation will be massive (whether upside or downside) Trade Carefully and Stay Tuned!

Bitcoin Crash, Correction or the Final Shakeout. What to Watch.In this video, I examine the narrowing window of opportunity for us to still push up to $150k this year, and potentially $200k by Q1 2026.
The weekly Bollinger Bands (Modified for Crypto @ 3STDev) show tightening which signals a likely bigger move is brewing. The question is, do we breakout to the upside...
Or continue lower, to the $100k - $105k range where I'm seeing buyers and placing my buy orders.
I've been in cash for weeks, waiting for the final shakeout which appears to be happening now.
Let me know your thoughts below and what you think comes next!
- Brett

BTC Loses Structure — Risk of Falling Below $106KBitcoin has officially lost the low-time-frame structure, confirming the end of the previous uptrend zone.
Momentum has shifted to the downside, with sellers gaining control and price now approaching a critical breakdown level.
📉 Current outlook:
BTC remains under $112K, signaling continuation of short-term weakness.
The end uptrend zone around $109K failed to hold support.
Market structure shows potential continuation below $106K if no reversal occurs soon.
📊 Observation:
Buyers have not defended the local range, and repeated rejections near $116K confirm exhaustion of bullish strength.
The next liquidity pool sits below $106K, which could act as the next target zone in this downtrend sequence.
💬 Summary:
BTC has broken its short-term structure — the chart shows clear downside risk with potential move below $106K if pressure continues.

DXY relative perf. to predict market tops.Using intermarket analysis. During expensive markets, demand for US dollar grows - and often it correlates with stock market tops. Step further - we can use intermarket analysis of DXY/SPX. Look for trend break out and Higher Lows in the structure. ✅

BTC Enters Breakdown Area — Volume Could Push Back Below $110KBTC Enters Breakdown Area — Volume Could Push Back Below $110K ⚠️
The previous volume that took BTC before 101K has some trends of this volume, which has a manipulation views, the volume before that did took BTC below 101K ended with a fakeout.
Bitcoin has entered the breakdown area, showing early weakness as price struggles to hold momentum near $115K.
The recent volume spike looks more like distribution pressure than accumulation, signaling that a correction phase could be forming.
📉 Current outlook:
Breakdown zone between $116.3K – $109.7K is active.
Volume is rising, but without strong upward continuation — a sign of selling absorption.
If this pattern holds, BTC could retest the $110K zone or drop slightly below in the next move.
📊 Observation:
The market is testing the upper side of the breakdown range but lacks follow-through.
A close back under $114K would confirm weakness and invite further downside momentum.
💬 Summary:
BTC is inside its breakdown area, and current volume suggests pressure may build to drive price back below $110K if buyers fail to reclaim control soon.

Deeper Correction + Opportunities in DEC/JAN. based on VIXNot sure if VIX FUT can be a lead indicator. The pattern narrows end of year or new year (historical correlation w/ corrections).
//VIX FUT trending above 20 means high probability corrections.

A scary fractal from 2020 Price is seeming to repeat what it did just before the covid crash. Seems like another massive VIX spike is coming soon.

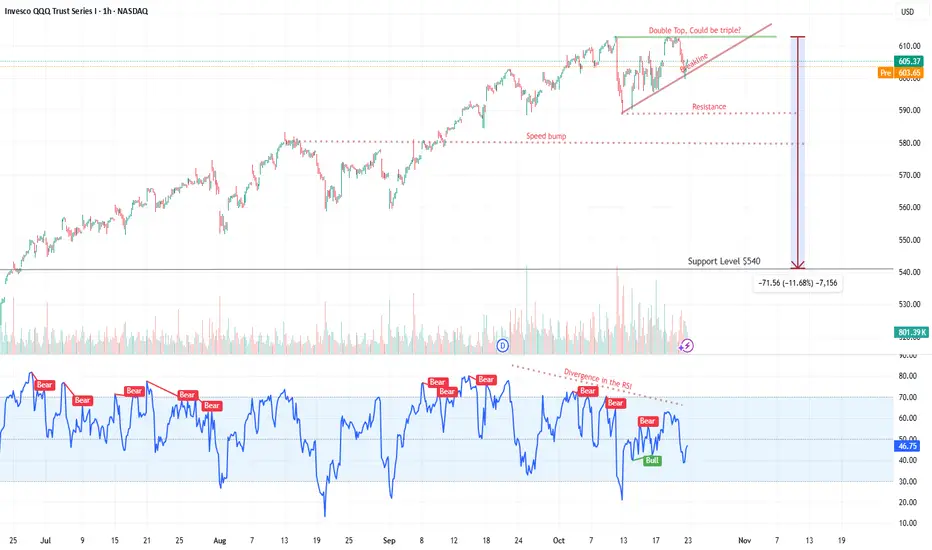
QQQ Ready to CollapseReasons the stock market could fall today:
Government shutdown fears creating uncertainty and GDP drag
White House instability after East Wing destruction shaking political confidence
Rising China tensions and supply chain disruption fears
New or expanded tariffs increasing costs and squeezing margins
Inflation pressures staying elevated despite weak growth
Stagflation worries combining slow growth with high prices
Investor sentiment turning risk-off amid multiple uncertainties
Corporate earnings at risk from weaker demand and higher input costs
Global contagion from China or Europe worsening growth outlook
The Great Reset In a modern equivalent of the 1929 stock market crash, a rapid and severe market collapse would be triggered by a combination of overleveraged speculation, inflated tech valuations, and sudden shifts in global monetary policy. Within days, trillions in market value could vanish as algorithmic trading amplifies the sell-off, investor panic spreads through social media, and liquidity dries up. Major financial institutions could face insolvency risks, prompting emergency interventions from central banks and triggering a global recession reminiscent of the Great Depression—now unfolding at digital speed.

Bearish Divergence still at playThe momentum hasn't been great on weekly. Multiple bearish divergence were in play, right before tarrif shock and a few after some runners but it just lead to more inconsistent and weak ath.
4h/daily tf shows a bull and bear trap widening pattern. Unfortunately bulls got hurt the most.
I'll be bullish once weekly RSI breaks the divergence.

BTC - Another Wick Down to 35,000Per this parallel ascending Channel breakdown - expect another large wick to the downside.
Short Entry - 111,200 to 112,500
Stop Loss - 112,700
Target 1 - 97,350
Target 2 - 64,700
Target 3 - 36,100
This is the first wick down of a 3 wave corrective movement.
I will break the trade down into smaller segments.
For the larger idea see related post “Ultimate Swing Short”
- DD
