Analyst and Trader. What are the differences?
The main difference between an Analyst and a Trader is in their main goals.
For an analyst, the main goal is to determine the future price and write articles.
Most analysts give a double trend direction in their forecasts, as they worry about their incorrect forecast, and hedge in case of their mistake.
For a trader, the main goal is to MAKE a PROFIT when working in the market. At the same time, the direction of the trend is a secondary goal, since you can also make a profit by scalping when the trend does not matter much. Each trader has his approach to trading and his trading strategy. One trader opens a long position to earn money on the growth of quotations, but at the same time, another trader opens a short position on the same instrument to earn money when the price drops.
PROFIT is the main priority for the trader.
The analyst can show alternative options for the development of events, leaving the trader to make a responsible decision about actions in one or another option. At the same time, the Analyst does not risk anything - neither his money nor his reputation, since TWO OPPOSITE scenarios insure him from making a mistake.
As a rule, 65% of analysts do not trade themselves, but only write analytical articles and make forecasts.
A few facts about the analyst and trader:
Analyst:
- collects information and analyzes the market situation
- writes analytical articles
- makes forecasts (usually in two directions, for safety)
- probably trades/invests by himself according to his forecasts
Trader:
- determines the direction for a potential transaction
- performs risk calculation and installation of a protective order (stop loss)
- performs trading operations on the market to make a profit
- manages and accompanies the position from the beginning to the end
And who do you think you are? An analyst or a trader?
❤️ Please, support our work with like & comment! ❤️
Cripto


rise of the king👌see related idea.well i was totally correct last week (see the related ideas).it will rise now😁👌.like and follow.i said microstrategy bought bitcoin when the price was 45000_46000(strong support+technical support).

Without this, you will not become a profitable trader
Yes, this is risk management.
Without proper risk management, your trading strategy based on levels, indicators, patterns, etc.will not make any sense.
Any trading strategy should be supported by strict risk management, where the maximum allowable losses per transaction and the risk ratio are observed:the profit is always more than 1/2.
You don't have to be right in every trade. It's just that your profit in successful transactions should be greater than the losses in unprofitable transactions. This correct use of risk management will lead you to success.
____________
The example shows one of the real scenarios of any trading system where the rules of risk management are observed:
Deposit of 10,000$
The risk per transaction is -1% (or -100$)
Total trades:
4 profitable trades = +14%
10 losing trades = -10%
Total: +4% (or + 400$)
Even though only 30% of the total number of profitable transactions, we still have a profitable result.
Learn risk management and become a consistently profitable trader.
❤️ Please, support our work with like & comment! ❤️

FETCH.AI FREE MONEYVery solid project with huge potential for gains in the medium/long term. Waiting for the break of 0.77

short btcshort btc based on elliot waves
and fibonacci chanels
good luck everyone and god bless all you


i think this way.when the price was 41400 i said whales are selling and gray scale sold 100 bitcoin(related idea).now whales are buying😁👌but gray scale sold 25 bitcoin(price start ranging) i think the price will touch 41000 again.i will buy 37500 but i will buy again if the price touch 36000😁.


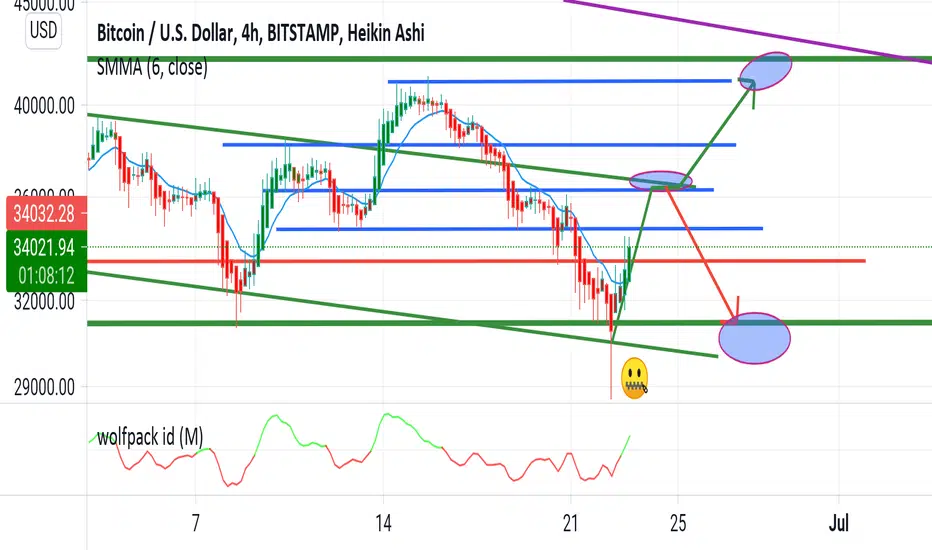
buy signal by wolfpack and smoothed moving average.buy signal.blue areas are important.see related ideas
BTC/USDT Interesting fractal + MACD divergence1H chart. If we break the trendline, a 37.5k target seems reasonable

BTCUSD - Mutiple EMA TendenceLet's go from exponential moving averages.
If the EMA 144 crosses and stays above the EMA 72 we could have another price drop. Just below we have the EMA 305 which can hold the price above this region. If the price exceeds the EMA 305 we will have a 4th test in the region of the 29k - 33k region but with the possibility of testing the EMA 610 region
RSI is back below 50 showing strong resistance for price to stay above 40k.
Let's wait for the scenes of the next chapters
It is not trading advice.
Make your own analysis and decision.

For now on BTCUSDOn the 13th of June we had the break of the descending triangle and 50 region of the RSI with confirmation on the 14th of June reaching resistance in the 40k region. On June 15th we have the selling force dominating the day leaving a doji showing market indecision. For confirmation of move reversal and triangle exit it is still necessary for the RSI to remain above 50 showing the strength of the bulls to drive the price to test the next resistance in the 50k region and the downtrendline in the coming days/weeks . In case the breakout of the support at 40k is rejected, the price tends to test the upper line of the descending triangle.
It is not trading advice.
Make your own analysis and decision.


BTCUSDWe can see in BTCUSD a descending triangle with the formation of a possible bearish channel on h4.

crypto totall market cap.900B should be 500B☠️i dont want to make you happy.i just want to say the truth.😑.short.short.short.see the rsi line it should touch 40🙂
we sold bitcoin at 62000dollar.1bitcoin should be 25000 dollar.see the history!the next bull will start from 2022_2023.
it decreased 93percent☠️.(see the chart).every thing is possible.(please like and follow)see related ideas.

The awakening of litecoinOn LiteCoin the big players are continuosly buying, and medium players will start soon.
After a panic selling it is not difficult to find opportunities with possible very interesting profits and this can definitely be one of those.
My advisor Marketmiracle generated a purchase signal with target 452 usd and I will definitely take advantage of this opportunity.
You can see the full and real-time list of signals generated by Marketmiracle at marketmiracleadvisor.com

EOS it's time to rise ! Eos despite the negative pressure on all cryptocurrencies due to the sudden decrease of bitcoin shows to have grit, the big buyers are buying the currency in an interesting way and even the medium buyers start to care.
Think you can see a rise in the price of EOS up to 16 USD
If you want you can receive free and real-time signals IN LONG and OUT LONG from the market generated by my advisor to the page marketmiracleadvisor.com

XLM can rise also with panic sellingThe market sentiment for this cripto remain high, it is slightly negative but at the moment does not seem to want to affect the growth of this crypt.
I think that the XLM can reach 0,85 usd easily in the next hours.
You can use see all MarketMiracle Advisor signals at the link marketmiracleadvisor.com it's a free service for all.

The ambitions of ZcashMy Market Advisor generated a LONG entry signal at market price of 287 USD,
in retrospect, it is clear that large buyers have never stopped buying Zcash, so the recent sale, which was probably due to panic selling triggered by the decline in bitcoin, It was driven mainly by smaller investors who are now going back to buying.
Graphically seems to be actually configuring a head shoulders upside down so the graphical analysis confirms when anticipated by the advisor obviously the doubts remain on the timing of this recovery, but I’m trying to sketch a hand drawing to simulate what price action might be in the next few days.
If you want to see all the signals generated by Marketmiracle advisor in real time you can visit marketmiracleadvisor.com is a free service and does not require any type of registration.

