Golden Cross
GOLDEN CROSS
1. A golden cross occurs when a faster-moving average crosses a slower moving average.
2. Specifically, you need the 50-period and 200-period simple moving averages.
3. Anything other than these two periods and it is not a true golden cross.
4. The golden cross is a powerful trade signal, but this does not mean you should buy every cross of the 50-period moving average and the 200.
5. You will need to bring a higher level of sophistication to the setup, to ensure you are buying into a trade with real opportunity.
THE THREE STAGES OF A GOLDEN CROSS
1. As the downtrend in the stock market ends, the short-term 50-day moving average moves below the 200- day moving average.
2. In a crossover, when a stock recovers, the short-term moving average crosses over the long-term moving average. That’s where the term golden cross comes from, when the two average lines cross on a chart.
3. In a crossover, when a stock recovers, the short-term moving average crosses over the long-term moving average. That’s where the term golden cross comes from, when the two average lines cross on a chart.
THE THREE STAGES OF A GOLDEN CROSSPROFIT POTENTIAL OF THE GOLDEN CROSS PATTERN
A. DEATH CROSS
1. One option is to wait for a cross of the 50 back below the 200 as another selling opportunity.
2. The only issue with this approach is you are likely to give back a sizeable portion of your profits since moving averages are a lagging indicator.
B. PRIOR SUPPORT
1. What you can also do is look for areas of resistance overhead which will act as selling opportunities for longs that have been holding the stock for a long period of time.
2. A caveat to this strategy is that the stock may consolidate and push higher.
C. TRENDLINE BREAK
1. If the golden cross is real, the signal will likely generate a strong buying opportunity.
2. You can then use the first couple of reactionary lows to create an uptrend line.
3. You then hold the stock until this trendline is broken.
Cross

Deathcross tradeI've been tracking this since the BTC death cross occurred and while I know this is too late for anyone to make any profitable decisions it is worth making a note for the future. You can verify the 50 and 200MA death crosses yourself but the probability of BTC going back to 200MA is very high (only failed once in Sept 2014). Currently my safe target would be 48k. Why am I showing then the TOTAL crypto mcap chart? Well as you know other digital assets will not move up unless BTC is going up (in most cases as some directly impacting news can move an altcoin despite BTC moving down) and watching both TOTAL,TOTAL2 and BTC charts can give you a better view of the whole crypto market (add BTC.D to the mix). We are still around 10% off the minimum target and while macro outlook isn't great if it is to play out as expected based on past performance it is most likely going to happen over the next couple of weeks.
If we drop lower and make new lower low then lower high this death cross trade will be treated as failed setup.
Either way as mentioned before worth adding this to your trading setup arsenal (watch BTC and TOTAL charts on Daily only and you can then make bullish decisions on other crypto of interest)

$GALA 4h_lng_trlngstop tp01: 0.30$GALA long in play.
Adam and Eve / Rounded bottom
Filled at MA cross.
Employ trailing stop.
tp_01: 0.30
GLong

CRO/USDT 4HOUR UPDATE BY CRYPTOSANDERSWelcome to this quick
CRO/USDT analysis update
I have tried my best to bring the best possible outcome in this chart.
Reason of trade:-CRO/USDT is a triangle pattern create and buy the dip green zone
Entry:- CMP And buy the dip in the green zone
Target:- 30% TO 40%
Stop loss:- $0.40
Remember:-This is not a piece of financial advice. All investment made by me is under my own risk and I am held responsible for my own profit and losses. So, do your own research before investing in this trade.
Happy trading.
Sorry for my English it is not my native language.
Do hit the like button if you like it and share your charts in the comments section.
Thank you...

Cross with 30In RSI, it should cross the level of 30 and stabilize above it.
Any new entry is associated with risk.
Golden Cross on the 30 min chartIt looks like it is almost ready to cross on the 45 min as well this could play out for a nice reversal bitcoin is like a box of chocolates you never know what you are going to get.

ADABTC Not looking so good 🐻 📉 🐻Hi everyone 👋🏽
🕊 Wish y'all have a profitable lifestyle 🍀
📌 ADABTC- Weekly Time Frame - Candlestick
📌 Price Action - Fibo - RSI Divergence
📍ADABTC 's chart is not looking very good in every time frame from weekly to 2H. It is completely bearish in every aspect
📍 Price may have already finished its 5th cycle in the white horizontal line and it may see the 0.38% fibo , 0.5% and 0.618% which is the most important one.
✍🏼 A very powerful hidden divergence RSI is very visible to see in the weekly time frame which has already taken the price down
⚠️ HOWEVER, you should not consider this TA as a bearish sign for the ADAUSDT pair itself because it is based on ADABTC pair, and it has 3 meanings:
1- ADA 's price is dumping faster than BTC 's price (Both are going down together, but ADA faster🐻)
2- ADA is not growing as fast as BTC (Both are going up, but BTC faster 🦬)
3- ADA is dumping and BTC is pumping (ADA is going down and BTC is going up)
✍🏼 From EMA point of view, in weekly time frame price has broken 50 EMA and is going as fast as possible to hit the 100 EMA, which is overlap with 0.38% fibo level
✍🏼 In daily time frame a negative cross may occur between 200 and 100 EMA and can be a bearish signal for long term
THIS IS NOT A FINANCIAL ADVICE
PLEASE DO YOUR OWN RESEARCH BEFORE TAKING ANY SELL OR BUY POSITION
GOOD LUCK
NP TRADER

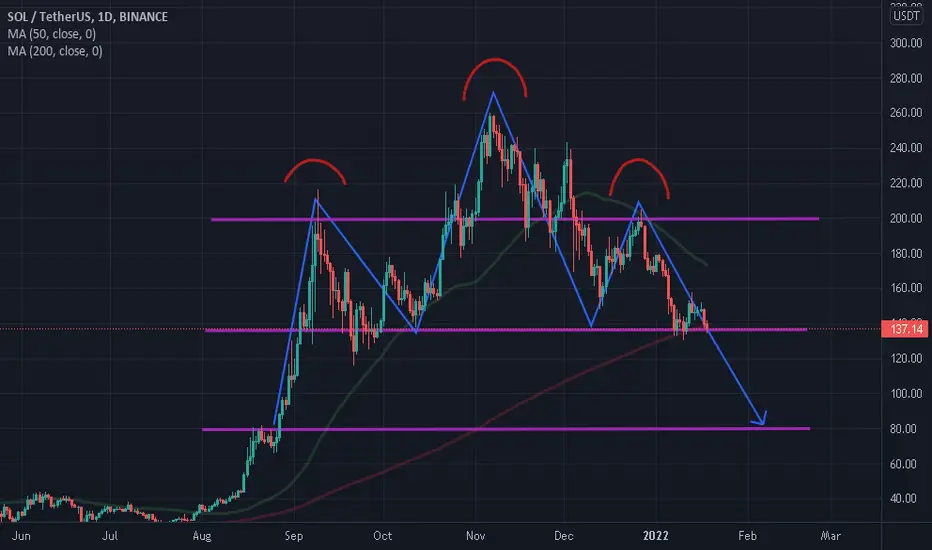
Solana ShortSolana Create head and Shoulder chart and its near to death cross 50 Moving Average is so close to 200 Moving average so its sure SHORT
Warning: Bitcoin Descending Channel + Death Cross !!!!Bitcoin Descending Channel + Death Cross
Bitcoin Descending Channel + Death Cross
Bitcoin Descending Channel + Death Cross
Bitcoin Descending Channel + Death Cross
What are your next expectations? Do you agree with this analysis?
But i'm optimistic.
This is not financial advice.

Artificial Intelligence YFI LongAI detected: Falling broadening wedge.
The price is at the support line.
Target is the purple circle.
MACD, RSI bullish crosses support uplift.

A Death Cross for Bitcoin?I see many people speaking about "The Death Cross" that's just appearing on the Bitcoin chart. The Cross brings some fear with it, and I can't just understand why, since it's not really a concerning one. But let me explain.
A Death Cross is only strong and meaningful as long as Both SMA (50 & 200) are pointing to the downside - both SMA need to be declining. Many Traders do also Check the Volume. If the Volume is Rising with the Cross, its more likely Valid, if the Volume is declining it less likely.
Personally, I don't really use the Volume to Confirm. I check the direction of Both SMA.
Edit: In my Opinion the Death as well as the Golden-Cross are really really bad Indicators since they're lagging really hard.
Don't get fooled!
If you like my Content, hit the 👍 and/or comment and make sure to follow.
This Analysis is not intended to be investment advice. Always DYOR.

Death Cross a Symmetrical analogy from the previous appearance The Death Cross just appear today, It's a cross from the 50 and 200 MA and the last two had declined 25% and 15% respectively
Expect a double bottom at the 0.786 Fibonacci level around $35.5K or at least -13% decline in the BTC price. A possible fake out pump up to $46K could happen. Sell Short @ 43K to 46K / Buy Long @ 35K to 37K
Please note the green candles as a symmetrical projection continuation pattern from the last death cross

Death Cross comming up ...We had 8 death cross in the history of BTC. 4 of them were real death cross. How will this death cross work out this time ? Will we lose up to 60%, or will the death cross not play out ? What is your opinion ?

PGR DailyNYSE:PGR may be ready to make a move.
Tested the bottom four times around $89.50 and it wouldn't break.
MACD just turned positive
Today's bar broke a trend line and closed above all the congestion from Nov
20 EMA crossed above the 50 EMA and they are both positive and accelerating.

BTCUSD Crossing Roads!BITSTAMP:BTCUSD
The level of 53K is the decision zone as before...
Price that under this level changes the market paradigm however do not hurry to take another position in case of the worst scenario...
Good Luck Everyone!!!

#EURUSD trying to test long term trendline looking for support!!Hi All, my main 3 take-outs from this analysis are the following:
1- EURUSD is approaching the support area of 1.11 (actually it would be between 1.10 and 1.11) which is historically relevant
2- The cross is also trying to test the descending red long term trendline, which was brocken in August 2020 with volumes
3- The RSI in the weekly chart is in oversold territory and everytime this happened in the past, the price rebounded strongly. We might be very close to this to happen
Not a financial advice, just personal opinion. Do your own due diligence and good luck!

DENT golden cross.I think I've been looking at DENT from the wrong perspective. In the longer time-frames I can see how DENT did a golden cross in the daily chart. Last time it did that DENT went up almost 100x since the signal.
Don't get too caught up in the lower time-frames, the price is way too unpredictable there, I think.
But what do you guys think? Opinions?

VIX looks 68% bearish since Covid's low data shows.1 H. D.Cross : Since Covid's low 13 done & 7 not yet
30M D.Cross: since January 2021 13 done 5 not yet
----------
- 1H chart 68% we are done off volatility only tailwinds
- 30Min Chart 68% we are done off volatility only tailwinds
In a nutshell: There is a 68% chance we are done of volatility !!!

BTCUSDT "H1" Trend AnalysisBitcoin was fluctuating in a short-term channel as you ca see. Given that the channel is broke from above, a long position can be opened if it is considered as a valid broke ( if we saw a strong bullish candle with high trading volume ). There is a possibility of a pullback and continuation of the path exactly as shown in the chart.
The trend line in the RSI is also broken and will probably react to the level of 70 and keep pace with the price pullback.
The moving average of 20, has broken up the 50 and give us another positive signal.
*This Analysis is a personal opinion and should not be the basis of your trades.*

Bitcoin Golden Cross 50MA/200MA ApproachingIf the current trend continues, we should see a golden cross on bitcoin around or before the 21st of September. This also correlates with the Full Moon on September 20th, coincidence?

Selloff 3 days after golden cross?Hello traders,
This is an analise where the ABC or ABCDE should start to happen. As per past and as per previous years, the selloff or correction "bigger" should happen on 2.9.2021, so make sure you go out before 2.9.2021 if you are in leveraged longs,
Crash is Estimated to be started 3 days after golden cross, which is estimated to happen on 31.8.2021, so crash should start on 2.9.2021, and to be completed abc or abcde on 13.9
DYOR, trade safe and lets see

CHGG WeeklyNYSE:CHGG weekly is ready to continue its uptrend. Last week gave a very bullish outside engulfing bar right as the 5 EMA crossed the 20 EMA. It is a very strategic spot and it is aligned with the MACD crossing up as well.

EUR/GBP Signal - GBP ILO Unemployment Rate - 15 JulEURGBP is trading to resistance prior to the GBP Unemployment rate data, which measures the amount of the workforce unable to find employment domestically. Technically the pair has traded to a key resistance level, and is also at 200 hour moving average resistance. We anticipate downside from here into the 0.8497 level.
