WTI OIL closing its first green month after 5 straight red.One month ago (December 30 2025, see chart below), we gave a strong long-term buy signal on WTI Oil (USOIL), as it hit its 8-month Support on a 1W RSI Bullish Divergence:
The price reacted very positively and is about to close its first green 1M candle after 5 straight red. This is why we bring you this time the same chart but on the 1M time-frame. At the same time pay close attention to the 1M MA200 (orange trend-line), which delivered the last strong rejection for the market, which last time closed a month above it exactly a year ago (Jan 2025).
This is why we stay firm on our $69.00 Target, which isn't only on the 0.618 Fibonacci retracement level (where all 3 previous Bullish Legs of the 2-year Channel Down retraced) but also below the long-term Resistance posed by the 1M MA200.
As a side-note, to get an idea of how bearish the market is on the long-term (and why a sell at the top of the Channel Down is later suggested), Oil hasn't closed a month above its 1M MA50 (blue trend-line) since July 2024.
---
** Please LIKE 👍, FOLLOW ✅, SHARE 🙌 and COMMENT ✍ if you enjoy this idea! Also share your ideas and charts in the comments section below! This is best way to keep it relevant, support us, keep the content here free and allow the idea to reach as many people as possible. **
---
💸💸💸💸💸💸
👇 👇 👇 👇 👇 👇
Crude

WTI CrudeVolatility has been moderate with occasional swings tied to macro headlines (e.g., inventory data and geopolitical cues), but no persistent trend acceleration. Range contraction has defined much of the recent sessions.
WTI pricing has been influenced by:
Geopolitical risk repricing, including geopolitical headlines that caused short-term spikes and retracements.
U.S. crude inventory builds and supply concerns, exerting downward pressures at times.
Mixed supply/demand signals and market focus on physical fundamentals ahead of major inventory reports have kept traders cautious.
Over this ten-day window, WTI has failed to sustain a strong directional trend, instead trading within a structurally narrow band. The market remains range-oriented.
Like & Share...

$BRENT technicals in convegence between Fibonacci and TrendlineBLACKBULL:BRENT has been on a downtrend since last Summer...
Now the descending trend line is about to hit the bottom of the Fibonacci Retracement Levels.
This forms a triangle that we know can break either upward or downward - place your entry points and Stop-Loss points accordingly.
While I don't provide Fundamentals analysis, the latest turns of events with USA and Venezuela make me lean towards a break on the downside for more supply of Crude Oil available to the US.

WTI OIL initiating a +10% rally.WTI Oil (USOIL) has been trading within a 1-month Channel Up, whose last Bullish Leg hit and got rejected exactly on the 1D MA200 (red trend-line). The resulting correction/ Bearish Leg found Support on the 4H MA50 (blue trend-line) and given that the 4H MA200 (orange trend-line) was kept intact, we expect that to initiate the new Bullish Leg.
The 1D RSI being above its MA (yellow trend-line) supports further upside and given that the previous Bullish Leg rose by +11.85%, we expect a similar development for the current one, targeting $65.50.
---
** Please LIKE 👍, FOLLOW ✅, SHARE 🙌 and COMMENT ✍ if you enjoy this idea! Also share your ideas and charts in the comments section below! This is best way to keep it relevant, support us, keep the content here free and allow the idea to reach as many people as possible. **
---
💸💸💸💸💸💸
👇 👇 👇 👇 👇 👇

WTI Outlook: Shifting Geopolitical Risk PremiumsWith headlines shifting away from U.S. strike risks against Iran and refocusing on Greenland acquisition threats—alongside EU opposition and tariff rhetoric—put option volume surged above calls. This occurred amid an overall decline in both volume and open interest in crude oil options, according to CME data for contracts expiring March 2026.
As long as headlines remain detached from short-term supply disruption risks, early 2026 oversupply narratives are expected to dominate, in alignment with tariff risks.
From a weekly perspective, crude prices continue to trade below a key resistance level and under the RSI 50 neutral threshold, reflecting neutral-bearish momentum until a decisive breakout materializes on both price and momentum indicators.
The key level remains the 62.20 high, reached during U.S.–Iran escalation risks. This level also aligns with the mid-zone of a duplicated descending channel, extending between the highs of June 2025 and the lows of December 2025.
A decisive hold above this level would be expected to extend gains toward the upper boundary of the broader downtrend channel in place since 2023, targeting:
• 64.70 (upper channel boundary since June 2026)
• 66.90 (upper channel boundary since 2023)
• These projections are derived using Fibonacci extensions measured between the April 2025 lows, June 2025 highs, and December 2025 lows.
The primary trend bias remains bearish, consistent with structural oversupply risks, unless a sustained hold above the highlighted resistance levels emerges to shift the dominant narrative.
On the downside, 58 and 55 remain critical support levels. A break below these zones could expose the lower boundary of the long-term channel dating back to September 2023, at 53 and 49, offering another potential dip-buying opportunity
- Razan Hilal, CMT

Risk premium on Oil unwinding?A Reuters report yesterday suggested a US attack on Iran was imminent, pushing oil to its highest level since October.
“Iranian Patriots, KEEP PROTESTING, TAKE OVER YOUR INSTITUTIONS!!! HELP IS ON ITS WAY,” Trump posted on Truth Social.
Today, that risk premium is fading as no military action has materialised. WTI is down, erasing two of the last four days of rallies.
The outlook can shift to the upside again quickly if tensions escalate, but traders should weigh the geopolitical risk against the reality of an oversupplied oil market.

Short Idea on Crude Oil (CL1!)Based on :
- avwap and vp levels
- Bond yield spikes
- quantitative analysis
- 2 supply zones for potential entries

WTI OIL Relief pull-back expected on the short-term.WTI Crude Oil (USOIL) is trading within a short-term Channel Up on the 1H time-frame, being supported by the 1H MA50 (blue trend-line).
With the price approaching the 1D MA200 (red trend-line) and the 1H RSI hitting its Lower Highs trend-line, it is possible to see a technical pull-back in the form of a Bearish Leg for this Channel Up.
All Bearish Legs within this pattern declined by around the same level, with the lowest being -1.81%. Assuming a max extension on the 1D MA200, we can calculate a minimum -1.81% decline, targeting $61.20.
---
** Please LIKE 👍, FOLLOW ✅, SHARE 🙌 and COMMENT ✍ if you enjoy this idea! Also share your ideas and charts in the comments section below! This is best way to keep it relevant, support us, keep the content here free and allow the idea to reach as many people as possible. **
---
💸💸💸💸💸💸
👇 👇 👇 👇 👇 👇

Crude Oil on the Brink: Will 58.70 Hold or Break?Crude Oil Futures (Feb 2026) – 8H Chart Breakdown
Crude Oil (CLG2026, 8H) is showing renewed weakness today.
Current close: 58.78
Session range: 59.77 high – 58.71 low
Change: −0.46 (−0.78%)
Price is trading near the lower end of today’s range, signaling selling pressure as buyers fail to hold above 59.00. If bears stay in control, a clean break below the session low at 58.71 could open the door to further downside.
From here, I’m watching:
Whether bulls can defend the 58.70–59.00 zone
Potential continuation of the short‑term downtrend if sellers keep stepping in on bounces
This 8‑hour structure is key going into the next sessions – I want to see if we get a strong reaction (bounce or breakdown) from this area before planning the next move.
💬 How are you positioning around crude oil at these levels?
#crudeoil #futures #CL #trading #technicalanalysis

BullishBullish trend will be officially confirmed when price decisively breaches above $70.
This is a great place (in my opinion) to buy if looking to speculate.
I entered multiple positions this morning that will benefit if I am correct.
Complex corrections are extremely difficult to get accurate wave counts on, but I feel pretty good about this one overall. We could of course not be finished with the final wave Y down and have a bit more to go before, but we will see!
Let me know what you all think.
Cheers,

WTI OIL This is what separates a drop to $49 from a rally to $68WTI Crude Oil (USOIL) remains within its 2-year Channel Down since the September 25 2023 High, as well within a 'smaller' one (blue) since late July 2025.
What separates right now the market from a continuation of the latter's Channel Down downtrend and a rebound towards the long ones 1W MA100 (green trend-line), is the 8-month Support level of 55.20.
As you can see, this has recently held (week of December 15 2025) for the 3rd time since April 2025. However the 1D MA50 (red trend-line) keeps rejecting any 1W candle, maintaining the bearish trend of the (blue) Channel Down.
If it breaks and the market closes 2 straight 1W candles above it (1D MA50), then we expect a 2-3 month rally to test the 1W MA100 and the 0.618 Fibonacci level (like all previous Bullish Legs within the 2-year Channel Down did) at $68.00.
If on the other hand the market closes a 1W candle below the 8-month Support (55.20), we expect the continuation of the bearish trend until the 1W RSI touches its long-term Support Zone again. An early estimated Target on his is $49.00 but best to take profit when the 1W RSI this the Support Zone regardless of the price, as it has marked the last two major market bottoms (Lower Lows).
---
** Please LIKE 👍, FOLLOW ✅, SHARE 🙌 and COMMENT ✍ if you enjoy this idea! Also share your ideas and charts in the comments section below! This is best way to keep it relevant, support us, keep the content here free and allow the idea to reach as many people as possible. **
---
💸💸💸💸💸💸
👇 👇 👇 👇 👇 👇

Crude to $75 Profit TargetYou all know I'm a 100% Chart driven trader.
But of course I also have my fundamental thoughts.
Here is my layman’s fundamental thesis:
I do not believe that Venezuelan oil will flood global markets, just because they grabed Maduro. On the contrary, the opposite is more likely. Venezuela’s production is dominated by heavy and extra-heavy crude, which is costly to extract and difficult to refine. As a result, an oversupplied market is unlikely from this point of view.
But with a U.S. military invasion of Iran could be very likely to drive oil prices higher, potentially sharply so. The effect would stem from supply risk, transportation chokepoints, and market psychology I think. Even if physical supply disruptions were initially limited. My experience is, that short-term crazy price moves are often driven by psychological factors.
So, in short:
1. Risk to the Strait of Hormuz (Primary Factor)
2. Potential loss or Threat of Iranian Oil Supply
3. Spillover Risk to Other Producers
4. Speculation and Financial Market Reaction
5. OPEC and Strategic Reserves Probably Very Limited
Sure, the magnitude would depend on duration, scope, and whether shipping through Hormuz remains uninterrupted, but upward price pressure would be immediate.
Timing is always the most difficult part. That’s why I would look at a trade with a horizon of at least three months, or longer (likely using ITM LEAP options).
The chart needs to confirm my thesis.
First, I want to see a break of the descending pressure line (red).
Next, the CIB line must be broken.
Finally, a sign of stabilization above the CIB line would serve as my entry signal.
That’s it. My stalker hat is on.

Vedanta - My Stock Pick for 2026Starting the year at ATH. Coming out of 15 year period of consolidation.
Look for dips till 530 to enter.
Target: 765 / 1200
Support: 530 / 495 / 360
Below 495 exit temporarily and buyback on reversal above 530.
Disclaimer: I have entered the trade around 606. Looking for dips to build on position.

WTI OIL Strong case for a 2-month rally.WTI Oil (USOIL) has been trading within a Channel Down since the September 28 2023 High. Since then, it as had four Bearish Legs (including the current one), which declined on a range of -25.62% to -31.58%. All subsequent rebounds (Bullish Legs) that followed, hit at least their 0.681 Fibonacci retracement levels.
Given that the price rebounded 2 weeks ago on the 8-month Support (55.20) and the 1W RSI has been on Higher Lows (i.e. Bullish Divergence) since May, we may see a new Bullish Leg emerging now.
The one condition that will confirm that will be the price breaking above the blue Channel Down. If that takes place, we will turn bullish for the next two months, targeting $69.00 (Fib 0.618).
---
** Please LIKE 👍, FOLLOW ✅, SHARE 🙌 and COMMENT ✍ if you enjoy this idea! Also share your ideas and charts in the comments section below! This is best way to keep it relevant, support us, keep the content here free and allow the idea to reach as many people as possible. **
---
💸💸💸💸💸💸
👇 👇 👇 👇 👇 👇

Buyers Step Into WTI Crude OilGiven the high-volume buy bar around a decent support cluster, WTI could be set to mean revert higher.
Matt Simpson, Market Analyst at City Index.

Will Crude Oil Rise or Fall?Crude Oil Futures (Jan 2026) - Market Analysis
Crude oil is trading at $58.39 per barrel, down 0.19%. Recent data show prices ranging from $58.12 to $58.62, indicating a period of consolidation. Key support is forming around $58.12, while resistance is at $58.62.
The overall momentum suggests limited near-term volatility, with the price hovering near its recent lows. Traders should watch for a breakout above resistance or a drop below support for the next directional move.
Stay tuned for further updates as market conditions evolve, and always manage risk
appropriately when trading futures.
#crudeoil #oilprices #trading #commodities #marketanalysis

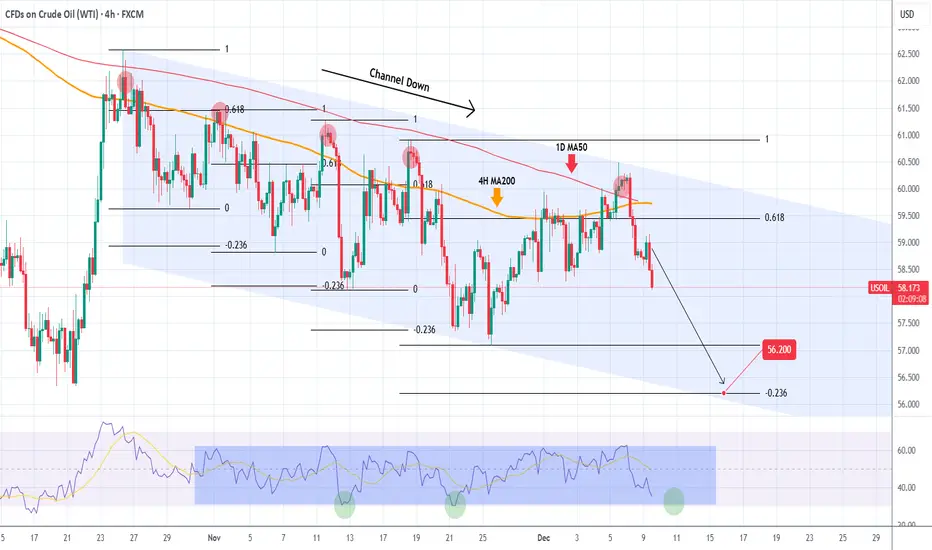
WTI OIL 1.5 month Channel Down started new Bearish Leg.WTI Oil (USOIL) has been trading within a 1.5-month Channel Down (since the October 4 High), that priced last Friday its latest Lower High, this time above the 1D MA50 (red trend-line).
That initiated the new Bearish Leg (also confirmed by the 4H RSI rejection at the top of its range). All 4 previous Bearish Legs bottomed just when the hit the -0.236 Fibonacci extension.
Based on that, we are expecting WTI to make a new Lower Low at 56.200.
---
** Please LIKE 👍, FOLLOW ✅, SHARE 🙌 and COMMENT ✍ if you enjoy this idea! Also share your ideas and charts in the comments section below! This is best way to keep it relevant, support us, keep the content here free and allow the idea to reach as many people as possible. **
---
💸💸💸💸💸💸
👇 👇 👇 👇 👇 👇
WTI OIL targeting at least $56.00 on the short-term.WTI Oil (USOIL) continues to expand its 4-month Channel Down and has repeatedly been rejected on its 1D MA50 (blue trend-line) in the past 40 days.
As mentioned before, this is similar to September's price action, which eventually tested the previous Support before breaking it and move to a new Lower Low on the 1.5 Fibonacci extension.
As a result, we are still expecting to see $56.00 on the short-term.
---
** Please LIKE 👍, FOLLOW ✅, SHARE 🙌 and COMMENT ✍ if you enjoy this idea! Also share your ideas and charts in the comments section below! This is best way to keep it relevant, support us, keep the content here free and allow the idea to reach as many people as possible. **
---
💸💸💸💸💸💸
👇 👇 👇 👇 👇 👇

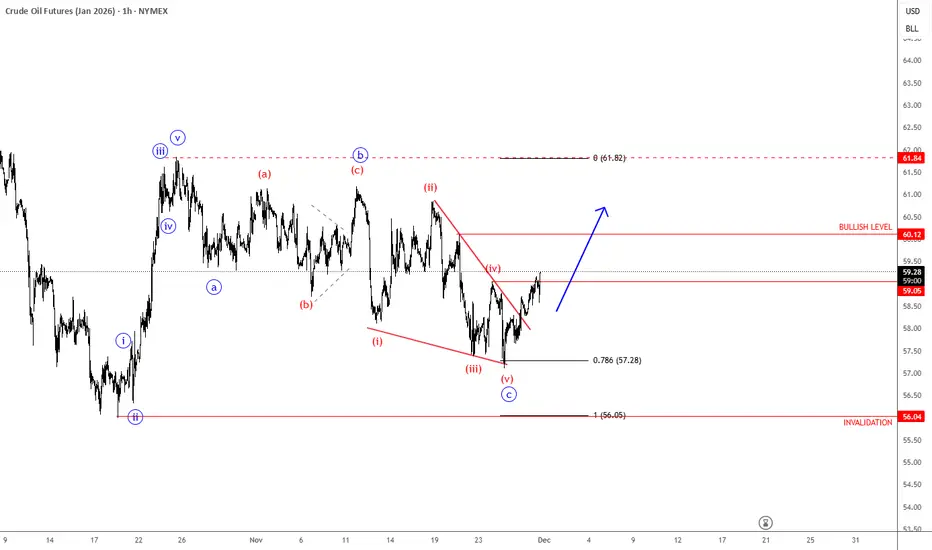
Crude Oil Has Finally Finished An Intraday Corrective SetbackCrude oil made a very strong rebound back in mid-October with an impulsive move of more than 11%, while the current retracement from 62 is very slow, which still suggests a counter-trend movement despite the weakness now retesting the 78.6% support levels. We can still see three waves down, and ideally subwave c is coming into a potential support zone, so a rebound can still happen while the market trades above 55.96 invalidation.
Looks like Crude oil is finally on the way back to October highs, as we see a sharp and impulsive rebound from the 78,6% Fibonacci retracement after a completed wedge pattern. So be aware of more intraday gians, especially if breaks back above 60 level, just watch out for pullbacks.
Crude oil off earlier lows but pressure remainsCrude oil has bounced off its earlier lows, thanks to a risk-on session in the stock markets. But oil's underlying trend remains bearish. Earlier saw Brent sliding to just below the $61 level—its lowest point this week, before stalling.
Oil’s latest decline kicked off after reports suggested that Ukraine has agreed to the outline of a potential peace deal with Russia. Now, nothing is signed yet—there’s still a lot of negotiation left - but markets reacted immediately.
So why did oil prices fall? Well partly because peace in the Ukraine-Russia conflict could mean sanctions on Russia may eventually be eased, and that could bring more Russian supply back into a global oil market that’s already pretty well-supplied. More supply equals more downward pressure on prices.
From a technical perspective, the chart of oil tells you everything you need to know. As shown by the daily chart of Brent, crude oil continues to print lower lows and lower highs, which is classic downtrend behaviour.
The key level to watch right now is $61 per barrel, a major support zone. If Brent breaks below that, then $60 is potentially the next target, followed by $58.25, which was the low back in April.
Unless something changes fundamentally, we could easily see a continuation of the current downtrend in the days and weeks ahead.
By Fawad Razaqzada, market analyst with FOREX.com

WTI OIL Short-term relief rebound before a Lower Low?WTI Oil (USOIL) has been trading within a 1-month Channel Down and has just completed its strongest Bearish Leg (-5.91%). All previous three Bearish Legs eventually bottomed and rebounded into the new Bullish Legs towards the Sell Zone consisting of the 4H MA200 (orange trend-line) - 1D MA50 (red trend-line) range to form a new Lower High.
In 2 out of those 3 cases, it even exceeded the 0.618 Fibonacci retracement level. As a result, we expect a short-term rise now to subsequently be sold towards the -0.236 Fibonacci extension. Our medium-term Target remains 56.500.
---
** Please LIKE 👍, FOLLOW ✅, SHARE 🙌 and COMMENT ✍ if you enjoy this idea! Also share your ideas and charts in the comments section below! This is best way to keep it relevant, support us, keep the content here free and allow the idea to reach as many people as possible. **
---
💸💸💸💸💸💸
👇 👇 👇 👇 👇 👇

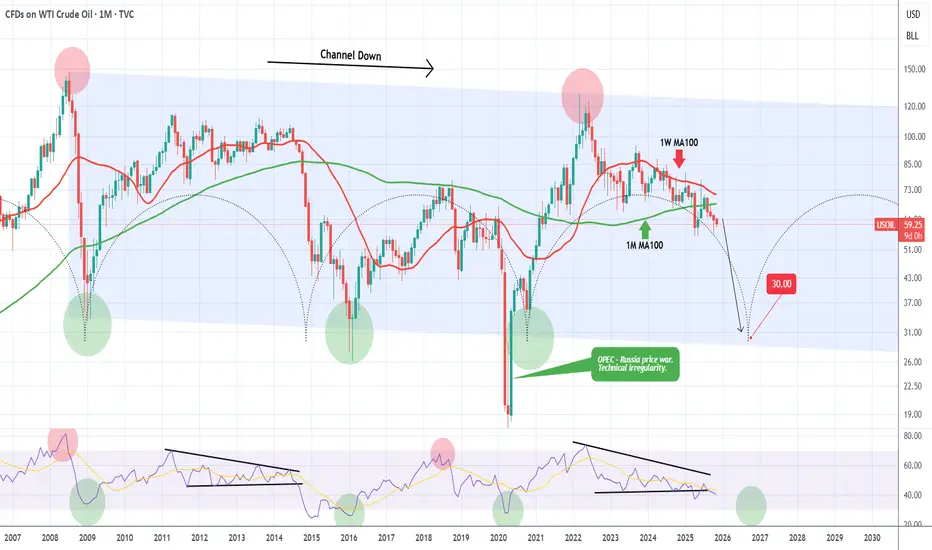
WTI OIL Is it possible to crash at $30.00?WTI Oil (USOIL) has been declining for 3 straight months (current red 1M candle is the 4th one) since the June 2025 rejection on the 1W MA100 (red trend-line). That has been the last rejection of a series of Lower Highs rejections on the 1W MA100 in the past 2 years.
On the much longer-term scale, this is the aftermath of the March 2022 market Top, made as a direct result of the Ukraine - Russia war. On a 17-year horizon, that was the 2nd Lower High of the multi-year Channel Down that WTI has been trading in since the July 2008 Top of the Housing Crisis.
As you can see, there is a high degree of symmetry on this pattern with Lower Lows in particular (market bottoms) getting formed around every 5-6 years. The use of the Time Cycles can fairly accurately project this. The next one is estimated to be towards the end of 2026, which matches perfectly the projected Bear Cycle bottom on the stock markets.
Based on this model, we may very well see WTI drop to as low as $30.00. A fairly solid bottom buy indicator would be when (if) the 1M RSI breaks below its 30.00 (oversold) barrier.
---
** Please LIKE 👍, FOLLOW ✅, SHARE 🙌 and COMMENT ✍ if you enjoy this idea! Also share your ideas and charts in the comments section below! This is best way to keep it relevant, support us, keep the content here free and allow the idea to reach as many people as possible. **
---
💸💸💸💸💸💸
👇 👇 👇 👇 👇 👇
WTI resumes slideExcess supply concerns continue to hold back oil each time it tries to stage a recovery, and today it looks like the market has decided that it wants to trade below $60 per barrel. WTI has been testing this barrier from underneath for a few days but today it looks like the advance has been rejected once again. Prices have broken below the lows of the past two days, thus triggering some stops. From here $58.00 could be the next stop, below which there is nothing significant in terms of support until $55.00.
By Fawad Razaqzada, market analyst with FOREX.com
