“Bitcoin 4H Bullish Continuation Setup — Liquidity Target at 98KMarket Structure
Bullish overall structure: Strong impulsive move up from the low ~90k area.
CHoCH (Change of Character) on the left confirms a shift from bearish to bullish.
Current price action is consolidating after impulse, which is typical before continuation.
Key Concepts on the Chart
1. Fair Value Gaps (FVG)
Lower FVG (~94k area)
This has already been respected → good sign of bullish strength.
Mid FVG inside the range
Price is currently reacting within this imbalance, suggesting accumulation.
👉 As long as FVGs are respected, bias remains bullish.
2. Fibonacci Levels (Internal Retracement)
From the impulsive leg:
0.618 ≈ 96,691
0.5 ≈ 96,290
0.0 ≈ 94,941
Price is consolidating between 0.5–0.618, which is a classic bullish continuation zone.
3. Support Levels
Primary support: 94,353
Major invalidation / deeper support: 93,073
📌 If price holds above 94,353, bullish continuation is favored.
📌 A clean break and close below 93,073 would weaken this setup significantly.
4. Resistance & Target
Range high / Liquidity: ~97,900 – 98,100
Marked TARGET POINT ≈ 98,117
This aligns with:
Previous highs
Liquidity resting above the range
Measured move from consolidation
Projected Scenario (Blue Path)
Short-term chop / minor pullback within the range
Hold above FVG + support
Expansion move targeting 98k+
This is a textbook continuation model.
Bias Summary
Bias: Bullish 📈
Invalidation: 4H close below ~93k
Target: 97.9k → 98.1k
Key Area to Watch: 94.3k–95k reaction zone
Cryoptocurrency

Binance Coin - $800 Demand Zone Holds, Watch Weekly The CloseBNB Weekly Reversal Setup: $800 Demand Zone Confirmed, Sunday Close Above $875 Opens Path to $1138
Binance Coin has successfully held a critical demand zone at $800 and is now approaching a pivotal weekly candle close. A Sunday close above $875 would flip the weekly structure bullish and open a clear path to $1138 as the first major target, with potential continuation to previous cycle highs. This analysis breaks down why the $875 weekly close matters and how to approach this setup with spot allocation.
🎯 Setup Overview:
Current Status: $800 demand zone held successfully
Critical Trigger: Sunday weekly close above $875
First Target: $1138 (major resistance zone)
Extended Target: Previous cycle highs
Strategy: Tier 1 spot buy on confirmed weekly close
Position Type: Spot only NO leverage recommended
📊 What's Happening Right Now:
The $800 Demand Zone:
BNB tested and held a massive demand zone at $800 an area where significant buying activity has historically occurred. This level represents:
Previous consolidation support
High-volume accumulation zone
Psychological round number
Multiple prior tests that held as support
The fact that price bounced from $800 rather than breaking through signals strong hands are defending this level.
The Weekly Candle Setup:
BNB is currently forming a weekly candle that could close above $875 on Sunday. This isn't just any level it represents the pivot point between continuation of consolidation versus breakout to higher targets.
Why Sunday's Close Matters:
Weekly closes carry far more weight than daily closes in crypto. They represent sustained positioning across an entire week of trading, filtering out intraday manipulation and noise. A close above $875 would confirm:
Demand zone at $800 was the low
Buyers have control on the weekly timeframe
Structure is shifting from consolidation to expansion
📈 Why $875 Is The Critical Level:
Technical Significance:
$875 sits at the intersection of multiple technical factors:
Weekly resistance that capped prior attempts
50% retracement of recent decline
Breakout level from current consolidation range
Momentum shift threshold on weekly indicators
Structural Flip:
Below $875: Price remains in consolidation, neutral structure
Above $875 (weekly close): Bullish structure confirmed, targets open
Historical Behavior:
BNB has shown respect for weekly closes throughout its history. When it breaks key levels on the weekly timeframe and holds them through the Sunday close, sustained moves typically follow.
🎯 The Target Structure:
First Target: $1138
Represents next major resistance zone
~30% upside from $875 trigger level
Previous consolidation area that will attract profit-taking
Logical zone for first position reduction
Extended Target: Previous Cycle Highs
If $1138 breaks cleanly, path opens to prior all-time high zones
~50-60% additional upside potential from $1138
Requires sustained bullish momentum and favorable crypto market conditions
Final target for remaining position
Why These Levels:
Based on:
Historical support/resistance zones
Volume profile analysis showing concentration at these prices
Fibonacci extension projections
Previous cycle behavior patterns
🛡️ The Tier 1 Spot Buy Strategy:
What Is a "Tier 1" Buy:
This represents a high-conviction allocation one of your primary positions rather than a small speculative bet. Tier 1 positions get larger capital allocation because they meet multiple criteria:
Strong technical structure (demand zone held)
Clear trigger (weekly close above $875)
Defined risk (invalidation below $800)
Favorable reward (30%+ to first target)
The Sunday Close Rule:
Entry trigger: Sunday weekly candle close above $875
If BNB closes at $876+ on Sunday: Execute spot buy
If BNB closes at $874 on Sunday: No entry, wait for next opportunity
This removes emotion—the market either triggers the setup or it doesn't
Why This Discipline Matters:
Entering before the weekly close risks buying a level that fails. Entering after confirmation means you might pay $5-10 more, but you have objective validation that the structure has flipped. This is the difference between gambling and strategic positioning.
⚠️ Why SPOT ONLY - NO LEVERAGE:
Crypto Volatility Is Extreme:
BNB can drop 15-20% in a single day even during bull markets. Leverage amplifies this into account-ending losses. Spot positions can weather volatility; leveraged positions cannot.
Weekly Timeframe = Long Hold:
From $875 to $1138 could take weeks or months. Leverage costs accumulate, and funding rates can erode position value even if directionally correct.
Sleep-at-Night Capital:
Spot allocation allows you to hold through inevitable pullbacks without liquidation risk. If BNB dips to $850 after entry at $880, spot holders are fine—leveraged traders are liquidated.
Preservation Over Greed:
The target offers 30-50%+ gains on spot. That's excellent risk-adjusted return without needing leverage multiplication. Protecting capital always supersedes maximizing gains.
📊 Technical Confluence:
Demand Zone at $800:
High-volume accumulation zone that has held multiple tests. This level represents where institutional and whale accumulation likely occurred.
Weekly Structure:
Higher lows forming on the weekly chart. A close above $875 would establish a higher high, confirming uptrend structure.
Momentum Indicators:
Weekly momentum oscillators (RSI, MACD) are turning bullish. A close above $875 would confirm the momentum shift.
Volume Behavior:
The bounce from $800 occurred with increasing volume, suggesting accumulation rather than dead-cat bounce behavior.
🧠 Trader Psychology: Why Most Will Miss This:
Waiting for "Better" Prices:
Many will wait for a pullback to $850 after the $875 break. By then, momentum has shifted and risk/reward has compressed. The best entry is at the trigger, not after confirmation proves correct.
Fear of Being Early:
What if Sunday closes at $873? Then you don't enter—simple. But fear of "what if it fails" prevents traders from having a plan for "what if it works."
Wanting Certainty:
No setup is guaranteed. But a weekly close above $875 after holding $800 demand offers high-probability structure. Waiting for 100% certainty means waiting forever.
Leverage Temptation:
"If I use 3x leverage, I can make 90% instead of 30%!" This thinking blows up accounts. The patient spot holder survives to compound gains over time.
📈 Why BNB for Spot Portfolio:
Utility and Ecosystem:
Native token of Binance, the world's largest crypto exchange
Used for trading fee discounts (real utility, not speculation)
Powers Binance Smart Chain (BSC) ecosystem
Regular token burns reduce supply over time
Market Position:
BNB consistently ranks in top 5 cryptocurrencies by market cap. Established network effects and institutional recognition provide relative stability compared to smaller-cap alts.
Exchange Token Premium:
During bull markets, exchange tokens often outperform as trading activity increases. More volume = more BNB usage for fees = increased demand.
Risk Factors:
Centralization concerns (Binance-controlled)
Regulatory scrutiny of Binance exchange
Price correlates heavily with Binance's business success
Broader crypto market conditions affect all assets
📅 Timeframe and Expectations:
Entry Timing:
Decision point: Sunday's weekly candle close. No entry before confirmation, regardless of how price behaves during the week.
Target Timeline:
$1138 could take 4-8 weeks if momentum sustains
Previous highs could take 3-6 months if bullish cycle continues
This is a position trade, not a swing trade
Volatility Tolerance:
Expect 10-15% pullbacks even if the setup works. Spot positions can hold through these; it's why leverage is inappropriate for this timeframe.
🏆 Professional Position Management:
Entry Execution:
Wait for Sunday close above $875 (no guessing, no front-running)
Execute spot buy Monday morning
Stop loss below $800 (demand zone invalidation)
Position Sizing:
Tier 1 allocation: 3-5% of portfolio for high-conviction crypto position
Size according to distance to stop ($875 entry - $800 stop = $75 risk)
Calculate position size so $75/coin = 1-2% total portfolio risk
Profit Taking:
First reduction (1/3): $1138 target hit
Second reduction (1/3): $1300-1400 if momentum continues
Final position (1/3): Previous highs or trailing stop
This staged exit removes emotion and locks gains progressively.
📊 Risk Management Framework:
Stop Loss Placement:
Below $800 demand zone. If this level breaks on a weekly close, the bullish thesis is invalidated and the position must be exited.
Risk Per Position:
Entry at $875, stop at $800 = $75 risk per coin
If you can tolerate $1000 portfolio risk, buy ~13 BNB ($875 × 13 = $11,375 position)
If BNB hits stop at $800, loss = $75 × 13 = $975 (acceptable risk)
Reward Calculation:
To $1138: $263 gain per coin × 13 coins = $3,419 profit (3.4:1 reward/risk)
To $1400: $525 gain per coin × 13 coins = $6,825 profit (6.8:1 reward/risk)
This is why leverage isn't needed—spot returns are excellent with defined risk.
⚠️ What Could Go Wrong:
Sunday Close Below $875:
Setup doesn't trigger. No entry, no risk, wait for next opportunity. This is a feature, not a bug.
False Breakout:
Weekly close above $875 but fails the following week. Stop loss at $800 protects capital with controlled loss.
Broader Crypto Weakness:
If Bitcoin or Ethereum enter bearish trends, BNB will likely follow regardless of its individual structure.
Binance-Specific Events:
Regulatory actions against Binance exchange, leadership changes, or business disruptions could cause rapid price declines.
Demand Zone Break:
If price closes below $800 on weekly basis, the entire bullish thesis fails and position should be exited immediately.
📌 Key Takeaways:
✅ $800 demand zone held: Multiple tests defended successfully—strong hands accumulating.
✅ Sunday close above $875 is the trigger: Objective, emotion-free entry rule. Market either confirms or doesn't.
✅ $1138 first target offers 30% upside: Favorable reward with defined $75 risk to $800 stop.
✅ Tier 1 allocation appropriate: High-conviction setup deserves meaningful position size with proper risk management.
✅ SPOT ONLY absolutely no leverage: Volatility, timeframe, and risk management all dictate spot allocation for this setup.
⚠️ Important Disclaimers:
This analysis is for educational purposes and reflects a technical view based on demand zones, weekly timeframe structure, and risk/reward analysis. It is not financial advice or a recommendation to buy or sell BNB or any cryptocurrency.
Cryptocurrencies are highly speculative and volatile. BNB can decline 20-30% even if the weekly close trigger occurs. The $800 demand zone could fail, invalidating the entire setup.
Binance Coin carries specific risks related to Binance exchange operations, regulatory scrutiny, and centralization concerns. Position sizing must account for these crypto-specific and platform-specific risks.
The Sunday close rule is a disciplined approach, not a guarantee of success. Market conditions can change rapidly, and technical setups can fail even with proper structure.
Only invest capital you can afford to lose completely. Crypto allocation should represent high-risk portion of a diversified portfolio. Never use leverage on volatile assets unless you fully understand and accept the risk of total loss.
Always conduct independent research and consider consulting a financial professional. All cryptocurrency investing involves substantial risk of loss.
✨ Sunday Decision Point:
Will BNB close above $875 this Sunday? If so, are you prepared with your spot buy plan? Share your thoughts on the setup in the comments.
📜 Wait for structure. Execute with discipline. Spot only.

BTC – Inside Monday’s Range During a Holiday WeekWe are currently trading inside the Monday range, and given the holiday conditions, price action is likely to stay contained.
🎯 Base case:
Trading the range until it breaks makes the most sense.
With the bullish opening of the day and 0.5 retracement of the range holding, the most probable scenario is a sweep of Monday’s high.
However, once Monday high is taken, we also have resistance there. If we get a bearish daily open afterward, I would look for shorts.
These remain the highest-probability plays for me.
If we get a strong bullish close after taking Monday high AND hold above TWO, then something may be shifting. Until then, I’m keeping decisions strictly based on the scenarios above.

Bitcoin Daily Analysis #13 – November 17, 2025Welcome to another Bitcoin analysis — and apologies for the delay.
As we can see, our bearish scenario has strengthened, and on the daily timeframe, BTC has officially turned downward 📉.
It’s still unclear whether this move is just a correction wave or a full trend reversal, but based on the candle volume, there’s potential for deeper pullbacks ahead.
If Bitcoin reclaims the 106,000 zone and holds strongly above it, the bullish outlook can return 🔄📈.
But if we get rejected from this level once more, we can safely say the trend has shifted into a clear downtrend.
There’s solid buying orders around the 90,000 zone, and we need to see how price reacts there.
A break below this level would make the bullish scenario much harder to achieve 🚨.
Additionally, after building a consolidation box in this region — or waiting for clearer structure — there may be an opportunity to take a short position 📉🟥.
Disclaimer:
This content is for informational purposes only and does not constitute financial or investment advice. © DIBAPRISM
Larry D.Kohn

BTCUSD — RangeBTCUSD — Range Dilemma
🧭 Context
BTC attacked the daily volume low at 106 463.30 — precise hit, clean reaction, but no reclaim yet.
Price stalled under that zone through NY session, keeping structure heavy while the dollar impulse held firm.
The move reflects a controlled liquidity sweep, not yet a shift in intent.
📈 Technical POV
We’re parked at the 106 463.30 daily volume node, the structural hinge of the current range.
A close below confirms algorithms pressing the next leg lower.
If we reclaim and hold above, the path opens toward 111 629, the next liquidity magnet capped by a single-print zone.
Daily structure remains stretched; weekly bias still corrective.
🌍 Macro View
Dollar strength persists after the Fed’s “pause for now” tone and steady 4 % yields.
Global risk tone stays cautious — crypto remains reactive, not leading.
Until DXY cools off, BTC trades inside compression with limited directional clarity.
🎯 Plan
Patience first.
Wait for a 1-hour structure shift to confirm bias.
If the dollar corrects, BTC can rotate higher; if not, expect continued testing near the lows.
🧠 CORE5 Note
Professionals don’t chase noise.
They let structure prove strength before conviction follows.
Institutional Logic. Modern Technology. Real Freedom.

AVAX Ignites Bias: Long
Timeframe: 15-min (scalp to intraday swing)
Not a financial advice. Just sharing my personal setup and observations.
Always DYOR, manage your risk, and trade safe.

BEARISH SIGNATURES FOUND ON BITCOINI am probably the only bearish trader on Bitcoin despite my failed analysis on the break of the 21EMA on the weekly chart previously. I found some of my missed signals (last week there was a hidden Bull on the daily chart but hurrying to complete the analysis, I missed it and stuck to the initial bias which was costly ). I still think Bitcoin whales and Big players are manipulating the market to their advantage. All the price action around the Triple tops now shows their foot print. Whiles I acknowledge that I may be wrong again, I feel guilty if I don't share what I am seeing to signal caution to all who have dedicatedly followed my publications. I am sorry for those who feel let down as I can't always be correct.
So I see a bearish Bat harmonic pattern, I see a daily bearish shooting star candle in development, I am also acknowledging a Triple Tops pattern after $125,750 shorts liquidation. There is a chance for a pullback to $118k to find support and rally can go to estimated target of $143k or else I think the move up done.
The yellow line is trend line of where I think next Bitcoin rally will take off next if bears take control.

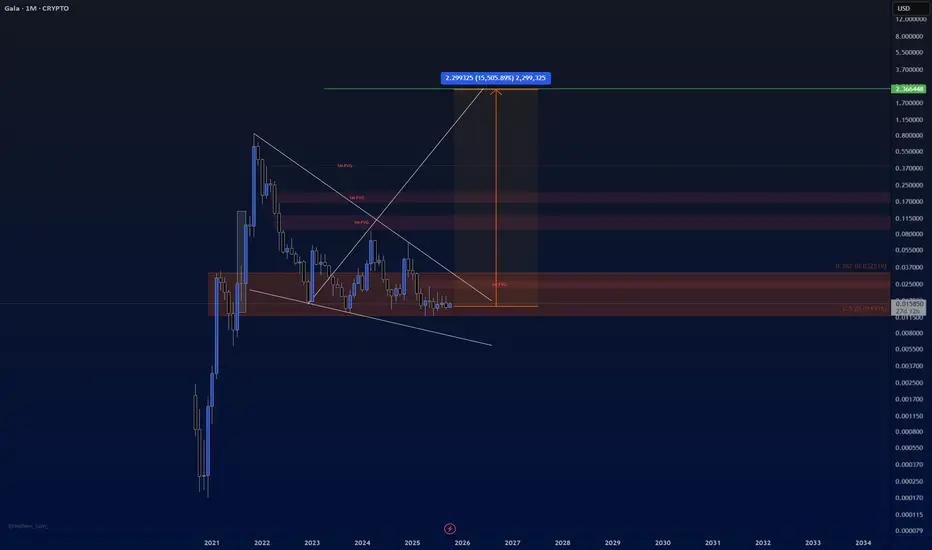
Gala To $2Gala the great crypto looks to be at great levels to purchase a huge load. We are aiming to break ATH and target $2 in 2026.
ANFIBO | BTCUSD on 09.17.2025 to 09.21.2025 I guess ???Hello guys, Anfibo's here! 👋
I think BITSTAMP:BTCUSD is bullish on the uptrend channel and still holding strong without any break. BTC may retest the support zone of $111.000 and re-reach the resistance levels of $123.000 and $127.000, and possibly up to $135.000.
Here's my setup:
✅ BUY SCALP: 110 - 111, SL 107, TP 122 - 126
❌ SELL SCALP: 126 - 128, SL 130, TP 120 - 114
Wishing my followers all the best <3

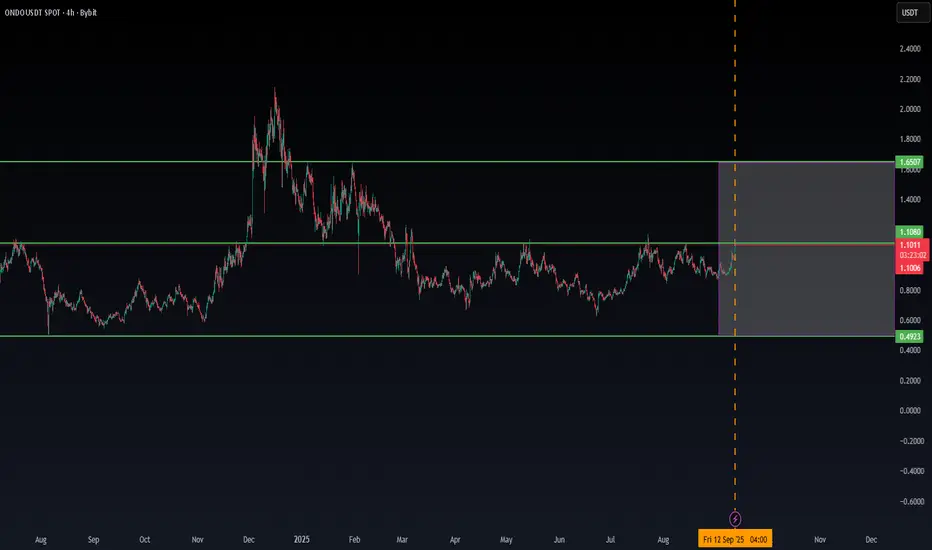
ONDO/USDT NEW INCREASE VOLUME💎Last data show that ONDO has the chance to break in the coming time on the low time frame.
We will follow up on this reason, ONDO to check for confirmations.
ETH/USD: Will ETH Crash Back to $3,800?Ethereum has demonstrated a strong bullish trend in August, with prices approaching key resistance levels. Analysts suggest that a sustained break above $4,800 could propel ETH toward $5,500–$6,000 by the end of the month.
Institutional interest remains robust, with significant inflows into Ethereum-based ETFs and increased holdings by digital asset treasury firms like Bitmine Immersion Technologies and Sharplink Gaming.
* Resistance Levels: $4,800, $5,000, $5,500
* Support Levels: $4,000, $3,800
* Key Indicators: Strong Relative Strength Index (RSI) and bullish Moving Average Convergence Divergence (MACD) suggest continued upward momentum.
Ethereum is poised for a potential breakout. A decisive move above $4,800, supported by strong trading volumes, could initiate a rally toward $5,500–$6,000. Conversely, a drop below $4,000 might lead to a retest of the $3,800 support zone.

BTC Triangle Squeezing Toward $100 K — Sellers Press🎯 TL;DR
A four-week contracting triangle is coiling price just under $105 K.
Measured move ⇒ $100 506
Both W.ARITAS Quantum RSI flash strong selling pressure while QSP shows a weak trend.
On-chain: miners dumped ≈30 000 BTC since late May, yet spot-ETF inflows have stayed positive eight days straight.
Base case: price breaks lower into $100 K-97 K, where I expect a sharp bounce.
🗺️ Chart at a Glance
Element Detail
Pattern Symmetrical / contracting triangle (late-Apr → present)
Immediate pivot $104 800 – reclaimed as resistance (red circle)
Target 1 $100 506 – triangle measured move
Demand block $96 900 – $95 000 – weekly support & June VWAP
Invalidation 6-h close > $106 000
🔧 Technical Internals
Momentum 🟣
Quantum RSI: −23 / −41 and falling → sellers dominate.
QSP: muted blue histogram sub-zero → trend itself is still weak, so expect whipsaws near support.
Structure 🔵
Three successive lower-highs (113 K → 110 K → 109 K) tighten the squeeze.
Price is riding the underside of the triangle, a common “kiss-of-death” before resolution.
🔍 Fundamental / Flow Backdrop
Miners on the offer – Wallet balances down ~30 000 BTC over 20 days (≈ $3.1 B)
Source: IntoTheBlock via CoinDesk, 19 Jun 2025
ETF demand refuses to quit – U.S. spot ETFs pulled $388.3 M on 18 Jun, marking 8 consecutive inflow days
Source: CoinTelegraph, Cryptonomist, 19 Jun 2025
Regulatory clarity incoming – U.S. Senate passed a bipartisan stablecoin bill on 17 Jun; House vote next
Source: Reuters, 17 Jun 2025
Net: structural sellers (miners, profit-takers) vs. structural buyers (ETFs).
Right now, technicals side with the sellers.
📈 Trade Map (3-8 Week Horizon)
106 000 – 104 800 Triangle top & failed breakout zone Bias flips bullish only on sustained reclaim
100 506 Measured-move target + psychological $100 K Primary TP / bounce watch
96 900 – 95 000 Weekly demand, June VWAP Secondary TP if 100 K gives way
110 000 + Pattern invalidation Opens road to 113 K-115 K ATH cluster
🛠️ Execution Idea (Not Financial Advice)
Trigger: 6-hour close < $103 500 confirms breakdown.
Entry Bias: Short retest of 104.8 K-105.5 K.
Targets:
TP1 – $100 500
TP2 – $97 000 (only if momentum stays bearish)
Stop / Invalidation: 6-hour close > $106 000 and Quantum RSI flips back to green.

Bitcoins Path?The is how I'm looking to play CRYPTOCAP:BTC over the coming years.
It is my belief that we completed Wave 1 of the SuperCycle and Wave 2 has just begun

SOL Charging Higher: Monthly VWAP Hold Sparks Bullish MomentumSOL/USD remains in a constructive up-trend on the daily chart, trading above its monthly VWAP and an ascending trendline that dates back to March 2025. This positioning tells us that buyers have been willing to pay above the long-term average price—and that momentum is intact despite a recent cool-off from overbought levels. Volume delta readings have been modestly positive, suggesting steady buying pressure without the explosive institution-level participation seen in prior rallies. The RSI recently topped 70 before pulling back into the 60–65 range, a healthy consolidation that keeps the broader bullish bias alive.
Trade idea:
• Build long positions on small pullbacks toward the monthly VWAP (around USD 165) or along the rising trendline (~USD 160).
• Target a breakout above USD 185—ideally confirmed by a significant uptick in positive volume delta—for a move toward the next resistance zone near USD 200–220.
• Place a stop-loss beneath the trendline (around USD 155) to cap downside at roughly 10–12%, while allowing for 15–25% upside.
Current sentiment:
The market is cautiously bullish. Buyers remain in control but without overextended volume spikes, indicating measured confidence rather than euphoric buying. Keeping entries disciplined around key support levels and waiting for volume-backed breakouts will offer the best risk-reward opportunities.
#Solana #SOL #Crypto

Bitcoin following 2013-2017 Fractal UPDATE - have we left it ?This chart remains unchanged from the last time I posted it except for the addition of that yellow Dashed Arrow
As we can see, PA fell below the Fractal in Late February and ever since, we have ranged further away from it.
Does this mean we have left the fractal we have been on since November 2021 ?
Not really.
PA fell below it in 2022 due to pressures from Interest rates making companies collapse and sentiment being negative.
We have fallen below it this time purely because PA was so overbought, it needed to recover.
This can be very clearly seen on the Weekly MACD, where in 2024, we ranged for months because of the same reason.
See how on the weekly MACD, how once we reached near Neutral, we bounced back up to a New ATH and, ever since, BTC PA has ranged while waiting for the MACD to cool off..
And now we are there. MACD is in the bounce zone and has shown some strength in the last few days.
So, The Fractal
For PA to get back above that Fractal, we need PA to make a very strong push higher. and as you can see from the Bold Arrow, this is achievable by end of May if PA rises Strong and continually
form here.
I am not to sure this will happen.
We have so many Macro events destabilising the markets...
I am more inclined to think PA will hit that circle , and we will likely follow the Dashed Arrow to a cycle ATH of near 300K, by the end of the year at the latest.
This is the Path of safety.
Things can always change for the better or for the worse and so we have to be ready for all occasions.
But BULLISH is the word - BUT BITCOIN ON SPOT, HOLD IT AND RELAX

TST COIN NEXT POSSIBLE MOVES AND TRADE IDEAS !!LSE:TST Coin!!
• Technically & Fundamentally its look bullish🫡
• if market get little bit stable then pottential bounce back expected❤️
• if you want then you can build small amount spot trade on it.. Stoploss will be only 0.065$ ( if daily candle close below this level)
• For add it in swing trade.. Its also a good buying price🫡
Warning : That's just my trade idea DYOR Before taking any action🚨

DeepBook/USDT in Uptrend: Ascending Channel Holds KeyThe DEEP/USDT chart is trading in a clear ascending channel, consistently forming higher highs and higher lows.
This pattern reflects sustained bullish momentum and suggests the uptrend is likely to persist in the medium term.

Potential for Further Price Growth to $6.50 After Pullback!Hey there, ✌ The price entered an uptrend phase from the $3.70 range and, following the breakout of the descending trendline on the daily timeframe, has shown a significant increase, reaching $5.70. Currently, after this upward movement, the price has faced a slight correction and has returned to the broken $5 level.
Given the overall market conditions, the outlook remains more bullish.
It is expected that after this pullback, the price will likely continue its significant upward movement towards the $6 and $6.50 levels. The price ranges of $5 and $4.50 – $4.20 can be considered key reversal zones. If a bullish candlestick pattern is observed and confirmed, there is a high possibility of positive price fluctuations.
💢 Please remember that this is just my personal viewpoint and should not be taken as investment advice. I’d love to hear your thoughts and share opinions!
Happy trading!✌😎
Sure, if you have any more questions or need further clarification, feel free to ask. I'm here to help!✌

Phemex Analysis #37: PNUT's Nutty Rally _ Can it Continue?PNUT, the aptly named "Peanut the Squirrel" coin, has taken the cryptocurrency world by storm. Launched on November 4th, 2024, PNUT has experienced a staggering 4659% rise, soaring from its initial price of $0.0521 to a staggering high of $2.431 on November 14th. This phenomenal growth has captivated investors and sparked speculation about the coin's future trajectory.
Possible Scenarios: Breaking Nuts or Bust?
Breakout Rise:
If the bullish momentum continues, PNUT could attempt to break through the current resistance level at $1.65. A successful breakout could pave the way for further upward climbs, potentially challenging previous highs at $1.87 and $2.20, or even establishing a new all-time high.
Indicators to Watch: Strong buying volume, positive social media sentiment, and continued media attention could be catalysts for a breakout.
Bearish Drop:
Despite the recent surge, it's important to remain cautious. The cryptocurrency market is notoriously volatile, and a correction could be on the horizon. If the price falls below the $1.26 support level, it could encounter further downward pressure, potentially reaching the $0.843 support level or even the $0.42 support level.
Indicators to Watch: A decline in trading volume, negative social media sentiment, and broader market weakness could trigger a pullback.
Trading Strategies
For Bullish Investors:
Buy Order: Consider a buy order when price breakout above $1.65 with strong volume.
Stop-Loss: Set a stop-loss order below a key support level, such as $1.26, to limit potential losses.
Take-Profit: Determine a take-profit target based on your risk tolerance and desired profit margin.
For Bearish Investors:
Sell Order: Consider a short-sell order if the price breaks below the current support level ($1.26) and bearish indicators emerge.
Stop-Loss: Set a stop-loss order above a key resistance level, such as $1.48, to limit potential losses if the price rallies unexpectedly.
Take-Profit: Determine a take-profit target based on your risk tolerance and desired profit margin
Conclusion
PNUT's recent performance has been nothing short of extraordinary. However, it's crucial to remember that the cryptocurrency market is unpredictable. By understanding the potential scenarios and implementing effective risk management strategies, investors can navigate the volatility and potentially capitalize on PNUT's future movements.
Tips:
Trade Smarter, Not Harder with Phemex. Benefit from cutting-edge features like multiple watchlists, basket orders, and real-time strategy adjustments. Our unique scaled order system and iceberg order functionality give you a competitive edge.
Disclaimer: This is NOT financial or investment advice. Please conduct your own research (DYOR). Phemex is not responsible, directly or indirectly, for any damage or loss incurred or claimed to be caused by or in association with the use of or reliance on any content, goods, or services mentioned in this article.

Small Cap Crypto Multi-bagggers: Don't miss out! RENUSD
RENUSD got up over 7% today. It is fast approaching it's 200EMA on a daily chart and currently sits at the 50EMA.
I think many of these smaller cap Crypto's will take off once they are soon above their 200EMA and many are already.
Disclosure: I already have a parcel of CFD's in RENUSD.
What exactly is RENUSD? From coinmarketcap.com see below.
Ren (REN) is an open protocol built to provide interoperability and liquidity between different blockchain platforms.
They get paid well for their blockchain service is my understanding.

Ethereum's Path to $4,200: Rising Channel Signals Big MovesHello, fellow traders! I'm excited to share my latest insights on Ethereum. Let's dive into the long-term trends and what they might mean for us in the upcoming months.
Current Market Structure
Ethereum's price is developing within a long-term rising channel, showcasing a series of higher lows and higher highs since 2022. This pattern indicates a sustained bullish momentum.
Key Support Level: $2,000
This level is crucial. Holding above $2,000 suggests Ethereum may continue to rise within the channel.
A breakdown below could signal a potential shift in the trend.
Potential Price Movements
Upside Potential:
If Ethereum remains in the rising channel, there's a strong chance we could see a move up to the previous all-time high (ATH) around $4,200.
Breaking above $4,200 might pave the way for new ATHs.
Resistance and Reversal Risks:
The previous ATH at $4,200 could act as a significant resistance point.
There's a possibility of a pullback from this level, potentially leading to a "stop-loss hunt" scenario that might drag prices down to the $3,400–$3,200 area.
My Outlook
I'm anticipating movement within the rising channel towards $4,200 in the coming months. At this key level, caution is essential. Considering taking profits or adjusting positions could be a wise strategy.
What do you think about Ethereum's current setup? Are you observing similar patterns or have a different perspective? I'd love to hear your thoughts!
If you found this analysis helpful, please give it a like and follow for more crypto insights. Best of luck to all the hodlers and traders out there!

BTC DAILY ANALYSIS
After shift market structure and rejection of ob ans fvg we will see a continuation to taken liauidity buyside we will see BTC in a new price
- Tading is probability control your risk management.
Good luck !

BitcoinThere have been several key moments in the past weeks that have changed the trajectory at times. There have been XRP Wins and there have been moments of FUD. BUT yet the scribbles are still doing their thing.
Plan is still taking shape and doing what we thought weeks ago.
