Solana Explosion: Will SOL Hit $183 or Crash Below $100?If SOL breaks above 144.77, next stops are 153.65 and possibly 183 on strong momentum.
But dropping below 130 could trigger a sharp slide toward the $100 zone—watch these levels!
Crypotrading

Will #XRP Make a Bullish Move or Is this Another Bull Trap?Yello, Paradisers! Are we about to witness a major #XRPUSDT breakout, or is this just another fakeout? Let’s dive deep into the real setup on the #XRPUSD chart:
💎#XRP is currently trading around $2.65, consolidating right below a critical resistance trendline. What’s building here is a textbook ascending triangle, and the squeeze is tightening fast and moving toward an inevitable breakout.
💎A clean breakout above the resistance trendline, especially if backed by increased volume and 50EMA continuing to act as dynamic support, will significantly raise the odds of a sharp move up. The first bullish target lies at $3.10 (moderate resistance). If bulls dominate, a fast continuation toward the $3.55 strong resistance is very much on the table.
💎However, and this is key, any rejection near the resistance without solid momentum could trap breakout traders. If #Ripple drops below the ascending trendline and loses the Support Zone near $2.37, the move will likely extend into the Key Demand Zone at $2.19.
💎Below $2.19? That’s where the bullish setup gets invalidated. We would then expect a potential full breakdown, creating a cascade of stop-loss triggers and panic selling. That’s not a dip you want to buy blindly. Bulls still hold short-term momentum, but the next few candles will decide everything.
Strive for consistency, wait for clear confirmations, and remember that discipline always beats chasing quick profits.
MyCryptoParadise
iFeel the success🌴

BTC/USDT — Holding Strength Above Low Time Frame, Eyeing 114K BTC/USDT — Holding Strength Above Low Time Frame, Eyeing 114K Zone 🚀
Bitcoin continues to show positive structure, trading above the low time frame support and aligning with the broader uptrend momentum.
The recent stabilization and gradual rise in volume indicate that buyers are maintaining control, keeping BTC in a constructive phase toward the $114,000 target zone.
As long as Bitcoin sustains above $109,700–$110,000, the trend remains bullish, with higher-timeframe confirmation aligning in favor of continuation.
📊 Technical Overview:
Support Zone: $109,700 – $110,000
Resistance Target: $114,000
Trend: Positive continuation above low TF
Bias: Bullish
Momentum and volume remain healthy — suggesting BTC could attempt another push into the 114K region if current structure holds.
📈 Outlook: Uptrend continuation
🎯 Target: $114,000+

PUMPBTC showing signs of reversal_Watch for short term upsidePUMPBTC has touched its bottom and is now showing signs of recovery. A short-term bullish move is likely if momentum continues to build.
Always manage risk wisely and wait for confirmation before entering.

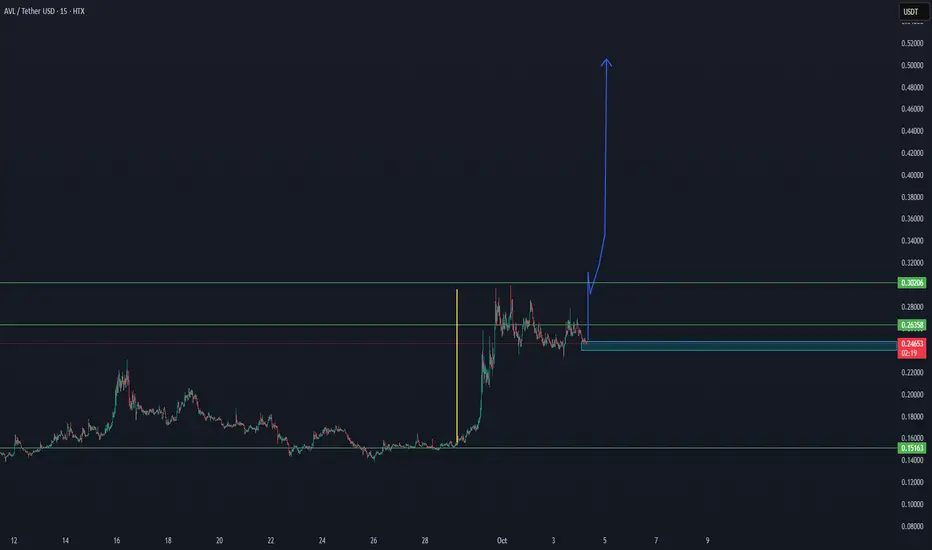
AVL ON WAY TO THE TARGET $0,50 - UPDATE 04-10-2025📊 AVL/USDT Update
AVL is consolidating above key support and holding structure, with price currently around $0.24.
✅ Support around $0.26 – $0.24 is holding.
✅ As long as this zone remains intact, momentum favors another bullish leg.
📈 The next major resistance sits at $0.30, and a successful breakout from there opens the way toward the $0.50 target.
⚡ Outlook: Structure is bullish, and the chart suggests AVL could push to $0.50 in the coming cycle if momentum continues.
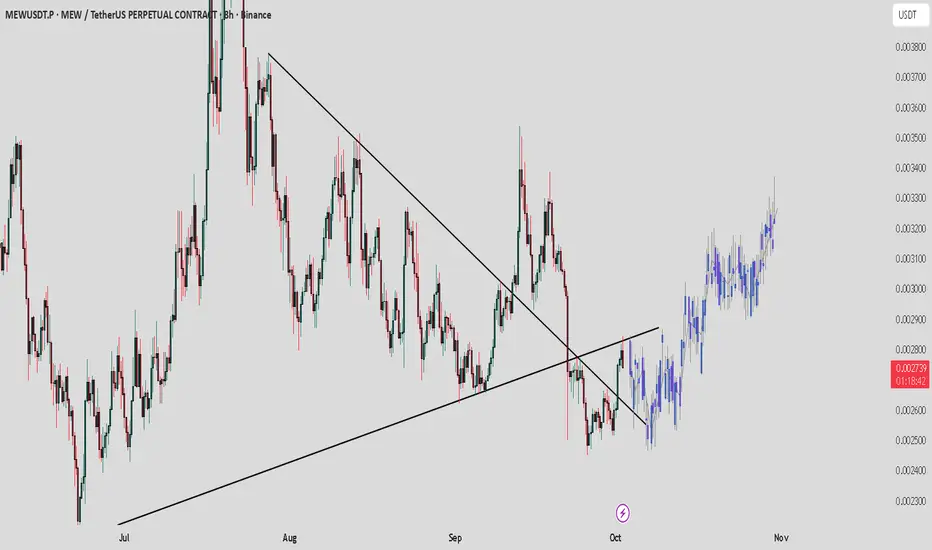
MEW / USDT : Bullish setup , Watching retest for next leg upMEW / USDT Breakout confirmed from the descending trendline. Price is retesting the demand zone, and as long as this support holds, we can expect bullish continuation towards higher levels. Breakdown below the zone will invalidate the setup.
Bitcoin Free Value Gaps UPDATE - near filled next level down
As mentioned previously, these are traditionaly used to find Entries into a market and so far, this has been the case again.
We have dipped to 112K so far and as yu can see, we can go to 103K with ease, should this be allowed by the Bulls.
I will say, the SOPR (Spent Output Profit Loss ) chart has offered a Bull wanting caution flag..
And yet, on the lower time frames, it has just also posted a Good Bull entry point.
This indicates Excellent entry points, Buying opportunities
Yes, PA may drop lower yet, but not massive ones.
It is an excellent example of ow to "Scale in"
Do not use all your money in one trade. Use 20%, wait, see where thelmarket goes. Buy again when ready.
This way, once your lowest Buy price goes into profit, it also starts to cancel out he losses on the other, higher priced Buys....and by the time all your recent buys are in profit, you are exponentially getting better profits.
For me, I am waiting to see if we arrive at the 110K zone before starting this, once the current FVG is filled.
Have a noce sunday

Bitcoin Bounce Alert: Holding the $100K Fortress! 📉 Market Context & Technical Levels
Key support at ~$100K: As the chart shows and multiple analysts confirm, this level continues to act as a strong defence zone. Cointelegraph noted bulls have been “defending the $100K key support level strongly,” triggering bounces during dips
Descending channel overhead: Bitcoin has retraced into a downward channel. A clean breakout above ~107K–109K (past recent peaks) is needed to signal a bullish shift .
Liquidity target at ~106K: Plenty of orders await in that region—flipping it to support may pave the way for another push higher .
📊 Indicators & Momentum
RSI dip near 25 during the latest drop indicates oversold conditions—often a precursor to rebounds
.
Volume surge on rebounds suggests absorbing sell pressure and strong accumulation interest at lower levels.
🚩 Key Price Zones to Watch
Level Significance
$100K Crucial support; losing it risks a slide toward $95K–97K or even $92K
.
$105K–106K Liquidity zone; flipping here as support could confirm upward momentum .
$107K–109K Resistance from channel tops and prior highs; a successful break is key to next leg up .
$112K–$112K+ If breakout occurs, upside targets extend toward prior ATH near $112K and beyond .
🎯 Chart Analysis Summary
Your chart shows three distinct bounces from the $100K–100.7K supply zone (highlighted in blue) and the latest one includes a sharp wick and rebound. This aligns with broader market dynamics emphasizing support at $100K and building liquidity at $106K. The arrow projection signals a probable retest of ~106K, with room to challenge ~107–109K after consolidation.
🧭 Trade Outlook
Bullish scenario: Hold above $100K → reclaim $106K → trendline breakout → potential rally to $112K+.
Bearish risk: Fails support at $100K → breakdown toward $95K–92K region.
📌 Bottom Line
Support $100K is alive and well. Bounces have been crisp and volume-backed.
Next test lies at $105–106K. That’s the battleground—flip it, and we may see bitcoin reclaim recent highs.
Watch the channel overhead (~107K–109K). A breakout could open the door to fresh records.
✅ Conclusion: BTC is defending its psychological base firmly. If this zone holds once more, the path to $106K and beyond is in focus. Breaking above demands conviction, but it’s the pivot to watch.

JASMY Long Swing Setup – Oversold Bounce from Major SupportJASMY has seen a sharp decline in recent weeks, but price has now landed in a key support zone. With a potential bounce on the table, we’re eyeing the $0.015–$0.01355 range for a possible long entry toward resistance tests.
📌 Trade Setup:
• Entry Zone: $0.015 – $0.01355
• Take Profit Targets:
o 🥇 $0.020
o 🥈 $0.024
o 🥉 $0.030
• Stop Loss: Daily close below $0.013

KASPER - THE GHOAST OF KASPA (TA + TRADE PLAN) BY BLAŽ FABJANTechnical Analysis for KASPER (KASPER/USDT) by Blaž Fabjan
Trend Analysis:
The chart indicates a rising wedge pattern on the horizon, a bearish reversal signal, which suggests a potential downward price movement after the completion of the pattern.
The price is currently in a consolidation phase, with a series of lower highs and higher lows within the wedge structure.
Support and Resistance Levels:
Resistance: The price has approached a resistance zone around the Wick High level, which indicates selling pressure in this area. A breakout above this resistance level could lead to a continuation of the upward trend.
Support: The Strong Low zone is acting as the lower support for the current price action, with buyers attempting to defend this level.
Indicators:
RSI (Relative Strength Index): Currently at 82.43, which is in the overbought territory, indicating that the asset may be overextended and susceptible to a pullback or correction.
MFI (Money Flow Index): The current MFI reading suggests an inflow of capital into the asset, indicating that the buying pressure is strong. However, if the price hits the overbought region, it could signal a reversal.
Stochastic: The stochastic oscillator is at 96.19, indicating that the price is in an overbought condition and might be due for a pullback or consolidation in the short term.
VMC Cipher B Divergences: The indicator is showing bullish divergence at the recent lows, suggesting that buying pressure could continue, but it needs to be validated by a breakout above resistance.
Volume:
The volume is gradually increasing, which is a positive sign for the continuation of the trend. However, volume spikes during a breakout are crucial to confirm the trend's strength.
Trading Plan for KASPER (KASPER/USDT)
Key Entry Levels:
Breakout Entry: If the price breaks above the resistance zone near 0.00001000, consider entering a long position. Set the take profit target at around 0.00001500 (strong bullish continuation level) for a potential 50% price increase.
Reversal Entry: If the price fails to break the resistance and starts falling towards the Strong Low support level near 0.00000500, consider entering a short position. A move below the Strong Low could signal a reversal of the current uptrend.
Stop-Loss and Risk Management:
Long Position Stop-Loss: Set a stop-loss just below the Strong Low (around 0.00000450) to protect from a sudden price drop. The stop should be tight as this asset is volatile.
Short Position Stop-Loss: If entering a short position, place the stop-loss above the resistance level at 0.00001050 to minimize losses in case of a breakout.
Target Levels:
Short-Term Target (Bullish): If the breakout occurs, consider targeting a price of 0.00001500 based on the rising wedge pattern's projected price target.
Short-Term Target (Bearish): If the asset fails to hold above the support zone and breaks lower, target the 0.00000350 level as the next potential support area.
Trading Psychology:
Patience: This is a volatile asset, and it's important to wait for clear confirmation of a breakout or breakdown before entering the trade.
Risk-Reward Ratio: Aim for a 1:3 risk-reward ratio, which ensures you are risking less compared to the potential reward on each trade.
Monitor Indicators: Regularly monitor the RSI, Stochastic, and MFI for overbought or oversold signals. Additionally, follow volume patterns closely to gauge market momentum.
Exit Strategy:
Exit the position once price targets are reached or if indicators show signs of an exhaustion or trend reversal (e.g., RSI turning downward from overbought levels, stochastic crossing down).
Given the current chart formation and technical indicators, KASPER could be poised for a breakout to the upside, but there is a high risk of a correction given the overbought conditions.
Caution is recommended: monitor price action closely and adjust your strategy accordingly to avoid entering too early in a rising wedge or an overbought market.

ZEC ANALYSIS🔮 #ZEC Analysis
🌟🚀 As we said earlier #ZEC moved around 20%. Right now #ZEC is trading in an Ascending Triangle Pattern and here we can see that #ZEC moving again towards its neckline. We see see more bullish move in upcoming days
🔖 Current Price: $36
⏳ Target Price: $46
⁉️ What to do?
- We have marked crucial levels in the chart . We can trade according to the chart and make some profits. 🚀
#ZEC #Cryptocurrency #Breakout #DYOR

$TON Price Surge: Can Grok AI Drive the Next Breakout?Elon Musk’s confirmation of Grok AI’s integration into Telegram is a game-changer for Toncoin, enhancing the utility of projects built on the CRYPTOCAP:TON blockchain. This news coincides with TON’s recent breakout from a falling wedge, signaling potential bullish momentum as it approaches the critical $4 resistance level. A decisive break above this mark could push the price toward $5.55.
Market sentiment remains optimistic, with Toncoin’s Open Interest reaching $176.23 million. However, liquidation data reveals more long positions being wiped out than shorts, indicating volatility and potential corrections. While bullish sentiment prevails, traders should watch for sustained support above $4 to confirm TON’s continued rally.

Dogecoin longif you want to trade dogecoin here's my trade:
entry price .0.21737
Stoploss: 0.21508
target profit: 0.72 or 1.41 or higher

Bitcoin’s Price Squeeze—What’s Next?Bitcoin (BTC) is currently consolidating within a marked accumulation zone after facing resistance near its all-time high (ATH). The price is fluctuating within a broad range of approximately $17,800, indicating a phase of indecision between buyers and sellers.
The key observation is that a previous resistance trendline has now flipped into support, showing a potential shift in market sentiment. Additionally, the 100-day EMA around $93,458 is providing dynamic support, reinforcing this bullish structure.
The key support zone (highlighted in green) remains critical; as long as BTC holds above this area, the bias leans bullish. A breakout above the accumulation range could trigger a strong upward move, potentially retesting the ATH. Conversely, if BTC loses the support of both the trendline and the 100 EMA, it may lead to a deeper correction toward lower support levels.

BNB Near ATH: New Highs on the Horizon?CRYPTOCAP:BNB is currently trading above a key support zone and the rising trendline.
It is just below its all-time high (ATH) levels, and we are anticipating the possibility of a new ATH from the current levels. Keep a close watch for further bullish momentum.
DYOR, NFA

Polkadot (DOT)Comprehensive Analysis of DOT
📊 Comprehensive Analysis
🔍 General Overview
The DOT cryptocurrency, after experiencing a prolonged downtrend, entered a descending channel but recently broke out of it to the upside. Currently, the price is retracing to test the broken channel's trendline while facing a critical weekly resistance zone (red area). The high trading volume in this zone suggests increased investor activity and the potential for the uptrend to continue.
🕰 Weekly Timeframe Analysis
🔸 Current Situation
Breakout from the Descending Channel: The price successfully broke above the long-term descending channel with strong volume.
Weekly Resistance: The price is now encountering a key red resistance zone, a critical level for determining further movement.
🔸 Bullish Scenarios
First Target: If the price stabilizes above the red zone, the next target could be the all-time high (ATH) of DOT.
Parabolic Move: Market excitement and the breakout of key levels may trigger rapid upward movement.
🔸 Risks
RSI Divergence: The RSI indicator indicates overbought conditions. The price may encounter resistance near the top of the RSI channel, potentially leading to a correction.
📈 Indicator Analysis
🔹 RSI (Relative Strength Index)
On the weekly timeframe, RSI is nearing overbought levels.
A breakout of the RSI's ascending channel top could trigger further bullish movement.
🔹 Volume
Increased trading volume during the channel breakout validates the upward move.
🎯 Price Targets
Short-Term Target: Testing and stabilizing above the red zone resistance.
Mid-Term Target: Achieving the all-time high (ATH).
Long-Term Target: Reaching over-extended RSI levels.
💡 Summary and Final Notes
Technical analysis indicates that DOT is well-positioned for a bullish continuation. However:
Breaking key resistances (red zone and the RSI channel top) is critical.
Failure to break these levels might result in corrections toward lower supports (midline of the channel or weekly support).
📌 Recommendation
Always apply proper risk and money management, and ensure your decisions align with personal research and due diligence.

APT Long Spot Trade (Retest of Breakout)Market Context: APT has shown strong momentum with an impressive breakout beyond its accumulation range. We are now looking for a retest of the former resistance zone ($9 - $10), expecting this level to hold as new support for the next leg up.
Trade Setup:
Entry: Ladder into a long spot trade between $9 - $10
Take Profit:
First target: $16.5
Second target: $19
Third target: $26
Stop Loss: Daily close below $8
This setup aims to capture further upside as APT establishes support at the retested level. #APT

NZDUSD BUY | Idea Trading AnalysisNZD/USD is falling towards a support level which is a pullback support and could bounce from this level to our take profit.
We expect a decline in the channel after testing the current level which suggests that the price will continue to rise
Hello Traders, here is the full analysis.
I think we can soon see more fall from this range! GOOD LUCK! Great BUY opportunity NZDUSD
I still did my best and this is the most likely count for me at the moment.
-------------------
Traders, if you liked this idea or if you have your own opinion about it, write in the comments. I will be glad

CPOOL/USDT Breakout From Symmetrical Triangle is Imminent 👀🚀💎Paradisers, let's dive into the recent market developments for #CPOOLUSDT, which are signaling a significant change.
💎Currently, #ClearPool's price is tightly consolidated within a symmetrical triangle, hinting at an imminent breakout. If the breakout is upward, it will indicate a bullish trend reversal, potentially leading to a surge and capture of significant sell-side liquidity.
💎However, if the breakout moves downward and faces rejection at the upper resistance, this would indicate a shift towards a bearish trend, potentially causing the price to revisit key support for renewed bullish momentum.
💎The key support zone is critical for $CPOOL. If the price maintains this level, it presents a prime buying opportunity, possibly leading to an upward bounce. Should #CPOOL break below this support, the next possible stop is the high-demand area below.
💎If it slips below this demand area, it will point to a more extended bearish trend. Stay alert and focused as we watch the changing dynamics in the #CPOOL market.

Eth Elliott wave count still on path.If you find this information inspiring/helpful, please consider a boost and follow! Any questions or comments, please leave a comment!
Need an impulse up here to complete the wave 5 of this bullish variant.

CFX/USDTWe expect an bullish movement to the point specified in the chart as a target. We are waiting...

You down with ARB? Yeah you know me!If you find this information inspiring/helpful, please consider a boost and follow! Any questions or comments, please leave a comment!
My views on arb.
Not financial advice, do your own research.

BTC aims to break through the 66.8K barrier to continue
- BTC/USDT remains below the 0.786 Fibonacci level (66.8K), but buyers of the mother cryptocurrency defend the psychological level of **65K**.
- On the daily chart, we have observed that after reaching its all-time high at 73.8K and being rejected, the price has not managed to return to those levels. Instead, it has created a lower high at 71.8K.
- The outflow of funds from Bitcoin ETFs and significant liquidity absorption by medium-term market participants have led us to this waiting and consolidation period.
- Currently, the BTC/USDT price is trading around 66.5K, finding support at the 64.9K level (35-day EMA on the daily chart).
What to Expect in April for BTC Price?
To assess what will happen in the month, we need to look at higher timeframes, such as weekly or monthly. Regarding the weekly candle, it closed at **71.3K** (the highest weekly close in history). However, despite being a bullish close, BTC has returned to seek liquidity in the **65K** zone. To confirm weekly bullish continuation, we need to close above at least **70K**.
As for the monthly candle in April, it has started in red, indicating bearish strength. However, if we look back at BTC's price history, in most cases, when we start the month in red, the monthly candle has always closed in green during bullish times. In this plausible scenario, especially considering the halving month, the idea that BTC could reach **80K** or even more is not far-fetched .
THIS IS NOT INVESTMENT ADVICE NOR SHOULD IT BE TAKEN AS SUCH. EACH PERSON IS RESPONSIBLE FOR THEIR ACTIONS AS A TRADER, INVESTOR, ETC…
