OMG Bitcoin!!! ... It is a lot less confusing than you all thinkI see so many people geeking about the direction. Its up. Maybe some down, but mostly up. Reasoning is on the graph. Namnaste'
Crypotrading

Total crypto predictionI'll keep updating every 2 days or so.
I'm very open to talk to so post your comments down below please.

Litecoin to $185? Here's How!In my previous analysis I thought we might have already complete the Impulse Waves of Elliot Wave Theory (EWT) however after digging in a little more, this count is perfectly accurate with EWT and would see LTC hitting $160-$185 by September.
This is not trading or financial advice, just one of the many outlooks. Let's see which count is correct!
For more posts like this please hit that thumbs up button! It really helps and is appreciated! Thank you!
To learn about Elliot Wave Theory, and to see how this is within what is acceptable of EWT, you can choose to go here! elliottwave-forecast.com

BTCUSD - Crypto Trading | BUY positionBased on Volume level and price action, I believe the bitcoin will get back to the level $13,000 while for the long term there is a potential of reaching the level $17,000

BTCUSD Inverse Head and Shoulders Hello Traders,
New Thesis on BTC,
Points to consider here are,
- Potential Inverse head and shoulders pattern playing out
- RSI on an upwards trend
- Right shoulder volume declining, which is common in H&S patterns
- Neckline has been acting as strong resistance, high volume move imminent
- VPVR showing low volume of transactions after resistance
BTC needs to break this neckline with strong volume, if this break out occurs, its more likely that BTC will test yearly highs
What are your thoughts? Please leave a like and comment
and remember,
“What seems too high and risky to the majority generally goes higher and what seems low and cheap generally goes lower.” -William O'Neil


Weekly Momentum Analysis On Major Pairs (Wk20/2019)XXX/USD: Slight Bullish
Gold & Silver: Mixed (Silver is bearish while Gold is slightly bullish)
XXX/JPY: Very Bearish
Indexes: Very Bearish
BitCoin: Very Bullish
Post Scriptum: This analysis is for “general overview only” as it is solely based on price action. That’s why it is called momentum analysis in the first place. Support/Resistant, Volume , Macro nor any other factors are not used during write up. Refer to the individual pair analysis for a more comprehensive write up.

Tron ~ Break Support line and retest for downtrend Hi Folks,
I see Tron only keep going down. Till reach second Support Line.
Where you can see arrow pointing down -> that's retest that zone and going it is own direction ( Down ). Also Fib ext hit it nicely so for time been I think we will be going down.
We might see some push upsite, but that would be just Retracement. Until we see string confirmation on 1D chart I am Bearish :-(

BCHXBT Kraken~ This is how I think, might play outHi Folks,
Bitcoin Cash falling like no tomorrow. I think where is Demand Zone from there we might see trend Reversal. If not it will go to the second demand Zone.
I would not be even surprise if we see bit Pin bar to go through two demand Zones.
Don't set Buy order and wait for confirmation. As we have falling almost on all of coins and we made Lowest Low.

Bitcoin Price Prediction:BTC/USD is a step away from $6000 retun 1. Bitcoin price in the second half of trading on Wednesday is trading in the green, holding gains of 0.22%, as the bulls resume buying pressure.
2. BTC/USD is making strong progress towards a return of the $6000 territory.
BTC/USD bulls are moving gradually through the sticky supply area of $5500-600 range. They need just one final push and the price could very quickly return back up to the $6000 territory.
**BTC/USD short time sell target 5170 and 5080 Area and Other side of long Buy 5060 level . 5060 level H4 200 ma Moving Average so good position for buy , target 5500/5650 and finally 5830 Area.
The largest digital asset was trending sideways between $5,100 and $5,200 prior to Tuesday breakout. Technical levels remain intact in spite of Bitcoin failing to move past $5,350.
3. BTC/USD bulls try to hold the ground above critical support.
4. The critical resistance lies with $5,500.
High: 5219.93
Low: 5129.19

Ox We will dip little more Hi Folks,
Most of the trades are pretty well done.
We will dip more to get to support levels and Demand Zone.
There is a lot of orders to be filled and we will see rebound or trend reversal.
If you like my analysis - HIT THE thumb up :-)
Thank you!

Zooming out 1hr timeframe, possible price action scenarios.Observations:
- BTC has been traveling between a 2% price range for about a day and half.
- Currently being rejected from 4HR exponential moving averages.
- Daily volume dropping, possible bear flag formation.
BTC is currently traveling within a $100 range (5k to 5.1k) zooming out can give us a better picture of where the price might go depending on the type of break we get.
Game plan & possible scenarios:
Maximum risk R:1 = .1% account value
Seeking a minimum RRR of 2:1
A break below 5k might have us retest the bottom of the channel that we are currently traveling in around the low 4.8K area, giving us a good entry if support holds and price doesn't break below dotted red line(stop loss below), we might be looking at a possible bounce towards the top of the channel 5.4k area... If price is not able to get above the exponentials in the 4hr I believe that our possibilities to break 4.8k level will increase, pushing BTC to the lower channel, and confirming the daily bear flag. (Please keep in mind we are currently traveling above daily exponentials and they can at as support)
Taking this into consideration I only feel comfortable entering a trade in BTC off support, taking a break out with this volume increases the odds of being faked out, unless the bulls break the 5.1k and price gets above the 4hr exponentials, even after that I did not obtain a 2:1.
The only breakout I am currently interested will be a break above 4.5k with heavy bull volume behind it.
Please keep in mind this are all hypothetical scenarios.
Disclosure:
Please keep in mind that this are simply my ideas on the market, I am in no way shape or form qualified to give anyone any financial advise. All I'm looking for is to become a better trader with time and the only way too do this is to post what I am looking at and take criticism from those of you that been doing this for a very long time, having said that please feel free to call me out on any mistakes, or incorrect analysis the best way to learn is from each other as a community.

XRP ready for a bull run?Its safe to say the crypto world is here to stay and it looks like the market is ready for a BULL run. Here on the XRPUSD crypto pair i have identified an extremely exciting long opportunity. I don't think price will ever be this low again for the history of the pair. So I am definitely looking for to a rally.
In my analysis using the fibonacci tool I have reason to believe this pair has found the floor of 2019. I am seeking new record highs soon to come here for the XRP currency over the next few weeks. I even see $.40 or higher on the table. Take a look at my analysis and give your feedback.
The uRBAN genIUS

Weekly Momentum Analysis On Major Pairs (Wk16/2019)XXX/USD: Slight Bullish (EU is more bullish than GU)
Gold & Silver: Bearish
XXX/JPY: Very Bullish
Indexes: Slightly Bullish
BitCoin: Very Bullish
Wk 16/2019 (13 Apr 2019)
Post Scriptum: This analysis is for “general overview only” as it is solely based on price action. That’s why it is called momentum analysis in the first place. Support/Resistant, Volume , Macro nor any other factors are not used during write up. Refer to the individual pair analysis for a more comprehensive write up.

Populous going up 1;2 RRHi Folks,
This trade is just for you and for education only. I like to use price action only.


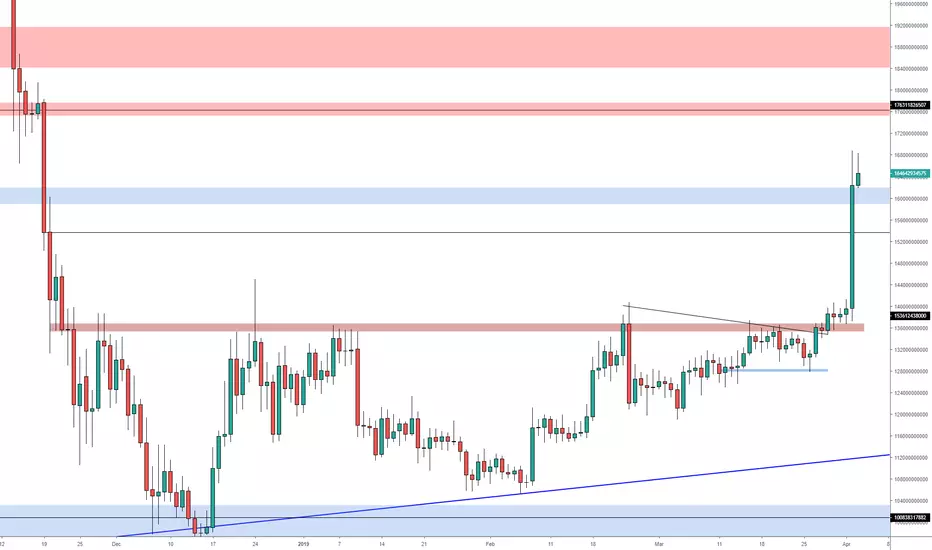
Total Cryptocurrency Market Cap Analysis Yesterday after holding the 136b support and closing above the 3 day range, we finally broke through the 140b level and surged higher. This being the total market cap gives you a sense of what the overall market was doing. Giving no regard to the 145b and 150b minor resistance region, we continued higher and closed above the crucial 160b level. Which ended up 16%+ for the daily session.
For now it is difficult to determine the next short term move, after such a dramatic movement. Which is why I usually step back from the charts and let the market breath for a day or 2 before re entering any margin trades. However the medium term bias for the time being is still bullish, especially after a strong close across the board as shown on the total market cap.
As long as we remain above the current 160b support level I believe we should see a continuation to the further upside targets at 175b and 188b. However if we do lose the current support I believe a retest lower to the 155b price level is orderly and healthy for higher price discovery.
*This is NOT financial advise and intended for educational purposes only*

BTC Weekly consolidation on its way? Trading Style: Swing trading 4hr/Daily/Weekly
Observations:
Weekly Chart:
Doji at the top of the trend confirmed, by price trading below $3915 increasing the odds of a period of sideways trading or a market pullback in the following weeks.
BTC last weekly higher low $3337.87, BTC has grind its way all the way to the exponentials without establishing a new weekly higher low, there's a lot of room to work with.(keep an eye on 200SMA to act a a possible support for a new higher low)
Declining bull volume for the past 4 weeks indicating bulls are tired.
Seems like the odds are favoring the bears as of now, a weekly pull back to set a new higher low its clearly on the way. There's a clear shift in momentum in the daily and 4hr time frames that strengthen this point of view in my opinion.
Daily:
Uptrend has been lost currently setting lower highs and lower lows, confirming weekly pullback has begun.
Possible H&S formation taking place neckline around $3771
Very weak bounces after pullbacks, bulls not buying the dips aggressively, opening the door for bear flags in the Daily & 4hr time frames, keeping in mind that most likely the EMA12 & 26 will act as resistance if playing this type of bounces, I'll be taking profit as soon as price reaches them. (not currently interested in playing 4hr bear flags)
Possible Play:
The only trade I am currently interested is the possible H&S pattern on the daily chart, neckline around the $3770 area which also in previous scenarios has played as a clear support/resistance in the 4hr time frame.
I'll be looking to scale in my position during 1hr or 4hr oversold RSI levels (around the green box) with a tight stop loss below the neckline, looking to play a quick 2 or 3 day swing.
Please keep in mind that H&S like any other pattern don't always break to the downside but rather ''most likely" break to the downside, but unless volume and the charts tell me otherwise I'll keep this as my only clear play at the moment.
Disclosure:
I am in no way shape of form qualified to give any financial advise, this are simply my ideas and my personal observations. I believe that the best way to learn is to put your thoughts out there and hopefully learn from those that have been doing this for a long time, having said that please feel free and call me out in any mistakes, or things that I am overlooking.. Constructive criticism is very much welcomed, no better way than learning as a community.
Happy trading everyone!!

BitCoin BTC/USD (Calm Before the Storm)View On BTC/USD (15 Mar 2019)
It is now in the BIG side way range = there will be explosive MOVE to follow soon.
I expect the UPSIDE as long as the price fails to break $34,00 level strongly.
$4,200 and $4,500 will be the next resistant levels.
DYODD, all the best and read the disclaimer too.
Feel Free to "Follow", press "LIKE" "Comment".
Thank You!
Legal Risk Disclosure:
Trading foreign exchange or CFD on margin carries a high level of risk, and may not be suitable for all investors.
The high degree of leverage can work against you as well as for you. Before deciding to trade foreign exchange you should carefully consider your investment objectives, level of experience and risk appetite.
The possibility exists that you could sustain a loss of some or all of your initial investment and therefore you should not invest money that you cannot afford to lose.
You should be aware of all the risks associated with foreign exchange trading, and seek advice from an independent financial advisor.
DISCLAIMER:
Any opinions, news, research, analyses, prices or other information discussed in this presentation or linked to from this presentation are provided as general market commentary and do not constitute investment advice.
Sonicr Mastery Team does not accept liability for any loss or damage, including without limitation to, any loss of profit, which may arise directly or indirectly from use of or reliance on such information.

OBV broke out of its long term resistance.if only it holds!BTC broke out its long term OBV resistance. If it holds we should see interesting movements within coming months.
Cheers
DYOR
MM67Trader

BTC Weekly - Finally Showing Signs of LifeLet's not get too excited. This recent move up is by no means an established trend...BUT we have a positive MACD for the first time in forever, volume is increasing, and trendlines are being tested. If this is the real deal, we will likely bounce off of a number of resistance and support levels before smashing upwards. These peaks and dips would provide longer-term traders the chance to sell and rebuy more multiple times on the way up.
The 4,000 psycological barrier is the first obstacle in the way, followed by the convergence of the 50-week EMA and downward trendline resistance above that.
Gaming things out this far in advance is by no means a prediction. This whole thing could become invalid is we reject hard off of 4000 and retest yearly lows.

ETHBTC Reversal?ETH showing signs of strength!
ETHBTC has made a clear higher low on the daily and we are still currently sitting withing a highly traded range on the profile. We are testing this .0380 resistance as we speak and the bulls need to break through this and close above to prove they are in control, however if we don't break this resistance then I expect a move downwards again. A higher high would be great for confirmation then I have indicated some entry points for that.
