Pro future analysis for BTCUSDI feel like the highest posibility is that it will break the channel and continue with its trend, but be prepared it may continue down as well.
Crypto-analysis

ETH 15m chart predictions (Very IMPORTANT) General analysis for Ethereum-Usd pointed very Important points

LINK/BTC HAS BOTTOMED! BUY NOW?I personally think LINK/BTC has bottomed and I’ll be adding some here for my spot holdings.
(SPOT trade🚨)
TP1 = $0.00104 🎯
TP2 = $0.001692 🎯
TP3 = $0.00303 🎯
Trade safe ~ BYA

BITCOIN Technical Analysis! Buy!
Hello,Traders!
BITCOIN has pulled back from the all-time-high
And the pair is trading in what seems to be a falling channel
Etching closer and closer to the 50-52k deamand area
Where, I belive the market participants will be adding to their longs
And after the breakout from the channel
I believe BTC will go up and retest the All-Time-High
Buy!
Like, comment and subscribe to boost your trading!
See other ideas below too!

Daily Crypto Market Update - Showing Bullish Signs Again - OXTIn this video:
A discussion of the overall crypto market sentiment
A discussion of future price action
A look at the altcoins market
Is sentiment beginning to turn bullish again?
Orchid OXTUSD charted with levels for paid subscribers at substack

Bitcoin holding its groundBTC operating in a nice upward trendline after creating a double top. We can see from the fib retracement a respect of key levels... Usually you can measure the next move by measuring the size of the first impulse but I am not going to Indulge in speculation on BTC long term targets lol. A break above current ATH's is almost inevitable in my eyes..

$VRA $0.10 INCOMING?!Here is my analysis on Verasity, great coin to hold onto will do really well. Let me know what you think.

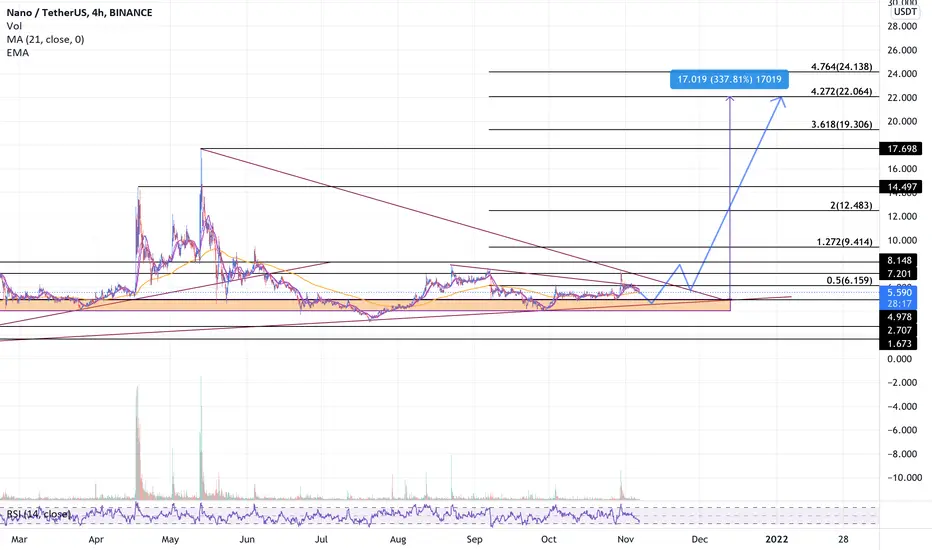
$NANO POSSIBLE OUTCOME.Let me know what you think of this analysis and tell me your predictions too!
$CRV ON ITS WAY TO $6.30?! (ANALYSIS ON $CRV)CRV will easily touch the $6.30 mark with no issue then it will aim for ath by mid-December and rocket even more.

$LTC TO $500+?This is my prediction on what I think will happen with Litecoin when the alt season starts!

FILUSD - Daily AnalysisToday we take a look at FILUSD. Feel free to leave a comment and like the video.
Cheers.

Potential Breakout on XYO?? Double check my chartI've been following XYO for a while now, it seems to have bottomed out(?) Anyone think it's gonna break out soon? If so I did some measurements. I'm barely starting out at chart reading. If anyone with more experience wants to check the chart and let me know if I'm even in the ballpark. I'm trying to learn this stuff as much as I can.

ADA Analysis 19-09-2021 by TheSocialCryptoClubGood evening,
Today we propose this analysis on ADA.
The price came into a compression zone at the main PoC, below the dynamic resistance.
Short scenario:
In case this resistance holds, we can see a strong volumetric gap created by the rally of the previous weeks, which could cause the price to collapse to the 2.08 - 2.16 area.
In this area is visible from the volumes, a very strong support that has also held the minimum of 07/09, spike excluded.
The support is also confirmed by the 0.618 level on CryptoFall.
Long scenario:
On the opposite, if this dynamic resistance would be broken, we can assume an increase in volumes with a consequent rise in price towards the upper resistances, the first in the 2.50 - 2.59 area, and the second in the 2.70 - 2.75 area.
Resistances confirmed both by volumes and by the coincidence of CryptoFall respectively on the levels 0.382 for the first and 0.236 for the second.
Thanks for your attention and happy to support the TradingView community.

POSSIBLE OUTCOME FOR $AKRO!I am expecting a breakout from Akro in the coming days and my first target is $0.05. Hopefully, we reach this target. I will keep doing market updates through out the cycle. TAKE PROFITS, DYOR AND DONT FOMO.

DOGE.X UpdateIF Doge falls below the 180EMA AND Falls below the MacD centerline I think that .21 is almost certain...
.21 is where I'm looking to enter.
GL Y'all... and... who's your football team??

BTC Explanation and Discussion.Let's review BTC after all the hype of the current pullback.
Discussion
It's been amusing reading analysis from so-called experts on Reuters and Yahoo finance. The Youtube videos by 'gurus' are not funny, they are just plain sad!
So let's look at some of the arguments from the VSPs (very serious people):
1) the so-called 'crash' was caused by Hash Rate failure. REALITY: Hash Rate as indicated (refer chart) has not materially declined - unless the data is wrong - there is no sign that this explanation is correct.
2) Fiat Currency is destroying BTC in order to teach El Salvador a lesson. REALITY: What evidence is there that the price move is materially different than what has already been experienced in the recent past? Do these VSPs check-out a daily price chart? (refer yellow box indicates a larger move)
3) It's a sad day when the Youtube gurus trade the past, and do it sooo badly they even confuse the dates. One minute they are in the future using past information, the next minute they seem to mix the dates of volume vs price as if one leads the other, but they are actually pointing to the sell off bar its - it's like the worse of the worse. REALITY: Time travel is not yet possible.
4) Panic to regulation and taxation. REAILTY: Actually most countries have property ownership laws and taxation on gains . Property laws protect consumers, and taxation normally affects only the HNW investors, who usually manage their affairs to avoid tax.
5) China has banned cryptos . REALITY: China has banned margin FX for years and yet the industry still exists. Chinese regulation waxes and wanes - do you see anyone in China handing over their wallets to the Chinese authorities?
6) Lack of Chinese mining creates downward pressure on price. REAILITY: New entrants enter the market like New Zealand with excess hydro power. So this is not an issue.
Current State:
1) SOPR is currently greater than 1. Spent Output Ratio hasn't peaked and its not negative.
2) HODLíng is evidenced by the fact that the Percentage of Coins in Circulation that have NOT Transacted for more than 1 Year has actually increased from recent lows, although obviously there have been sells in the prior rallies and price tops. Recently that percentage has steadied and turned up! It's certainly not at a historic low point to mention it as a catalyst.
3) Breakeven trading on Price rally has slightly occurred, but that was at the top of the range - not a 'sell at market' - > panic.
Why Volatility?
1) Firstly, is this a flash crash? Well, what is the definition of a crash? Certainly one day price moves have been larger, so in that context - it's not a crash!
2) Selling at market drives price down - that is, 'hitting the bid'. Long traders exiting underlying positions absorb supply - they don't add to it!
3) Leveraged longs selling at market, automated stop losses from future programmes, no circuit breakers, no Order Book regulation, lack of Central Order Book, lack of spoofing controls using APIs etc., exacerbate volatility - that's just common sense.
4) Platforms going down not allowing traders to unwind position, future brokers selling underlying in hedge programme exacerbate a reflexive response to further exacerbate the situation. It has happened previously, and volatility will occur again - given the current state or order books decentralisation, regulations etc.
Next Steps
1) I am long and holding. Price topped-out at the top of a range and lows bounced-off swing traders costs basis - so there was buying at that level.
2) The market 'stabs' down i.e. probes the Order Book to the downside - it is normal to have further downside moves, but - check if down moves are accompanied by a pick-up of volume (selling at market) or due to lack of buying pressures - there's a difference!
2) Manage your risk by margining exposure to risk - don't use leverage (common sense, cryptos have plenty of volatility to make money) - greed doesn't pay!
3) We have seen larger moves in BTC and DOGE etc., this is not a unique position - so don't frame it as one ... just yet!

$BTC Analysis & Key Levels - UPDATE$BTC Analysis & Key Levels
No looking good for Bitty today… Still on target from the last post… I think there’s quite a bit more to go…
I am not your financial advisor, but I will happily answer questions to the best of my ability but ultimately the risk is on you.
Red = Key levels
Green = resistance
Blue = trendlines
Have fun, y’all!!

BITCOIN ANALYSIS: Possible H&S bearish playout 4HR supply in confluence with .618 Fib Level, i pull back to trend line 38129 for one last leg up before the drop.

ETH/USDT TO THE MOON (ETHEREUM)seing price action being supported at this strong key level on mutiple time frames. looking for a nice reversal and could be a long term hold from here.

BTCUSDT Forming a Downward ⬇️ Triangle 📐 on 1D and 1W TF.
If broken down 🔻 then the shown targets are the possible areas for BTC.
Last one is in worst case scenario but still can happen. It's not impossible. Although not possible that much easily as well.
You need not to worry but not to be over confident as well in your trades till 2nd week of August.

The current ETH situation | ETHUSD | BULLISH OR BEARISH?ETH has been on quite a run lately based on fundamentals moving from $1700 up to the price of $2400 in the past 10 days, however the price has been consolidating within the current price for the past few days. This is never bad as the price needs some time to create more support and to rest so it is not seen as overextended leading to a sudden drop off top.
In the following paragraphs I shall be discussing my honest opinion on the current ETH market, however, everything I state in this article is based on my own opinion and should not be taken as a signal to buy or sell your ETH.
in order to understand what is going on in the chart analysis above ill start with the pennant formation marked in yellow. As you can see this formation broke to the downside, which theoretically is how these formations play out, as they are continuation patterns and the origin (flagpole) is from a bearish movement. The price bottomed out after the breakout at the $1700 level. Another formation was created there after which is also a continuation pattern.
The megaphone formation: The name derives from the fact that it looks like a megaphone which is fairly obvious. These formations generally are a strong confluence among other confluences that the price is going to move a certain direction. As the formation is a continuation pattern the pattern theoretically breaks out according to that, which it did. The target point (TP) of this formation will put ETH at around $2500, which is very convenient and almost to obvious, as the long term 50% fib retracement level sits within a few dollars from the TP adding further confluence to my prediction.
Therefore it could be strongly argued until proven by price that we are within a consolidation phase, just as most of the market is. The range in which we are consolidating seems to be between the $1700 level and the 50% fib retracement ($2523), However the Golden pocket will also play a key role and keeping the price back before it reaches these levels of support and resistance.
The MacD is almost slowly beginning to turn to the bearish momentum which will line up perfectly with the TP being reached and the retracement to the Golden pocket being a reasonably valid prediction, if the price plays out the way the technicals indicate.
Therefore for the short term at least I remain neutral on the price of ETH. This area of consolidation can be seen as a great buy in area for those who are in for the long term, but for those who are trying to make a quick trade, I advise you wait for a move out of the range of consolidation before you place a short term trade, as the market is very tricky lately.
Don't forget to leave a like if you agree or disagree with this article and if so leave a comment explaining why you disagree, am always open to different perspectives. Happy trading and thank you!
#notfinancialadvice


SR - BTC$SRM testing fib for 3rd time as resistance, if broke above and retest its good chance it will run to next fib. Maybe little resistance from previous tops around 12100
