ETHEREUM Free Signal! Sell!
Hello,Traders!
ETHEREUM Price has reacted sharply from the horizontal supply area, confirming the presence of institutional selling pressure. A clean rejection signals continuation toward the lower liquidity pool near $3,740 as Smart Money hunts sell-side targets.
-------------------
Stop Loss: $3,888
Take Profit: $3,741
Entry: $3,829
Time Frame: 3H
Setup Risk: High
-------------------
Sell!
Comment and subscribe to help us grow!
Check out other forecasts below too!
Disclosure: I am part of Trade Nation's Influencer program and receive a monthly fee for using their TradingView charts in my analysis.
Crypto-trading

BTC/USDT — Volume Confirmation Points Toward UptrendBitcoin has reclaimed strength within the low time frame zone, while also showing rising volume activity — a key technical signal that supports the early stage of a potential uptrend continuation.
BTC volume has been increasing since the last 7H step by step.
Currently, BTC is stabilizing between $111K and $113.6K, forming a supportive base within this range. The volume range just above acts as a confirmation layer — once price holds above this level with consistent demand, the uptrend momentum could accelerate.
📊 Technical Highlights:
Low Time Frame Support: $111K–$113.6K
Volume Zone: $116.6K area and important confirmation zone.
Main Resistance / Target: $118-120K
A sustained move above the volume zone ($116K) would be the main confirmation that BTC’s next leg toward $126K is underway.
📈 Bias: Bullish continuation forming
🎯 Key levels: $113.6K → $116K → up 118K

BRIEFING Week #41 : Havoc on CryptosHere's your weekly update ! Brought to you each weekend with years of track-record history..
Don't forget to hit the like/follow button if you feel like this post deserves it ;)
That's the best way to support me and help pushing this content to other users.
Kindly,
Phil

WHATS UP WITH BITCOIN?
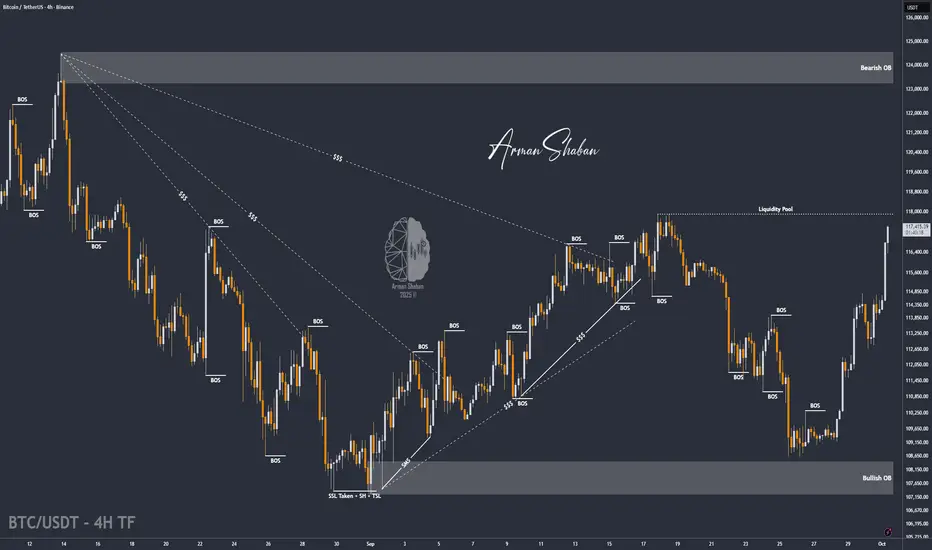
✅BITCOIN went up by almost 16.5% in under 11 days and established a new All-Time-High. An absolutely incredible run, so no wonder we are now seeing a bearish correction.
The take profit wave and the local opportunistic selling pressure might take the price back down to around 118,000$ demand area. This is where we can start buying from again as I am sure a new ATH will be established soon!
LONG🚀
✅Like and subscribe to never miss a new idea!✅

BNB/USDT | BNB Smashes $1200 Target – Momentum Remains Strong!By analyzing the BNB (Binance Coin) chart on the weekly timeframe, we can see that the price continued its bullish rally exactly as expected, breaking multiple new all-time highs (ATHs) and hitting the $1200 target.
It’s now trading around $1220, and the previous analysis remains valid. The next upside targets are $1400 and $1550, while the main support and demand zone lies between $980–$1050.
This setup has delivered over 30% profit so far — hope you made the most of it!
Please support me with your likes and comments to motivate me to share more analysis with you and share your opinion about the possible trend of this chart with me !
Best Regards , Arman Shaban

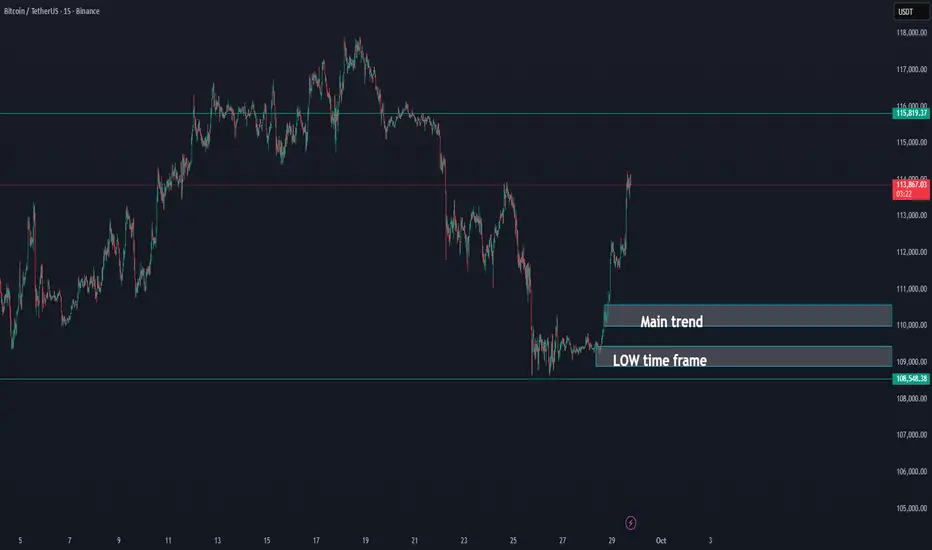
Bitcoin Consolidates Above Support — Main Trend IntactBitcoin (BTC/USDT) — Holding Strong Above Key Support Zones 💪
Bitcoin continues to trade above the low-timeframe support at $122,100, showing resilience and consolidation after its recent upward move.
✅ Low Time Frame Support ($122.1K): BTC remains stable above this short-term structure, suggesting buyers are still in control.
✅ Main Trend Support ($110.2K): The larger bullish structure remains intact as long as price holds above the $110.2K region.
📈 Momentum Outlook: A sustained hold above $122K could set up another push toward $126K–$130K, confirming bullish continuation.
Summary:
BTC remains bullish above both its low-timeframe and main-trend levels. Short-term consolidation is healthy, and the next breakout could target new local highs if momentum strengthens.
🎯 Support: $122.1K / $110.2K
🎯 Resistance: $126K / $130K
📊 Bias: Bullish continuation

BRIEFING Week #40 : What could cause VIX>100Here's your weekly update ! Brought to you each weekend with years of track-record history..
Don't forget to hit the like/follow button if you feel like this post deserves it ;)
That's the best way to support me and help pushing this content to other users.
Kindly,
Phil

BTC STILL IN TREND FOR MORE.. UPDATE 04-10-2025📊 Market Update
Bitcoin (BTC):
Bitcoin is maintaining its main upward trend, which continues to define the overall bullish structure. At the moment, BTC is trading in a new lower time-frame zone and needs to hold above $121.6K to confirm a green (bullish) structure on the lower time frame.
Bitcoin is positive until now

BTC/USDT | BTC Rally +7% Gains – Bulls Still in Control (READ)By analyzing the Bitcoin chart on the 4-hour timeframe, we can see that the price continued its rally as expected, hitting the $115K target and now reaching up to $117,200, just one step away from the next target at $118K. So far, this analysis has delivered more than 7% gains. I hope you made the most out of it!
Please support me with your likes and comments to motivate me to share more analysis with you and share your opinion about the possible trend of this chart with me !
Best Regards , Arman Shaban
ETHEREUM LOCAL SHORT|
✅ETHUSD rejected a premium supply level, showing displacement after inefficiency fill. Order flow signals bearish intent, with liquidity below 4,320$ likely targeted for rebalancing. Time Frame 8H.
SHORT🔥
✅Like and subscribe to never miss a new idea!✅

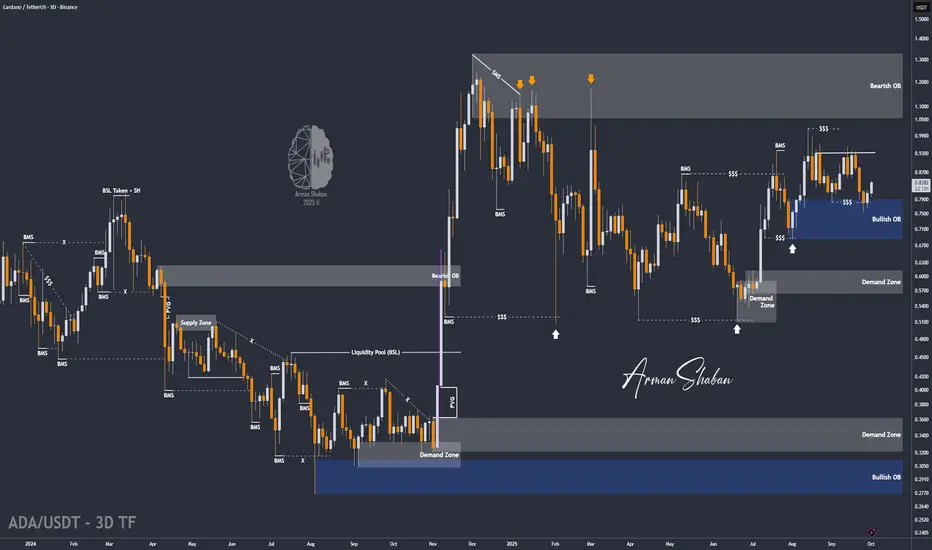
ADA/USDT | ADA Breakout Setup – More Upside AheadBy analyzing the Cardano (ADA) chart on the 3-day timeframe, we can see that the price has started to rise as expected and is now close to the first target at $0.85, giving us more than 11% gains from the previous analysis so far.
All other points from the last analysis remain valid. The next short-term targets are $0.95 and $1.00, while the mid-term targets are $1.05, $1.17, and $1.33.
Please support me with your likes and comments to motivate me to share more analysis with you and share your opinion about the possible trend of this chart with me !
Best Regards , Arman Shaban
Bitcoin - Key support $105 - 107k Buyers Should step inBitcoin - Key support $105 - 107k Buyers Should step in or up trend is over
best confirmation for me Open interest absorption

Bitcoin going on the flow UPDATE 29-09-2025BTC/USDT Update
✅ Bitcoin has successfully moved above the main trend, a strong signal that momentum is shifting positively.
🔑 As long as BTC holds this main trend support, the outlook remains bullish.
📈 This structure opens the door for further upside continuation, with buyers maintaining control above this level.
📌 Summary:
BTC is currently holding above the main trend, which keeps the short-term outlook positive as long as this level is defended.
BRIEFING Week #39 : The Turning Point is HereHere's your weekly update ! Brought to you each weekend with years of track-record history..
Don't forget to hit the like/follow button if you feel like this post deserves it ;)
That's the best way to support me and help pushing this content to other users.
Kindly,
Phil

BNB/USDT | BNB Bull Run Continues – No Signs of Correction Yet!By analyzing the Binance Coin (BNB) chart on the weekly (logarithmic) timeframe, we can see that the price has set a new ATH above $1,000. Since the last time I analyzed BNB — over 2 years ago — the price has increased by more than 400%!
Currently, BNB is trading around $1,060, and there are still no signs of a correction on the chart. With the current momentum, I expect further growth, possibly pushing the price to levels above $1,200. This analysis will be updated again!
Please support me with your likes and comments to motivate me to share more analysis with you and share your opinion about the possible trend of this chart with me !
Best Regards , Arman Shaban

BRIEFING Week #38 : Waiting for Something to Happen !Here's your weekly update ! Brought to you each weekend with years of track-record history..
Don't forget to hit the like/follow button if you feel like this post deserves it ;)
That's the best way to support me and help pushing this content to other users.
Kindly,
Phil

LTC/USDT | Litecoin Consolidating – Can Bulls Smash $150 RSTNCE!By analyzing the Litecoin (LTC) chart on the weekly (logarithmic) timeframe, we can see that after our last analysis, the price successfully reached the targets at $92.5 and $115. Currently, it is trading around $115.
The price now faces a strong resistance zone between $120–$150. Litecoin is consolidating and building enough momentum to attempt a strong breakout of this zone. If it manages to break through, the next bullish targets will be $155, $200, and $268.
Please support me with your likes and comments to motivate me to share more analysis with you and share your opinion about the possible trend of this chart with me !
Best Regards , Arman Shaban

The Big Short? BTCHere we have an ascending channel on the 15 minute chart bulls have been weak since our recent top. I feel a strong move is coming here soon in the market time to lock in.

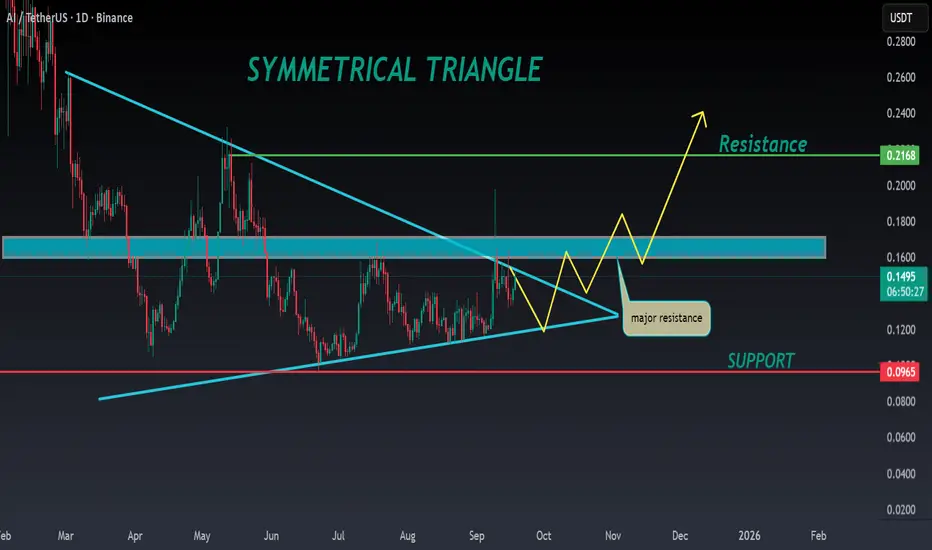
AI ANALYSIS🔮#AI Analysis 💰💰
#AI is trading in a symmetrical triangle in a weekly time frame and if it breakouts with high volume then we can see a bullish momentum in #AI. Before that we will see little bit bearish movement .
🔖 Current Price: $0.1490
⏳ Target Price: $0.2100
⁉️ What to do?
- We can trade according to the chart and make some profits in #AI. Keep your eyes on the chart, observe trading volume and stay accustom to market moves.💲💲
#AI #Cryptocurrency #Pump #DYOR
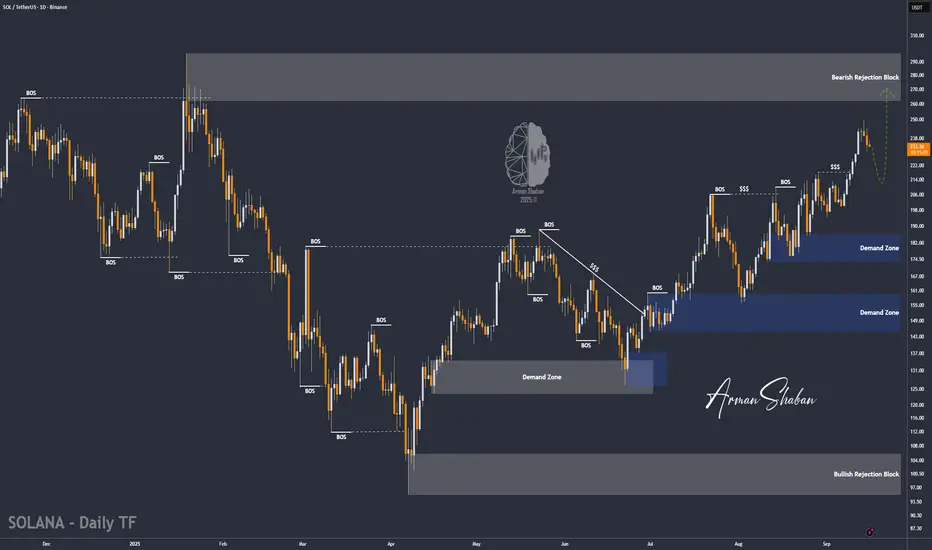
SOL/USDT | Solana Correction Over? Big Rally Loading Soon!By analyzing the Solana chart on the daily timeframe, we can see that after a correction, the price is now trading around $234. In the short term, I expect a small pullback, followed by another strong bullish move from this coin.
The key demand zone is between $210–$220, while the possible upside targets are $250, $260, and $296.
Please support me with your likes and comments to motivate me to share more analysis with you and share your opinion about the possible trend of this chart with me !
Best Regards , Arman Shaban
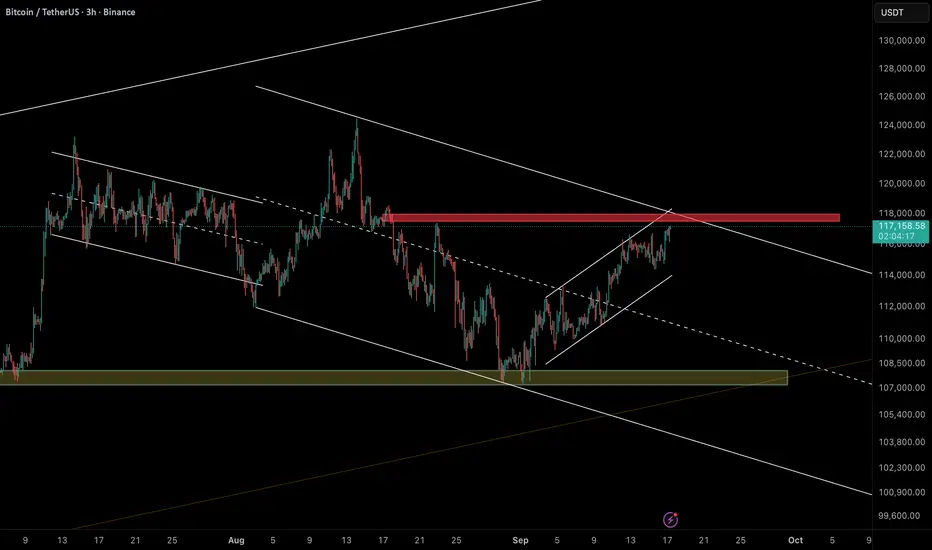
Bitcoin at Critical Resistance – Reversal or Breakout?Bitcoin (BTCUSDT – 3H) is testing the 117.5k – 118k resistance zone, which coincides with the upper boundary of the descending channel.
So far, this level has acted as a strong rejection zone several times.
🔎 Key Insights:
• Structure: Price has formed a rising channel/wedge, often seen as a corrective bearish pattern.
• Resistance: 117.5k – 118k (major supply zone + channel top).
• Supports:
• 114k (short-term channel support)
• 107k – 108k (major support zone + channel bottom).
📌 Scenarios:
• Bearish (more likely): Rejection from 118k → downside targets at 114k and 107k – 108k.
• Bullish (alternative): Break & close above 118k → potential rally toward 122k – 124k.
⚠️ As long as BTC stays below 118k, downside risks remain higher.
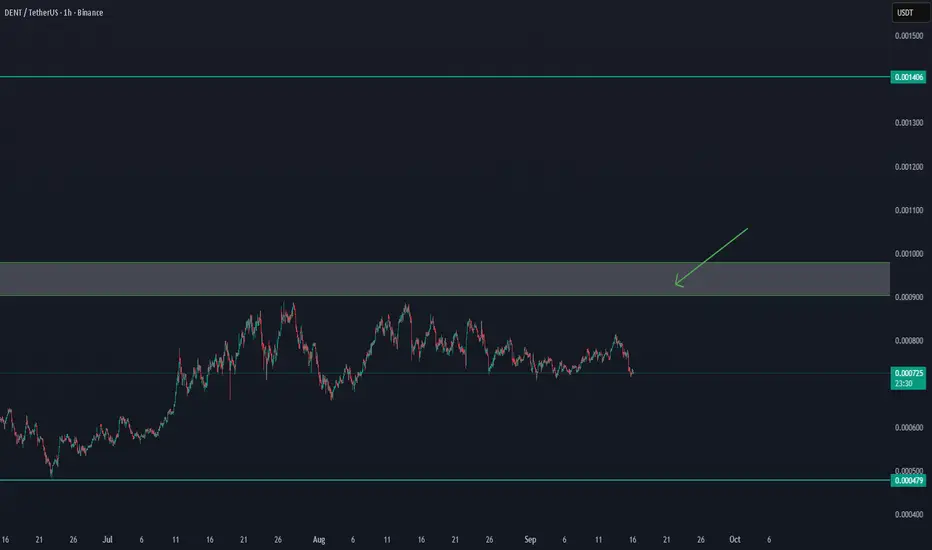
DENT'/USDT UPDATE Confirmation after $0,00093DENT/USDT UPDATE
DENT is showing signs of strength, but we need confirmation.
Key level to watch: $0.00093
✅ A clear breakout and hold above $0.00093 could trigger further upside momentum.
⚠️ Until then, price remains in a consolidation zone and risk of pullback is present.
Plan:
Wait for confirmation above $0.00093 before re-entering longs.
Next resistance levels to monitor: $0.00105 – $0.00120
Support remains around $0.00085 – $0.00080
Conclusion: Break and retest of $0.00093 will be the bullish signal for continuation.
BRIEFING Week #37 : Beware of the FOMCHere's your weekly update ! Brought to you each weekend with years of track-record history..
Don't forget to hit the like/follow button if you feel like this post deserves it ;)
That's the best way to support me and help pushing this content to other users.
Kindly,
Phil
