EURUSD Bulls Take Control - 1.1940 as Next TestHello traders! Here’s my technical outlook on EURUSD (3H) based on the current chart structure. EURUSD previously traded within a well-defined ascending channel, where price consistently respected both the rising support line and the channel resistance, confirming steady bullish control and healthy trend conditions. During this phase, the market printed higher highs and higher lows, showing strong buyer dominance. However, after reaching the upper boundary of the channel, bullish momentum began to weaken, and price transitioned into a corrective phase. This correction unfolded gradually, signaling profit-taking rather than an immediate trend reversal. Following the pullback, EURUSD formed a rising triangle structure supported by a clear ascending support line. Price then broke impulsively to the upside, signaling a structural shift and renewed buying interest. This breakout pushed price above the Buyer Zone around 1.1860, confirming acceptance above previous resistance turned support. The bullish impulse extended into the Seller / Resistance Zone near 1.1940, where price is currently reacting. At this level, sellers have started to show interest again, and price is consolidating below the resistance, indicating hesitation and potential short-term exhaustion after the strong rally. Structurally, the Buyer Zone around 1.1840–1.1860 now acts as a key support area. As long as price holds above this zone and respects the rising triangle support line, the broader bullish structure remains intact. A sustained hold above support favors a continuation move toward the 1.1940 Resistance Level, which stands as the primary upside target (TP1). This level also represents a critical decision zone where either continuation or rejection is likely to occur. My scenario: holding above the Buyer Zone keeps the bullish continuation scenario valid, with a potential retest of the 1.1940 Resistance Level. A clean breakout and acceptance above this resistance would open the door for further upside expansion. However, a strong rejection from resistance followed by a breakdown below the Buyer Zone would invalidate the bullish bias and signal a deeper corrective move. For now, EURUSD is trading at a key structural area, with buyers attempting to defend support and push price higher. Please share this idea with your friends and click Boost 🚀
Crypto

Hyperliquid: bull flag in play? key levels to watch aheadHyperliquid. Who’s riding this new perp beast or just watching from the sidelines? According to market chatter, the recent token launch plus growing derivatives volume keeps Hyperliquid in the spotlight, and today’s headlines about rising on-chain activity only added fuel to the narrative.
On the 4H chart we’ve got a classic post-pump chill phase: sharp vertical move, then a sideways pullback between roughly 31 and 35 that looks like a bull flag. Volume on the run-up was heavy and is now fading while RSI cooled from overbought back to the 50–60 zone - a healthy reset instead of a trend break. I’m leaning long, expecting liquidity grabs toward 32-31 and then a push through 34 with eyes on 36-38.
My plan: ✅ base case is that 31 holds as key support and price grinds higher toward 36 first, 38 if momentum returns. ⚠️ If we start closing 4H candles below 31 and especially under 29.7, I’ll treat it as a local top and look for deeper buys down in the lower green zones. I might be wrong, but I’d rather wait for the dip than FOMO into the last green candle at the highs.

VANA Testing Upper Boundary of Descending ChannelVANA is currently trading near the upper boundary of a long-term descending channel, making this a key decision area. Price has respected this structure for a long time, and the current move represents a clear resistance test, not support.
If price manages to break and hold above the upper trendline, it would indicate a potential trend shift and open room for a stronger upside move. However, a rejection from this level would likely keep price moving lower within the channel.
RSI is hovering near oversold territory, suggesting downside momentum may be slowing, but confirmation still depends on how price reacts at this resistance.
This is a wait-and-react zone.

BNB/USDT | Alive! (READ THE CAPTION)As you can see, BNBUSDT swept away the liquidity below 730 level and then moved back up to 783 before dropping back in the Bullish OB zone and now it's being traded at 755.
I would like to see BNB leave the Bullish OB zone soon to make an upwards move.
For now, the targets are: 760, 769, 778 and 787.

SOL/USDT | Liquidity sweep first (READ THE CAPTION)As you can see in the Daily chart of SOLUSDT, it has gone below $100 and the Bullish OB zone and it's being traded at 97.05 right now. I expect it to sweep the liquidity below the 95.27 level before starting a bullish movement.
I prefer to wait for now and not trade on SOLUSDT.

ETH/USDT | Back on track? (READ THE CAPTION)After sweeping the liquidity below, ETHUSDT managed to go high from 2110 to 2295, now being traded at 2265.
I expect Ethereum to eventually go higher and leave to Bullish OB zone.
For now, the targets are: 2297, 2320, 2345 and 2370.

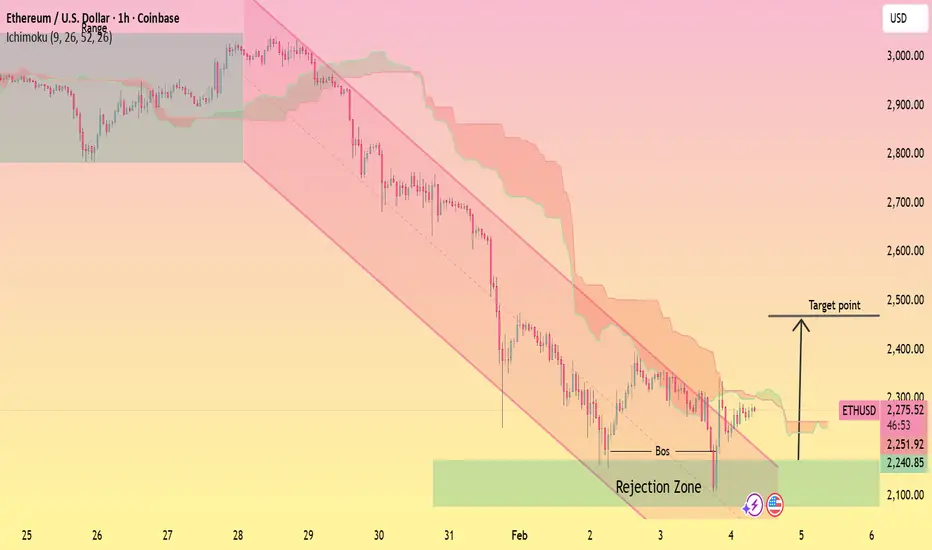
ETHUSD Downtrend Channel – Reversal Setup Toward Key ResistanceThis 1H ETHUSD chart shows Ethereum trading within a well-defined descending channel, confirming a strong bearish trend from late January into early February. Price remains below the Ichimoku cloud, keeping overall bias bearish, but a clear bounce from the highlighted demand/rejection zone has formed a short-term base. The marked BOS (break of structure) hints at early bullish intent after the sell-off. If momentum holds, price could attempt a corrective move toward the 2,450–2,500 resistance zone, which aligns with the upper channel and cloud resistance, before any larger trend continuation.
XAGUSD Trend Shift – CHoCH Signals Potential Bullish RecoveryThis 1H XAGUSD chart shows silver transitioning from a prior uptrend into a sharp bearish move, followed by signs of stabilization and early bullish reversal. The Change of Character (CHoCH) marks the shift in market structure after the sell-off. Price has rebounded from a highlighted demand zone and is attempting to reclaim the Ichimoku cloud, suggesting improving momentum. If buyers maintain control, the projected upside target sits near the 100–102 zone, aligning with previous structure and cloud resistance.

XAUUSD Bullish Reversal – BOS Targets Higher Leve.....This 1H XAUUSD chart shows a clear shift from a prior downtrend into a bullish reversal after a Change of Character (CHoCH). Price forms higher highs and higher lows within an ascending channel, signaling growing bullish momentum. Gold is trading above the Ichimoku cloud, suggesting trend support, with the highlighted demand zone acting as a strong base for the move. The projected upside targets point toward the 5,300 area as the first target and around 5,600 as the second target, aligning with the rising channel resistance.

BTC/USDT | Back on track? (READ THE CAPTION)Good morning folks, Amirali here.
By examining the daily chart of BTCUSDT we can see that it went as low as 72,945 last night, sweeping the sellside liquidity there and then it went back up and it is now being traded at 76,500.
Currently, Bitcoin is in the Bullish OB range, and I expect it to retest this zone and go for the Mean Threshold and the high of the Bullish OB.
Targets for BTC: 77000, 77500, 78000, 78500 and 79000.

Why BTC is Heading to $43k!Looking at the weekly chart, the picture for Bitcoin is becoming increasingly bearish. We have a clearly defined Head and Shoulders pattern, and the recent price action suggests we are at a critical tipping point.
Technical Outlook: The "Right Shoulder" has just been completed right around the 2025 Open level.
My primary scenario involves a short-term corrective bounce towards the zone between the 2026 Open (~$88,000) and 2025 Open (~$94,000) to flip previous support into resistance.
Following this, I expect a continuation of the downtrend with a primary target at the 2024 Open level (the ~$42k - $45k area), representing a potential -44% move from current levels.
Fundamental Headwinds:
Institutional Exit: Over the last 3 months, we've witnessed a massive $6.18 billion outflow from BTC ETFs.
BlackRock Signal: Notably, even BlackRock's client base has shown a significant shift toward selling, which often precedes a deeper market correction.
The MicroStrategy Risk: With their average purchase price hovering around $76,052, the current market price puts them near a break-even point. If BTC sustains a move below $70k, the pressure on their balance sheet becomes a real "black swan" threat.
The 2nd Year Presidential Cycle: We are currently in the second year of Trump's presidency. Historically, the 2nd year of any US presidency over the last 50 years has been the weakest for high-risk assets.
This is typically the year when economic "skeletons in the closet" appear. I don't expect a sustainable bull run until 2027 (the 3rd year), when administrations historically pump the markets to ensure favorable re-election conditions.
Conclusion: The technical breakdown combined with institutional outflows and unfavorable cyclical timing points to a long-term correction. Watch the 2024 Open level as the ultimate magnet.
Resistance Zone: $88,000 - $94,000
Target: $43,000 (2024 Open)
Not financial advice. Trade at your own risk!

BTCUSD Key Daily SupportBTCUSD is testing a major daily support zone around 75,000–78,000. Holding above this area could lead to a technical bounce, while a daily close below 75,000 may trigger further downside toward the 63,000–65,000 region. This is a key decision level and confirmation is needed.

Bitcoin Bounce Here!?If you find this information helpful or inspiring, please consider a boost and a follow. Any questions or comments are always welcome.
Bitcoin has just printed a swift selloff that swept 74,420, a level that immediately stands out as a potential swing pivot failure. This move also allows for two potential completed Elliott Wave interpretations, both of which suggest the possibility of a change in direction. That said, it is still too early to declare a confirmed trend change.
From a structural perspective, the decline shows characteristics that allow for a completed larger degree Zigzag, as well as a completed Wave 3 of a lesser degree. Both interpretations point toward the possibility of a directional shift, even if that shift initially presents itself as only a weak or corrective bounce.
The key word here is possibility, not certainty.
So far, we have seen a fast move down followed by a sharp reaction. On its own, that is not enough. What matters next is how price behaves internally. For confirmation, the market needs to retrace the swift move up in a corrective manner and hold a Higher Low, ideally within our TDU AOI. Without that structure, any upside remains vulnerable to being just another countertrend reaction.
If that Higher Low does form, the focus then shifts to whether price can challenge and break the most recent Lower High. A successful break would support the idea of at least a C wave advance for a Wave 4 within a larger impulse. If the Zigzag variant has completed, there is also the potential for further upside.
What strengthens this area is the confluence across multiple counts. Both the corrective and impulsive interpretations currently lean toward the same near term directional outcome, even if their longer term implications differ. This alignment increases interest, but it does not replace confirmation. Additional confluence is also present through the swing failure pattern and surrounding support resistance.
For now, this remains a tracking environment. The approach here is conservative by design. Let the market show its hand through structure, not assumptions. Until internal confirmation appears, patience remains the edge.
Trade Safe!
Trade Clarity!

Morpher long-term: Bearish Full Analysis!
CRYPTO:MPHMUSD
💡Hello Traders!💡
🏹This analysis is for all those traders who don't know what to trade. Or are confused like several others for hearing people say trade this; trade that but don't explain to you why and normally have a dangerous risk for your investment. I only trade after research and until I'm confident that the risk is minimum.
📉🎯Market Structure
Recently, Morpher has devalued like crazy. Once worth more than $0.02 per MPH now it is worth around $0.0072 and will continue to go down. I have been trading for more than a year this crypto and understand this crypto. It no longer is the crypto that kept its investor motivated and are lacking communication with investors and updates.
🐻💰Bear Market Is Obvious
The picture of the trend is now very clear. Because it leads to a sell-of which takes it to the point it it now. The only way this crypto can go up is if there is a crypto rally. Otherwise this is now a dead crypto; which makes it an ideal crypto to short.
NOTE : ⚠ Every trader should do their own research to be able to trade with confidence. This information has worked for me and wanted to share. That´s why I love TradingView theme "LOOK FIRST / THEN LEAP".
👍Thanks for your attention!👊
👇Feel free to comment below!👇

Crypto Winter 2026: BTC 75% Correction PT 30 000 USDInvestment Memo: Anticipating a 2026 Bitcoin Crypto Winter
By ProjectSyndicate
________________________________________
1. Executive Summary
❄️ Summary view: This memo treats 2026 as the high-probability crypto winter year for Bitcoin following the 2024 halving, with a working top around 123,000 USD and an expected cycle low near 30,000 USD, implying roughly a 75–76% drawdown from the peak. This is fully consistent with historical Bitcoin bear markets, which have typically seen 75–85% corrections from all-time highs.
❄️ Contrarian hook: While mainstream narratives still focus on ETFs, institutional adoption, and “crypto as macro asset,” the explosion of leverage (Aster DEX up to 1001x), CZ-backed perps, and BNB-chain meme-coin mania are treated here as late-cycle excess—classic topping signals rather than sustainable foundations.
________________________________________
2. Thesis & Target Range
📊 Cycle top assumption: cycle high of ~123,000 USD per BTC. That is well within the band implied by recent ATH prints ~125–126k in mid-2025 and aligns with a typical “blow-off” overshoot above the prior psychological milestone at 100k.
📊 Cycle low assumption: 30,000 USD downside target represents a drawdown of ~75.6% from 123,000 USD—slightly shallower than the 2018 crash (~84%) and broadly in line with the 2021–22 bear (~77% from 69k to ~15–16k). That keeps this winter brutal but not apocalyptic, consistent with a maturing asset still capable of deep mean reversion.
🧮 Math check on prior winters
• 2017–18: 19k → 3k ≈ 84% drawdown
• 2021–22: 69k → 16k ≈ 77% drawdown
• 2025–26 (your base case): 123k → 30k ≈ 76% drawdown
This places scenario squarely inside the historical corridor of 75–85% post-peak corrections.
________________________________________
3. Historical Pattern: Why Large Drawdowns Are the Base Case
📉 Structural volatility: Bitcoin’s entire price history is punctuated by massive post-parabolic drawdowns—early cycles saw 86–93% collapses, later ones 75–80%. Each halving-to-peak run has ended in a violent crash once marginal buyers are exhausted and leverage saturates.
📉 Time dimension: Historically, the “winter” phase has lasted 9–18 months from peak to capitulation and then a long grinding accumulation. The 2017 peak to 2018–19 bottom spanned roughly a year; the 2021 peak to 2022–23 nadir similarly took about a year, with a further period of sideways chop.
📉 Drawdown normalization: Traditional asset allocators increasingly frame Bitcoin as an alternative macro asset, but the statistical reality is unchanged: drawdowns of 70%+ are not outliers—they are typical. An assumption of only shallow corrections is the non-consensus view; a 75% winter is actually the boringly normal scenario from a historical distribution standpoint.
________________________________________
4. Where We Are in the Current Cycle
⏳ Post-halving positioning: The fourth Bitcoin halving occurred in April 2024, cutting block rewards to 3.125 BTC and effectively tightening supply. Historically, the major blow-off tops occur 12–18 months after halving, as reduced supply + narrative momentum pulls in late-stage retail and leverage.
⏳ Evidence of late-cycle behavior: By mid-2025, Bitcoin had already pushed to new ATHs above 100k and then into the ~120–126k region, with growing signs of ETF saturation, institutional FOMO, and leverage-driven upside. From a purely cyclical lens, we are more likely in the “euphoria / distribution” band than in early bull territory.
________________________________________
5. Aster DEX & Meme-Coin Mania as Contrarian Top Signals
🚨 Aster DEX as the “Hyperliquid of BNB Chain”: Aster DEX, emerging from APX Finance and Astherus and explicitly leveraging Binance’s network, is marketed as a high-performance perp DEX with MEV-resistant trading and leverage up to 1001x, backed by CZ/affiliate ventures. From a contrarian perspective, this is textbook late-cycle: maximum leverage offered to the broadest possible audience at or near cycle highs.
🚨 BNB meme-coin carnival: Simultaneously, BNB-chain meme coins and speculative listings (Maxi Doge, PEPENODE, various new BNB meme projects) are being pushed as high-beta “next 100x” plays. Historically, similar episodes—2017 ICOs, 2021 dog-coin and NFT mania—have coincided with or slightly lagged Bitcoin’s macro top rather than signal early-cycle value.
🎭 Narrative pattern recognition: In prior cycles, the market’s center of gravity shifted from Bitcoin to highly speculative edges (ICOs, NFTs, obscure DeFi, meme coins) at the very end of the bull. Late-cycle liquidity rotates into lottery tickets while BTC quietly transitions from “must own” to “source of funds.” The current Aster + BNB meme complex rhymes strongly with that historical script.
________________________________________
6. Why a 75% Drawdown to 30,000 USD is Plausible
🧊 From 123k to 30k mechanically: A move from 123k to 30k doesn’t require structural failure; it merely requires a reversion to historical drawdown. That kind of move can be achieved by:
• ETF inflows slowing or turning to mild outflows
• Derivatives funding turning negative as carry trades unwind
• A moderate macro risk-off (equities correction, higher real yields)
🧊 Maturing, not invincible: As adoption broadens—spot ETFs, institutional mandates, integration into macro portfolios—Bitcoin’s upside may gradually compress, but liquidity cycles and leverage cycles haven’t vanished. Even if each cycle’s drawdown edges slightly lower from ~85% to ~77%, there’s no reason to assume sub-50% drawdowns are the new regime. A respectable winter at 30k is almost conservative relative to earlier -80%+ events.
________________________________________
7. Why the Floor Might Hold Above Prior Lows
🛡️ On-chain + macro floor logic: Without pinning to proprietary on-chain models, two simple supports for a 30k floor are:
• Institutional cost basis: A growing chunk of supply is held via ETFs and treasuries accumulated in the 40–70k band. Many of these players may defend positions with hedging or incremental buying in the high-20k / low-30k region rather than panic-sell at -70–80%.
• Realized price ratcheting higher: Across cycles, Bitcoin’s long-term realized price average on-chain cost basis tends to step up structurally. Past winters have bottomed not far below that long-term average; as the realized base rises, so does the likely bear-market floor.
🛡️ Regime shift vs. previous cycles: In 2018 and 2022, Bitcoin was still climbing the wall of institutional skepticism. By the mid-2020s, you have:
• Spot ETFs
• Corporate treasuries
• Sovereign/FI experimentation
These players typically do not capitulate to zero; they reduce risk, but they also accumulate in stress. That supports the idea of a shallower floor (30k) instead of a full 85–90% purge.
________________________________________
8. Timing the 2026 Winter
🧭 Halving + 18-month lag template: Using the standard halving cycle template, major tops often occur 12–18 months post-halving, and winters then dominate the following year. With the fourth halving in April 2024, a 2025 ATH and a 2026 winter are exactly what the simple cycle model would project.
🧭 Scenario sketch
• 2025: Distribution at elevated levels (80–120k+), persistent Bitcoin as digital gold narrative, alt & meme blow-off, over-issuance of high-leverage products (Aster, other perps).
• 2026: Liquidity withdrawal + ETF fatigue + regulatory flare-ups → a stair-step decline through 80k, 60k, 45k, culminating in capitulation wicks into the 30–35k zone before a multi-month bottoming process.
________________________________________
9. Market Structure Stress Points in a Winter Scenario
🧱 Leverage cascade risk: Perp DEXs offering hundreds to 1000x leverage attract the most price-insensitive flow at the worst time. When BTC breaks key levels (e.g., 80k → 60k → 50k), auto-deleveraging and forced liquidations can accelerate downside far beyond spot selling. Aster-style platforms, while innovative, mechanically create risk of cascading liquidations in a volatility spike.
🧱 Alt & meme vaporization: BNB meme coins and other speculative assets that rode the late-cycle pump will likely see 90–99% drawdowns, as in previous winters where smaller alts dramatically underperformed BTC. In your framework, BTC at 30k is actually the “high-quality survivor” outcome; the majority of late-cycle tokens may never reclaim their peaks.
🧱 Mining and infrastructure: With halved rewards and a much lower BTC price, marginal miners will be forced offline, just as in prior winters. That tends to deepen the short-term pain but ultimately improves the cost curve (strong miners consolidate, inefficient ones exit), laying groundwork for the next cycle.
________________________________________

Dogecoin: nearing a reversal? key levels and targets aheadDogecoin. Still watching this dog bleed after the last hype wave and wondering if it finally found a floor? While majors are cooling off and money rotates into higher beta names, DOGE has been dumped into a pretty serious demand zone, and sentiment in the memecoin corner is heating up again according to market chatter. That’s usually when this coin likes to wake up.
On the 4H chart price is basing just above the recent spike low, right inside a strong support block, while RSI curls up from oversold. I’m leaning toward a short‑term long scenario: a squeeze into the first liquidity pocket around 0.115, and if buyers really bite, into the heavier supply zone near 0.12–0.125. Volume profile also shows a fat node above, so any push can accelerate as shorts rush for the exit.
My base plan: look for longs while we hold the 0.105–0.106 area, with targets at 0.115 and then 0.12+. If price loses 0.103 and starts using it as resistance, I flip the script and expect a slide toward the 0.095 demand zone instead ⚠️ I might be wrong, but the risk‑reward around current levels looks good enough for me to keep this dog on a short leash.

AABB float is locked synthetics being traded $250m< lawsuit :)AABB .021 volume spike, .0207 gap fill, .0175< then blast possible. AABB is going to see .07 & try for .20+ if/when AABB sees .14+ that’s confirmation for me the stock will see new highs & test $1+ & at that point we will see the lawsuit which has been expedited closed in company’s (AABB) favor as well as company updates & more retiring of shares. The float is locked & synthetics are being traded everyday hence the litigation/lawsuit that the SEC is directly now involved in & looking at. AABB will squeeze to $2-$4+
Hope you’ve prepared wisely 🐺 👂🏼 ✅ Hope you don’t continue to c u c k out because of your cognitive dissonance while you get up for work & miss out on #free #money 💋🫳🎤 #smallcap #penny #pennystocks #stockmarket #trading #stocks #investing #money #wifechangingwealth

Manipulation: Trading the Pullback Into Institutional ImbalanceH1 Long Setup
At the time of analysis, the H1 price is trading at 77,350.95, following a clear bullish impulse on the hourly chart. Rather than chasing strength, the higher-probability play is to wait for a controlled retracement into a zone where institutional activity is already confirmed. This plan focuses on entering long on a pullback into a bullish Fair Value Gap (FVG) that aligns with an order block and a structure retest, allowing risk to be defined tightly while targeting continuation.
Market Structure & Bias (H1)
The hourly structure shows a textbook bullish Break of Structure (BOS), followed by a measured pullback. Prior to the impulse, price swept liquidity below a minor swing low, a classic Smart Money Concepts (SMC) signature. The subsequent displacement created an imbalance, confirming institutional participation rather than random retail momentum.
SMC logic therefore supports a continuation long, provided price returns to the imbalance in an orderly manner. Any signs of distribution, failed BOS, or aggressive bearish expansion into the zone would invalidate this bias.
Fair Value Gap (FVG) Analysis
The H1 FVG sits between 76,830 and 77,050, formed by a strong three-candle bullish impulse with a large-bodied middle candle and minimal wicks. The AI-optimized FVG indicator flags this zone as:
Bullish
Unmitigated
Recent and high priority (H1 timeframe)
Because of this, the preferred execution is at the upper boundary of the FVG:
Entry: 77,050.00
If the FVG is fully mitigated before price reaches the entry, the setup is cancelled. No exceptions.
Order Block Confluence
Order Block Detection identifies a bullish order block inside the FVG, roughly 76,900–77,050. This block was created by an absorption candle immediately followed by strong bullish continuation, a sign of active accumulation.
This confluence tightens execution rules:
Entry is only valid on a bullish rejection from the FVG/order block area.
If price trades into the zone but fails to print a convincing rejection candle (engulfing, hammer, or strong close off lows), there is no entry and no scaling.
The overlap of FVG + order block significantly increases the probability that this zone acts as defended support.
Momentum & Trend Filters
RSI (H1):
RSI is holding in the mid-60s, signaling bullish momentum without overbought conditions. This supports continuation after a pullback rather than exhaustion. Bearish RSI divergence on the retest would be a clear reason to abort the trade.
Moving Averages (H1):
Price is trading above the 50-EMA (~76,800), and the 50-EMA is above the 200-EMA, confirming a bullish hourly trend. Notably, the 50-EMA aligns closely with the lower edge of the FVG, reinforcing it as dynamic support and justifying the stop placement below the zone.
MACD (H1):
MACD recently printed a bullish crossover with expanding positive histogram during the impulse that formed the FVG. Ideal entry conditions include a stable or re-accelerating histogram on the rejection candle. A fresh bearish MACD cross during the retest invalidates the setup.
Volume Context
Hourly volume (~422.8) expanded during the bullish impulse that created the FVG, suggesting institutional participation. On the retrace, volume should contract, showing reduced selling pressure. A valid entry requires volume expansion on the bullish rejection from the FVG. Weak or absent volume on rejection reduces conviction and calls for skipping the trade or reducing size.
Support, Resistance & Targets
Support / Entry Zone: 76,830–77,050 (FVG + order block confluence)
Immediate Resistance: 78,150–78,500
Higher Resistance: 78,900–79,950
Targets are aligned with opposing structure and imbalances, scaled to H1 volatility.
Trade Plan (H1)
Entry: 77,050.00 (buy limit or enter on bullish rejection inside the FVG/order block)
Stop Loss: 76,228.00 (beyond FVG/order block, ~1.07% below entry)
Risk per Contract: 822.00 USD
Take Profits:
TP1 (Exit): 78,283.00 — 1.5R (conservative primary objective)
TP2: 78,950.00 — next H1 structure
TP3: 79,900.00 — extended target at the next imbalance
Execution Rules:
Wait for a clear bullish rejection candle inside 76,830–77,050.
Confirm Order Block Detection and SMC remain bullish at entry.
MACD histogram should be stable or turning positive.
Cancel the trade if the FVG is fully mitigated beforehand or if rejection occurs on strong bearish volume.
Risk & News Considerations
Risk per trade is defined and controlled (~1.07% of entry price), with a 1:1.5 primary reward to maintain discipline. No major macro or crypto-specific events are listed in the next 72 hours, so this setup is driven purely by technical confluence. Any unexpected high-impact exchange or regulatory headlines should pause execution until volatility stabilizes.
Final Summary
This H1 setup presents a high-quality continuation long built on aligned Fair Value Gap, order block, and Smart Money Concepts signals. A patient entry at 77,050, protected by a well-defined stop at 76,228, and staged targets at 78,283 / 78,950 / 79,900 offers a structured, volatility-aware trade plan. Discipline is key: wait for confirmation, respect invalidation rules, and let the market come to the zone.

GPSUSDT.P: long setup from daily resistance at 0.008500SETUP SUMMARY
BINANCE:GPSUSDT.P is holding well below the level, considering yesterday’s strong rally. Usually, a correction is expected, but we see the asset sticking nearly to the level and consolidating clearly and calmly, without sharp moves — this is a sign of a confident buyer.
About 2 hours ago, there was a false breakout, and this is now the key factor to watch: whether a correction follows it. If not, it is a strong long signal. If a correction occurs, it means sellers are blocking the upside, and we will need to wait for a new approach and re-evaluate the overall picture. Therefore, the shallower the correction and the faster the re-test of the level, the better.
PRO-THESIS FACTORS:
volatility contraction on approach
impulse absorption at the level
close retest
price compression (Squeeze) (4h)
lack of rejection after false break
at-level close ADVERSE FACTORS:
overhead congestion
lack of accumulation Leave your thoughts on the setup in the comments. Follow this profile to monitor all upcoming ideas

CHZUSDT – All Eyes on Vision Reveal: Key Levels to WatchChiliz (CHZ) rallied +142% off November’s lows, sweeping May’s highs and triggering stop runs on the bears. But momentum has cooled — price has now retraced over 50% ahead of the highly anticipated vision reveal scheduled for Tuesday.
Is this the calm before another leg up — or the setup for a classic "sell the news" move?
🟩 Support Zones to Watch
🔹 $0.04429 – Key support where bulls stepped in on Jan 31, rejecting bears after a stop raid below the Jan 6 swing low at $0.04253. This aligns with Dec 29’s bullish weekly void and the midpoint of last week’s long lower wick — strong confluence.
🔹 $0.04091 – Higher-timeframe support: the bullish monthly void from December, overlapping with an unfilled portion of Dec 29’s weekly void.
Inside this zone:
$0.04091 – $0.03982: Weekly void from Dec 31.
$0.03948 – $0.03827: Weekly void from Dec 30 — possible last line of defense if selloff deepens.
🟥 Resistance & Upside Targets
🔸 $0.04672 – Resistance from Jan 30’s distribution zone at the 40-day EMA, overlapping Jan 5’s now-invalidated bullish weekly void.
Breakout scenario:
If the vision reveal beats expectations, price could push into:
$0.05061 – Jan 29 bearish daily void, confluent with:
Jan 25 accumulation
Jan 27 distribution

ENA / USDT – Daily OutlookENA remains in a bearish higher timeframe structure, continuing to respect the descending daily trendline.
Price is still forming lower highs and lower lows, indicating no confirmed trend reversal.
The previous daily support has been cleanly broken and is now acting as resistance.
Market Structure
HTF structure remains bearish
No daily MSS to the upside
Current price action is corrective within a downtrend
Key Observations
October downside wick has been fully filled
Price is trading back inside the lower range
The 50% retracement aligns perfectly with the broken support
This level now acts as a clear S/R flip
Trend Context
Price remains below the daily descending trendline
No daily close above resistance
No acceptance above reclaimed structure
Key Levels
HTF Resistance / 50% Retracement: 0.18 – 0.19
Trendline Reclaim: ~0.25
HTF Support: ~0.12
Invalidation: Daily close above trendline + reclaimed support
Bias
HTF Bias: Bearish
Expectation: Corrective moves only until structure shifts
As long as price remains below the trendline and reclaimed resistance, upside moves are considered corrective.
Will ENA manage to reclaim structure, or is this just another lower high?
MrC

Bitcoin bounced from VWAP as we planned!!Bitcoin bounced from VWAP as we planned!!
At this momnet take a short if the price would od higher or a bigger range
i warned about short here
and here

XMR Trade Setup – Eyes on the Reversal ZoneXMR is currently ~50% below its ATH, with recent price action unable to hold above the critical $410 resistance. This breakdown has opened the door to further downside, with the next major support zone becoming a key area to watch. If sentiment improves, this zone could act as a reversal base.
🔍 Potential Entry Zone: $323 – $343
This range aligns with historical demand and may attract fresh buyers. It's where I'm looking for a reaction before confirming any setup.
🎯 Targets:
TP1: $410
TP2: $480
TP3: $620
🛑 Stop-Loss: $296
Below key structure – protects against deeper breakdowns.
Waiting for confirmation in the zone. Risk management is key.
🕒 Patience wins. Let price come to you.
