ENSOUSDT.P: long setup from daily resistance at 1.6399BINANCE:ENSOUSDT.P is in a bullish trend. After a strong rally, it consolidated for a few days. Now, a solid pre-breakout base is forming right under the 1.6399 resistance, which acts as the upper boundary of the trading channel.
I have mixed feelings about the Daily timeframe because the asset has already extended significantly today. However, on the 4H timeframe, we see clear price compression towards the level with decreasing volatility. On the 5m chart, the price tested the level multiple times without a deep rejection or correction, which would be the normal reaction here.
The logic: When we don't see the expected reaction (a pullback), that catches my attention. If an asset rallies hard and still has the strength to hold highs and consolidate right under resistance, it signals a strong buyer.
Conditions: Volatility must not increase before the breakout. The entry must strictly follow the system rules. Given the overextended Daily chart (which is the primary one), I will be extremely cautious with this trade, or might skip it entirely if the setup isn't perfect.
Crypto

ENSOUSDT: short setup from daily support at 1.2632BINANCE:ENSOUSDT.P is correcting as expected following the pump.
The initial decline halted at the 1.2632 level. The following day, we witnessed a False Breakout relative to this price, which confirms the level's validity (as a False Breakout can only occur relative to a significant level). Essentially, a False Breakout represents the asset's inability to sustain a price below or above a certain point.
What do we see next? weakness. The asset failed to take out yesterday's High. Since we cannot go up, we are now seeing a gradual approach — a slow bleed — back toward our established support at 1.2632.
This gradual approach is clearly visible on the 4H timeframe and signals a strong bearish intent. This is not a panic dump; it is a methodical move where every limit buy order standing in the way is being slowly and confidently absorbed. Such clarity and precision in price action suggest that strong capital is driving this move.
Therefore, the breakdown of this level is simply a matter of time. Disclaimer: This is the crypto market. Anything can happen at any moment, and even the most professional analysis can be invalidated instantly. Always remember this.

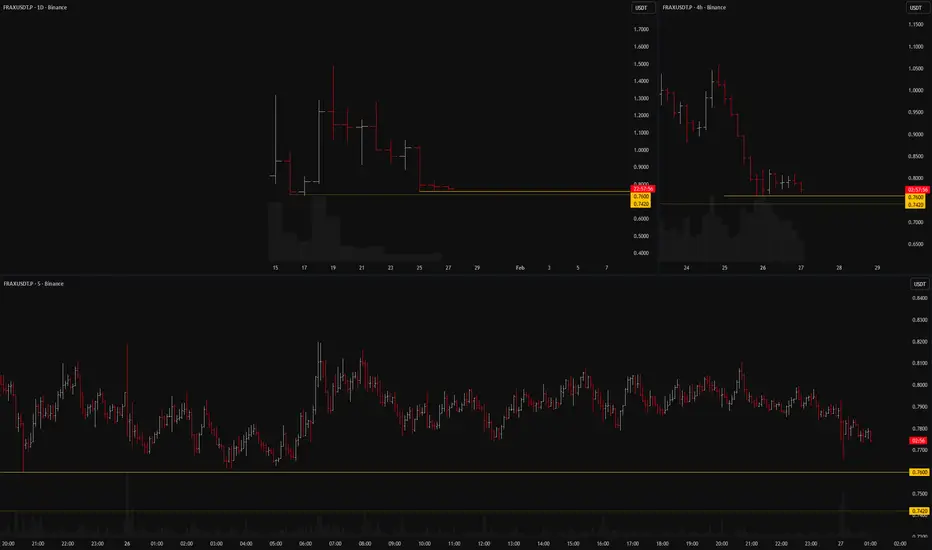
FRAXUSDT: short setup from daily support at 0.76BINANCE:FRAXUSDT.P is confidently approaching its all-time lows.
Right now, the price is consolidating above the 0.76 level, positioning itself, in my view, for further downside. What caught my attention is the massive drop on Jan 25, followed by the asset simply "hanging" just above the support with minimal volatility. Normally, volatility decreases gradually. Here, we saw a ~25% crash, and the very next day, volatility dropped by a factor of 3.5. This is abnormal.
Two negative factors:
High volatility on the working timeframe (5m).
Immediately below 0.76 lies the historical low (ATL) of 0.742, which could act as an obstacle to a free fall.
My Plan:
Given these factors, I am waiting for the character of the movement to change. Before the breakout, a clean entry point must form on low volatility. I need to see abnormal calmness for this asset — no large, erratic bars.
Looking at the 4H timeframe, observing how cleanly the asset is consolidating and how many times it has hit the 0.76 support, I would still look to initiate a Short from this level.
SOLUSDT – Long-Term Accumulation Setup (Not Momentum-Based)Solana (SOL) is approaching a major support zone around $95–$100, potentially setting up for a long-term accumulation opportunity. If broader crypto adoption continues and SOL eventually reclaims and breaks its previous All-Time High (ATH), this level could prove to be a high-conviction entry for patient investors.
🔸 This is NOT a momentum play.
🔸 We're scaling in slowly to manage risk and exposure.
🔸 Idea is to build position during consolidation and fear, not chase breakouts.
🧾 Trade Setup
Entry Zone: $95 – $100
Take Profit 1: $160 – $170
Take Profit 2: $260 – $280
Stop Loss: $77 (below structural support)

Accumulation, Manipulation, and DistributionMarkets do not move randomly. They rotate through phases that allow large participants to build positions, protect those positions, and eventually exit them. Accumulation, manipulation, and distribution describe this rotation. They are not patterns to trade blindly. They are a framework for understanding why price behaves the way it does at certain locations.
Accumulation occurs when price moves sideways after a decline or during a pause in a larger trend. Volatility contracts, ranges tighten, and progress slows. This is not indecision. It is inventory building. Large positions cannot be entered in one candle without moving price against themselves. Accumulation allows orders to be filled gradually while keeping price contained. Breakouts during this phase often fail because the market is still absorbing liquidity, not ready to expand.
Manipulation is the transition phase. Once enough inventory is built, the market seeks liquidity to fuel expansion. This usually appears as a sharp move beyond the range highs or lows. Stops are triggered, breakout traders enter, and price briefly accelerates. If the move lacks follow-through and quickly reclaims the range, it signals that the breakout was used to fill orders, not to establish direction. The purpose is not deception for its own sake. It is efficient execution.
Distribution follows expansion. After a directional move, price begins to stall. Impulses weaken, volatility compresses, and progress slows again.
This is where positions built earlier are reduced or closed. Distribution often forms near obvious highs or after extended trends, where late participants are still entering with confidence. Liquidity becomes available again, allowing exits without collapsing price immediately.
These phases repeat across timeframes.
A small accumulation on a lower timeframe can exist inside a higher timeframe distribution. This nesting explains why markets can trend strongly while still producing frequent false signals intraday. The phase you are trading matters more than the setup you are using.
The practical edge comes from alignment. Accumulation favors patience and waiting for confirmation. Manipulation requires restraint, not chasing. Distribution demands risk management and reduced exposure. When traders misidentify the phase, they trade against the market’s purpose. When they recognize it, execution becomes calmer, risk becomes clearer, and losses become easier to control.
Understanding accumulation, manipulation, and distribution does not predict exact turning points. It explains intent. When you trade with that intent instead of reacting to candles, you stop fighting the market and start working with it.

Bitcoin and Ethereum Likely To Move Up Before More DownTrading Fam,
Both BTC and ETH have broken major support levels to the downside. We are likely to see price move up to retest this previous support (now resistance) before further price movement to the downside resumes.
Take care.
✌️Stew

BTCUSD — Intraday Long (Expectation)I’m considering long exposure within the 75,400–76,000 range.
Context:
Daily composite support
Local sell-side absorption
Buyer stimulation visible after sell lock-in
Ideally, I want to see a controlled bullish impulse from the zone to confirm acceptance.
Targets:
78,800
79,200
Invalidation:
Sustained acceptance below 74,900.
No confirmation — no trade.
Risk will be kept minimal and strictly managed.

ETH/USDT | What's next? (READ THE CAPTION)By examining the daily chart of ETHUSDT we can see that it has reached to the Bullish OB and after hitting the mean threshold, it made bounced back up from 2157 to being traded right now at 2305.
Targets for ETHUSDT: 2335, 2370 and 2405.

BTC — Daily OutlookBTC has swept sell-side liquidity and is currently trading inside a major HTF demand zone.
From a higher timeframe perspective:
Daily structure remains bearish
Price is still below key resistance and previous range support
This keeps the move counter-trend for now
However, important context:
The sell-off showed signs of exhaustion
Liquidity below recent lows has been taken
Price is reacting from a HTF demand / range low
This creates conditions for a potential reversal, but confirmation is required.
What needs to happen next?
A clear LTF MSB (Market Structure Shift)to the upside
Followed by a clean retest holding above the higher low
Bullish displacement would strengthen the case
Without a confirmed MSS:
Any bounce remains a reaction, not a reversal
Longs are early and aggressive
Key levels:
HTF Demand: 74K – 78K
First resistance: ~90K
Major resistance: ~96K
Only acceptance back above resistance would open room for continuation.
Until then:
Bias = cautiously bullish
Patience over prediction
👍 Like if this level makes sense
💬 Comment if you expect continuation or another sweep
MrC

BTC/USDT | moving slowly! (READ THE CAPTION)As you can see in the daily chart of BTCUSDT, BTC went through a massive drop, going as low as $74,600! Currently it's being traded at 77,950 and in the Bullish OB range, I expect BTC to make a move towards the high of the Bullish OB and then see how it moves after reaching there.
Targets: 78,200, 78,800, 79,400 and 80,000.

Buy the Rumor and Sell The NewsMarkets move before information becomes official because positioning always precedes confirmation. By the time news is released, expectations are already priced in. “Buy the rumor” describes this positioning phase, where capital reallocates based on anticipation rather than facts.
Traders who act only on confirmation arrive when risk is highest and asymmetry is lowest.
Rumors form when uncertainty exists and narrative fills the gap. Expectations about events, data, upgrades, or macro decisions begin circulating long before outcomes are known. During this phase, liquidity is thin and positioning builds gradually. Price advances not because certainty exists, but because participants want exposure before clarity removes opportunity.
As the rumor spreads, price often trends cleanly. Pullbacks are shallow, momentum holds, and dips are bought quickly. This is not because the outcome is guaranteed, but because risk is perceived as acceptable relative to potential upside.
The danger appears near confirmation. When the news becomes official, uncertainty collapses. Everyone knows the outcome, and participation peaks. Liquidity increases sharply as late buyers enter and early participants begin exiting. This is why markets frequently stall, reverse, or distribute immediately after positive news. The trade was never about the event itself. It was about positioning ahead of it.
Selling after confirmation is not manipulation. It is inventory management. Capital that entered early needs liquidity to exit. News provides that liquidity. When expectations are fully priced, continuation requires new incentive, not old information.
The practical takeaway is not to trade headlines. It is to observe behavior before them. Watch how price reacts during anticipation. Strong trends with controlled pullbacks suggest accumulation. Choppy price with sharp spikes suggests distribution forming. When confirmation arrives, reassess rather than assume continuation.
“Buy the rumor” works because markets move on expectations and pause on certainty. Traders improve when they stop reacting to news and start reading how the market positions itself in advance. The edge lies in understanding when probability is expanding and when it has already been spent.

ETH: Gravity Still OnETH isn’t “crashing.”
It’s doing its job .
Zoom out and you’ll see the same thing repeating over and over:
lower highs → corrective bounces → unreached bearish C targets left behind .
Those Cs aren’t decoration.
They’re magnets .
Every time ETH tried to stabilize, it left another unfinished bearish sequence below. No proper resolution. No cleanup. Just more downside pressure stacking up.
That’s why every bounce feels weak.
That’s why upside keeps failing.
Price isn’t free to trend until this mess is resolved.
Right now:
Multiple HTF bearish Cs remain open
Structure keeps rolling over instead of reclaiming highs
Rallies look corrective, not impulsive
Until ETH clears these C target s, any bullish narrative is premature at best… and delusional at worst.
Could we bounce short-term? Sure. Markets breathe.
But structurally?
The draw is still down .
If ETH suddenly reclaims and holds above major broken structure, I’ll kill this idea myself. No ego attached.
Until then — unfinished business usually gets handled.
Bias : Bearish continuation
Focus : Unreached HTF C targets acting as draw on price

Bitcoin's next pathBitcoin dropped four months in a row. Therefore it is in bear market and will test the trendline in coming months after some upwards correction. While testing the trendline it can do false breakout to between $40 000 and $50 000 level.

CRCL All time Low but ending soon?NYSE:CRCL as hit an all-time low, breaking below the IPO launch price.
A triangle printed. Triangle are penultimate patterns before the last move of the trend so its possible this is the final leg down, just in time to capitulate investors.
Bullish divergence has printed in the daily RSI from oversold
Keep an eye on this.
Safe trading

Coinbase, weekly hidden bullish divergence NASDAQ:COIN has been getting rekt alongside Bitcoin.
It has now closed below its weekly 200EMA and below the weekly pivot, a very bearish sign and it must recover to feel bullish again. Wave 2 of 5 now sits at he 0.786 fibonacci, a deep retracement for this stock.
If price falls below $141, hidden bullish divergence will be negated and the Elliot wave count is invalidated and a macro wave 2 is in play.
Price has fallen out of the multiyear uptrend line.
Ugly
Safe trasing

SOL Breakdown in Bearish ChannelThis 2-hour SOL/USD chart with Ichimoku Cloud shows a sustained downtrend inside a descending channel. After topping near the upper resistance, price rolled over, lost cloud support, and formed a bearish consolidation before breaking lower. SOL continues to trade below key resistance around 128–130, with the cloud acting as overhead pressure. The projected downside target sits near 104, signaling bearish continuation unless price reclaims the channel and cloud.

XAUUSD Trend Reversal (CHOCH)
This is a 1-hour XAUUSD (Gold/USD) chart. Price was moving inside a rising channel supported by the Ichimoku cloud. After making a high, the market showed a Change of Character (CHOCH), broke below key support and the cloud, and shifted from bullish to bearish structure. Strong selling pressure followed, with price heading toward the lower marked target zone, signaling downside continuation.
Entry at 4895
Target point 4580

XAGUSD Channel Breakdown
This is a 1-hour XAGUSD (Silver/USD) chart. Price was moving in a clear ascending channel with Ichimoku support, then broke down below the channel and key support zone. After the breakdown, strong bearish momentum appeared, indicating a trend reversal from bullish to bearish, with downside continuation toward the marked lower target area.

Why the Same Strategy Performs Differently in Crypto and ForexMany traders experience the same frustration. A strategy shows consistency in one market and breaks down in another. The instinctive reaction is to question the rules, indicators, or entries. In most cases, the strategy is not the problem. The environment is.
Crypto and Forex operate under very different structural conditions. Crypto trends tend to expand faster, with sharper volatility and deeper intraday swings. Liquidity is thinner, order books change rapidly, and price frequently overshoots levels before stabilizing. Forex moves more slowly, with deeper liquidity and more controlled reactions, especially during active sessions.
These differences change how a strategy behaves in practice. Stop placement that works well in Forex can be too tight for Crypto, where routine volatility regularly exceeds technical boundaries. Profit targets that feel conservative in Crypto may be unrealistic in Forex, where expansion unfolds more gradually. The logic of the setup remains sound, but the execution parameters no longer match the market.
Time also plays a role. Crypto trades continuously, meaning trends can develop at any hour and extend without the pauses created by session boundaries. Forex activity is concentrated around specific windows, and strategies often perform best when aligned with those periods. Running the same rules outside their optimal timing reduces effectiveness.
Risk sequencing further amplifies these differences. In Crypto, clusters of volatility can create rapid drawdowns even when the strategy remains statistically valid. In Forex, losses are often more evenly distributed, allowing smoother equity curves. Traders who do not adjust position sizing or expectations misinterpret this as inconsistency.
Successful traders adapt execution while preserving logic. Entry criteria, risk models, and trade management evolve to fit the market’s structure. The strategy stays the same. The application changes. Understanding this distinction is what allows traders to remain consistent across asset classes rather than constantly searching for something new.

TOTAL: bounce or further drop? Key levels to watch today!Tired of watching your whole crypto watchlist bleed in sync and wondering if the party is over for everyone at once? Lately headlines about tighter liquidity and fresh regulatory pokes have turned sentiment risk-off again, and according to market data the TOTAL crypto cap just flushed to new local lows. Fear is thick in the air - which is exactly when I start paying closer attention.
On the 4H TOTAL chart we just tagged a major support zone around 730B with a big volume spike and, most likely, deeply oversold RSI. Price made a sharp vertical dump followed by a small wick-reversal - classic capitulation vibes. I might be wrong, but I think most traders are overestimating how bearish this setup is and underestimating the odds of a mean-reversion bounce.
My base plan: ✅ look for a defensive long as long as 730B holds, with a bounce target toward 780-800B and maybe 820B if momentum wakes up. Alternative: ⚠️ if we close 4H candles below 730B and fail to reclaim fast, that opens the door to 700B and I step aside, no hero mode. Personally I'm flat for now, waiting for either a clean reclaim of 760B or a final stop-hunt under the lows to start scaling in.

Bitcoin (CME) - GAP that needs to be filledWe just got a gap on the CME. Making it very likely we will go up from here and form a bottom on Bitcoin.

Trend Weakening, Market Shifts Into Defensive ModeHello everyone,
On the D1 timeframe, Bitcoin is no longer maintaining its previous bullish structure. Price has fallen below both EMA 34 and EMA 89, while the two moving averages have started to slope downward and repeatedly act as rejection zones whenever price attempts to rebound. When EMAs transition from support into resistance, it often signals a shift in short-term control — sellers no longer need aggressive pressure; they simply wait for pullbacks to re-establish dominance.
The decline toward the 81,500 USD area carries the characteristics of an active distribution phase rather than ordinary volatility. Large daily candle bodies reflect decisive position unwinding, typically accompanied by leverage liquidations and a rapid shift in market sentiment from optimism to caution. Moves like this rarely conclude with a single touch of the low; they usually leave an after-effect in the form of weak and short-lived recoveries.
At the current stage, the 80,000 – 81,500 zone acts as a nearby psychological support where technical reactions may appear due to accumulated liquidity. Below that, the 76,000 – 78,000 region stands out as a notable former demand area should 80k be clearly broken. On the upside, the 89,000 – 93,000 band — where EMA 34 and EMA 89 converge — remains the key zone to evaluate the strength of any rebound. As long as price cannot establish acceptance above this area, short-term advances are more likely to be technical recoveries rather than structural reversals.
From a broader flow perspective, the environment does not yet favor an early breakout scenario. Heightened volatility across risk assets has reduced overall market leverage, while the absence of a strong catalyst limits the return of fresh capital into crypto. When liquidity fails to expand, markets typically choose between two familiar paths: sideways consolidation to absorb supply, or a deeper correction to rediscover a more attractive equilibrium.
Wishing you all productive trading sessions, and what’s your view?

Bitcoin pull backBitcoin is on a very strong and important support about 72k and IMO we are going to see a strong bounce to 100k area one more time
