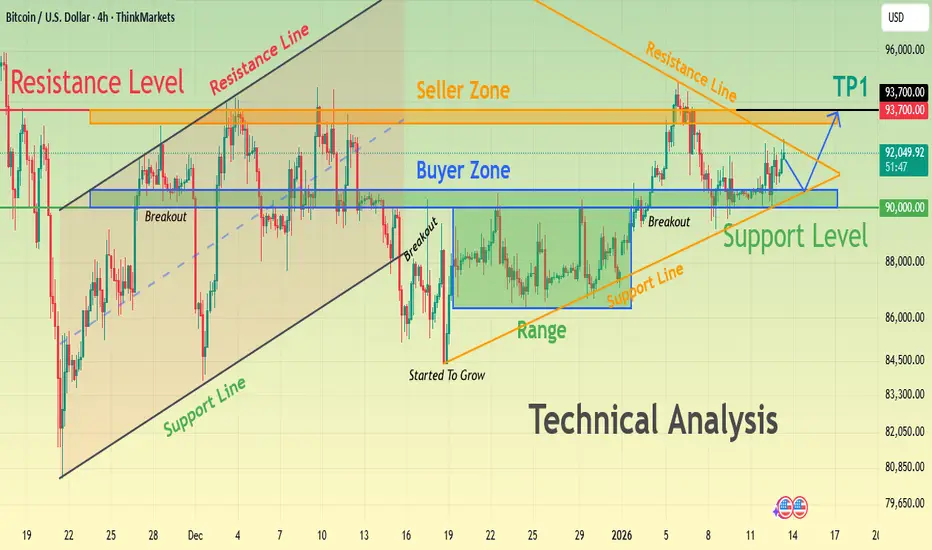
BTCUSD Consolidation Before the Next Big MoveHello traders! Here’s my technical outlook on BTCUSD (4H) based on the current chart structure. Bitcoin is trading within a broader bullish structure after reclaiming key levels and breaking above previous consolidation zones. Earlier on the chart, price respected a rising support line and formed a series of higher lows, signaling growing buyer strength. After a brief pullback, BTC entered a consolidation range, where the market paused before continuing higher. This range acted as an accumulation zone, and the subsequent breakout confirmed renewed bullish momentum. Currently, BTCUSD is trading above the Buyer Zone around the 90,000–91,000 area, which aligns with previous resistance turned support. Price recently broke out from this zone and is now consolidating just below the Seller Zone / Resistance Level near 93,700. This resistance also aligns with a descending resistance line, increasing its significance and making it a key reaction area. My scenario: as long as BTCUSD holds above the Buyer Zone and respects the rising support line, the bullish structure remains intact. A clean breakout and acceptance above the 93,700 Resistance Level would confirm continuation toward the next upside target (TP1). However, a strong rejection from resistance could lead to a corrective pullback back into the Buyer Zone before any further attempt higher. For now, price remains compressed between support and resistance, and a decisive move is likely soon. Please share this idea with your friends and click Boost 🚀
Crypto
EURUSD Price Action - Support Holds at 1.1670, TP Near 1.1720Hello traders! Here’s my technical outlook on EURUSD (1H) based on the current chart structure. After trading inside a clearly defined range, EURUSD broke to the upside, showing initial buyer strength. However, this bullish move failed to sustain, and price turned around, transitioning into a descending channel. Within this channel, price respected both the falling resistance line and the internal support, forming a consistent sequence of lower highs and lower lows, confirming short-term bearish control. During the decline, EURUSD moved into the Seller Zone, where selling pressure remained active and pushed price lower toward the Buyer Zone. This Buyer Zone aligns with a key Support Level and represents an area where demand previously entered the market. From this level, price reacted strongly, producing an impulsive move up and a clear breakout from the descending channel, signaling a potential shift in short-term structure. Currently, price is holding above the reclaimed support, suggesting acceptance above the former bearish structure. My scenario: as long as EURUSD holds above the Buyer Zone and maintains support, a continuation move toward the Resistance Level around 1.1720 (TP1) is possible. This area also overlaps with the Seller Zone, where selling pressure may reappear. If price fails to hold above support and falls back below the Buyer Zone, the bullish scenario would weaken and the broader bearish structure could resume. For now, price is at a key decision area, with buyers attempting to confirm the breakout and build further upside momentum. Please share this idea with your friends and click Boost 🚀

How High Could ETH Price Go After Breaking the EMA Band?* The ETH price is sitting on a support area that’s quietly doing a lot of work right now.
* Momentum is starting to turn, but ETH still has a big technical hurdle to clear overhead.
* If the price can push through resistance, the whole structure could start to look very different.
Looking at Ethereum right now, the overall vibe feels very different from earlier in the cycle. There’s no panic selling, no sharp breakdowns, and no sense that the market is rushing for the exits.
Instead, the ETH price looks like it’s finding its balance. After defending the $2,700–$2,800 support zone, price has stopped drifting lower and moved into a tighter, sideways range. It’s not exciting price action, which is exactly why many traders overlook it.
Ethereum has been moving within a fairly narrow band. Volume has cooled, momentum has slowed, and things feel quiet. If you’re waiting for a fast breakout, this phase can be frustrating. Nothing dramatic is happening, so attention fades. But this is often the part that matters.
Ethereum isn’t slipping back into its old downtrend. Dips toward support keep attracting buyers, while moves higher stall under resistance. Sellers aren’t pushing aggressively anymore, and buyers aren’t chasing the price either. What’s forming is balance.
That kind of balance usually shows up when a market is adjusting after a structural shift. Trends rarely restart in a straight line. They pause, compress, and test patience before the next move appears.
On-chain data supports that view. Ethereum’s market cap has stayed steady, and network activity is improving. Active addresses and transactions are ticking higher even as price moves sideways, suggesting participation is quietly building underneath.
What’s next for ETH?
For now, structure matters more than hype. As long as the ETH price holds higher support while grinding below the EMA band, the setup stays constructive. Ethereum may look calm, but that calm often comes before a more decisive move.

BTC Intraday – Context UpdateAfter yesterday's decline, the price is now trading at 91,150.
From here, I am watching for a potential continuation of the decline to 90,300-90,000, where there is a zone of strong reaction.
This zone will be key:
-No buyer reaction and pressure → the decline may continue.
-Buyer acceptance and reaction → potential intraday long context, only with confirmation.
At this stage, this is a contextual reflection, not a signal to execute.
Bias follows structure — execution follows confirmation.
Stay tuned for updates as the structure develops.

ETH Is Quietly Building Power – The Real Move Starts Above 3,164Ethereum on the H1 timeframe is currently showing a classic bullish re-accumulation structure after a volatile corrective phase. Following the sharp sell-off earlier, price has stopped making lower lows and instead started to compress within a clearly defined range, indicating that selling pressure is being absorbed rather than extended. This is an important behavioral shift in market structure, often seen before an expansion leg.
From a structural perspective, the 3,087 – 3,120 zone is acting as a solid demand base. Each dip into this area has been met with buying interest, suggesting smart money is defending the lows. The most recent higher low around the 3,119 region reinforces the idea that ETH is transitioning from correction to continuation, not reversal. As long as price holds above this base, the bullish structure remains intact.
The key level to watch is 3,164, which represents the short-term range high and a liquidity-rich resistance zone. A clean break and acceptance above this level would confirm a break in bearish order flow on H1, opening the door for an impulsive move higher. If that breakout occurs with momentum, price has a clear path toward the 3,220 zone, where previous imbalance and resting liquidity sit.
The key level to watch is 3,164, which represents the short-term range high and a liquidity-rich resistance zone. A clean break and acceptance above this level would confirm a break in bearish order flow on H1, opening the door for an impulsive move higher. If that breakout occurs with momentum, price has a clear path toward the 3,220 zone, where previous imbalance and resting liquidity sit.
In the bullish expansion scenario, once ETH reclaims 3,164, any shallow pullback into that level would be considered a high-probability continuation entry, targeting the upper resistance near 3,250. This projected move aligns well with a typical cycle transition: accumulation → compression → expansion. The curved price projection highlights how ETH may accelerate once range highs are taken, as late sellers are forced to cover.
However, if price fails to break 3,164 and instead pulls back, the preferred bullish expectation remains valid as long as ETH holds above the 3,087 support. A deeper retracement into demand would still be viewed as a corrective move within a larger bullish leg, not a signal to flip bearish.
In summary, Ethereum is not weak it is loading. The market is waiting for confirmation, and that confirmation comes with acceptance above 3,164. Until then, patience is key, because when ETH moves out of compression, it rarely does so quietly.

Bitcoin Is At Supply – This Rally Looks ExhaustedBITSTAMP:BTCUSD on the M30 timeframe is currently trading into a clearly defined supply zone, and the context of the move strongly suggests this is a corrective rally within a broader distribution range, not the start of a new bullish leg. The recent impulsive push higher was sharp and emotional, but price has now stalled exactly where sellers previously stepped in aggressively a classic warning sign.
From a market structure standpoint, BTC has not established a clean bullish trend. Instead, price continues to oscillate between premium (supply) and discount (demand) zones, forming a range-like structure with liquidity runs on both sides. The current push into the 92,400–92,600 region represents a move into premium, where risk to reward for fresh longs becomes unfavorable and selling pressure typically increases.
The interaction with the moving averages further supports this view. Price is extended above the short-term EMA while the longer EMA is still lagging below, a configuration that often precedes a mean reversion move. In bearish or neutral conditions, these extensions into supply tend to attract profit-taking from late buyers and short positioning from more patient sellers.
The rejection wick printed inside the supply zone is particularly important. It signals sell-side interest and rejection of higher prices, suggesting that smart money is distributing positions rather than accumulating. This behavior aligns with the projected path: a short-term pullback, a weak corrective bounce, and then a continuation move lower as liquidity below the range becomes the next target.
On the downside, the 90,200–90,400 demand zone stands out as the primary magnet. This area previously triggered strong buying reactions and remains unmitigated, making it a high-probability destination if price rolls over from supply. A move back into this zone would not be surprising — it would simply complete another rotation within the broader structure.
In summary, Bitcoin is not breaking out it is reacting at supply. As long as price remains capped below the supply zone and fails to build acceptance above it, the higher-probability scenario favors downside continuation toward demand. In this market, patience is rewarded, and chasing strength near supply is exactly where traders tend to get trapped.

HNT Bull Trap… or the Start of a Massive Move?Yello Paradisers, did you notice what just happened with HNT? While most crypto traders were panicking due to the lower lows, we spotted a hidden bullish divergence forming, and it appears the market is now waking up to it.
💎 After weeks of trending inside a clean descending channel, #HNTUSDT just gave us the first real sign of a potential reversal. The move began with a sharp liquidity sweep below the descending support, trapping late sellers and triggering fresh demand exactly inside the major support zone between $1.307 and $1.363.
💎Zooming in, the MACD is showing a clear bullish divergence, price making lower lows while the MACD formed higher lows. Right after that, we got a bullish crossover, confirming momentum is shifting back in favor of the bulls. These are the exact kind of high-probability signals we wait for, and they’re not common.
💎Now that the price has broken above the descending structure, all eyes are on the next key levels. If HNT can maintain this momentum, we expect a test of the $1.445 area as minor resistance, where a temporary pullback could happen. However, if that level is claimed with strength, the next zone to watch is $1.539, followed by the strong resistance range between $1.730 and $1.74. This is where we'll reassess everything and prepare for either a continuation or rejection.
💎On the flip side, if #HNT breaks down and closes below $1.258, this whole bullish scenario will be invalidated. At that point, we’ll consider this a failed breakout and prepare for downside continuation. Until then, the structure looks strong and healthy.
Discipline, patience, and strategy always win.
MyCryptoParadise
iFeel the success🌴

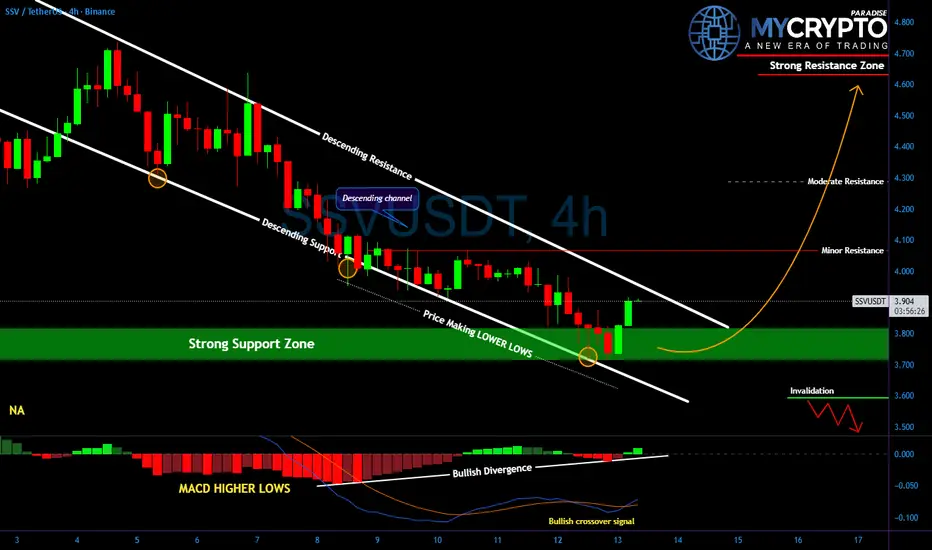
Traders Will Miss This SSV/USDT Reversal Until It's Too LateYello, did you catch that move off support on #SSVUSD? Because what just happened could be the beginning of a major shift, and latecomers might not get a second chance.
💎#SSVUSDT has been moving inside a clean descending channel, forming lower lows with each leg down, but now the price is bouncing right from the strong support zone that's held firm before. The reaction is already showing strength, and it's happening alongside a bullish divergence on the MACD, with higher lows forming while the price was making new lows. That’s a key early signal that momentum is shifting.
💎This type of confluence doesn’t happen by accident. The market is telling us that the sellers are exhausted, and smart money may already be loading up.
💎The structure is clear: if price breaks above the descending resistance, the next logical targets sit around 4.05, then 4.30, and ultimately 4.70 if momentum really kicks in. On the flip side, a clean break below 3.70–3.60 invalidates this reversal scenario and opens the path back toward 3.50.
Be patient, wait for structure to confirm, and stick to your plan. That’s what keeps you consistent while others chase.
MyCryptoParadise
iFeel the success🌴
At ResistanceBitcoin needs to push higher or it risks rolling over and continuing the larger downtrend.

BTC/USDT – 4H Chart Update. BTC/USDT – 4H Chart Update
The price is still trading within a descending triangle/wedge, with clear compression visible.
BTC is trading just below a major horizontal supply area (≈ 94K).
Trendline support + moving averages are holding around the 90K–91K area.
Bounce from the trendline: Could trigger a short-term move towards the supply zone.
Clear breakout and close above the upper trendline: Confirms bullish continuation and opens the way for higher levels.
Rejection from supply again: Could lead to another pullback towards the trendline support.
The market is in a decision phase. The bias will only turn bullish upon a confirmed breakout. Until then, expect range-bound volatility and respect the key levels.

JOE Holding Rising Trendline Support – Key Reaction Zone in PlayJOE is currently in a corrective phase after a strong impulsive move, trading within a rising structure. Price is holding above the ascending trendline while reacting around the 0.236–0.382 Fibonacci retracement zone. As long as this region holds, continuation toward higher levels remains valid. A breakdown below 0.0626 would invalidate the bullish structure and expose deeper downside toward 0.0544.

BITCOIN (BTCUSD): Road to 100k
Bitcoin finally completed a bullish accumulation within
a huge ascending triangle pattern on a daily..
There is a high probability that the market will continue
rising now.
The next strong resistance cluster is 98800 - 101200 area.
I think that it will be reached soon.
❤️Please, support my work with like, thank you!❤️
I am part of Trade Nation's Influencer program and receive a monthly fee for using their TradingView charts in my analysis.

ETH Is Holding the Line — A Technical Reversal Toward Multi-Leve1. Current Market Structure
Ethereum is currently transitioning from a short-term bearish correction into a potential recovery phase on the H1 timeframe. After a prolonged decline, price has stabilized and formed a base above a well-defined support zone, suggesting selling pressure is weakening. Although price is still trading below the EMA 89, momentum has started to shift as buyers defend key levels.
2. Key Support & Resistance Levels
Primary Support Zone: 3,085 – 3,100
→ Strong demand reaction, multiple rejections
EMA 89 Resistance: ~3,115
→ Needs to be reclaimed for bullish continuation
Upside Targets:
🎯 Target 1: 3,178
🎯 Target 2: 3,221
🎯 Target 3: 3,254
🎯 Target 4: 3,297
These targets align with previous supply levels and structural highs, making them logical take-profit zones.
3. Price Action Insight
The market has shown a clear rejection from the lower support zone, followed by higher lows, which is often an early signal of accumulation. The projected green path highlights a step-by-step bullish progression, not a straight breakout meaning pullbacks are expected and healthy if support continues to hold.
4. Trading Scenarios
🟢 Primary Scenario – Bullish Recovery (Preferred)
Price holds above 3,085–3,100
Break and acceptance above EMA 89
Gradual push toward Target 1 → Target 4
🔴 Invalidation Scenario
A strong H1 close below 3,085
Would invalidate the bullish setup
Opens risk of continuation toward lower liquidity zones
🔹 Summary
Ethereum is currently at a technical inflection point. As long as price respects the highlighted support zone, the structure favors a controlled upside recovery toward higher resistance targets.
📌 Bias: Cautiously bullish confirmation comes with EMA reclaim.

Demand Zone Holds — Is ETH Preparing for a Trend Reversal?ETHUSD is currently transitioning out of a clear bearish phase into a potential basing structure. After an impulsive sell-off and extended trading below the descending EMA, price has now stabilized and pulled back into a well-defined demand zone, suggesting selling pressure is weakening. The recent price action shows loss of downside momentum, with shorter bearish legs and increased reaction buying from the lows a classic early signal of accumulation rather than continuation.
EMA & Momentum Context
Price is hovering around the EMA (dynamic resistance turned neutral). While ETH is not yet in a confirmed bullish trend, the EMA has started to flatten, which often precedes either:
- a range expansion to the upside, or
- a final liquidity sweep before reversal
Importantly, bears have failed to push price significantly lower despite multiple attempts — signaling absorption at demand.
Key Zones & Levels
- Demand Zone: 3,080 – 3,120
This is the critical area holding structure. As long as price remains above this zone, downside is considered corrective.
- Resistance / Upside Targets:
3,160 (first reaction level)
3,220 (range high / structure test)
3,275 (major resistance & liquidity target)
Scenario Outlook
➡️ Primary Scenario (Bullish Continuation):
Sustained support above the demand zone opens the path for a higher low formation, followed by a push toward 3,160 → 3,220. Acceptance above 3,220 would strongly confirm a trend reversal, targeting the 3,275 zone next.
⚠️ Risk Scenario (Range Failure):
A clean breakdown and acceptance below the demand zone would invalidate the bullish setup and expose ETH to renewed downside pressure. Until that happens, sellers are at a disadvantage.
Conclusion
ETH is no longer trending aggressively lower. Instead, the market is showing early-stage accumulation behavior, where patience favors waiting for confirmation rather than chasing moves. As long as demand holds, risk-reward continues to favor upside expansion.

Ethereum Is Defending Demand — A Base Is Forming for the Next UpEthereum on the H1 timeframe is showing clear signs of stabilization and early bullish rebuilding after a prolonged corrective phase. Following the sharp sell-off from the highs, price has transitioned into a sideways-to-recovery structure, with downside momentum slowing significantly as ETH continues to respect a well-defined demand zone around 3,080–3,100. Each dip into this zone has been met with strong buying interest, confirming that sellers are losing control and that sell-side liquidity has largely been absorbed. Price is now reclaiming short-term structure above this demand area and attempting to build higher lows, signaling a shift from pure bearish continuation into a corrective bullish phase. As long as Ethereum holds above the demand zone, the market bias favors further upside toward the first resistance around 3,160, followed by 3,220, and potentially a deeper extension toward the upper liquidity zone near 3,270–3,280 if momentum accelerates. Any short-term pullback into the demand zone should be viewed as constructive price action, not weakness. Only a decisive breakdown and acceptance below the demand zone would invalidate this recovery structure and reopen the downside scenario.

Bitcoin at Range EquilibriumBitcoin at Range Equilibrium: Re-Accumulation for a Push Higher or Another Liquidity Sweep Below?
Hello traders! Here’s a clear technical breakdown of BTCUSD (1H) based on the current chart structure. Bitcoin is currently trading within a broad consolidation range following a strong bullish impulse earlier in the session. After reaching the upper boundary of the range, price faced heavy selling pressure and rotated lower, signaling profit-taking and short-term distribution, not a full trend reversal. Since that rejection, BTC has entered a low-volatility, sideways structure, with overlapping candles and reduced momentum. This price behavior typically reflects balance and absorption, where the market is building liquidity before the next directional expansion. Importantly, there has been no impulsive bearish follow-through, suggesting sellers are active but not yet in full control.
UPPLY & DEMAND – KEY ZONES
Upper Supply / Range High:
The 93,800–94,000 zone remains a major supply area, where previous bullish attempts were aggressively rejected. This is the key level that must be reclaimed for upside continuation.
Mid-Range Resistance (Flip Zone):
The 92,000–92,200 level acts as an important structure flip. Failed acceptance above this zone confirms ongoing range conditions.
Major Demand / Range Low:
The 89,500–89,800 area is a well-defined demand zone and liquidity base. This zone has repeatedly absorbed selling pressure and represents the downside boundary of the current range.
A break on either side of these zones will define the next trend leg.
🎯 CURRENT MARKET POSITION
Currently, BTC is trading near the middle-to-lower portion of the range, where directional conviction is typically weakest. This is a decision area, not an optimal breakout zone, as price can rotate aggressively in either direction. The market is compressing, indicating energy buildup rather than trend confirmation.
My scenario:
As long as Bitcoin holds above the 89,500–89,800 demand zone, the broader structure remains neutral-to-bullish. A successful defense of this demand could lead to a rotation back toward 92,000, and acceptance above that level would open the path for a test of the 93,800–94,000 supply zone. However, if price fails to hold the range low and accepts below demand, this would confirm a liquidity sweep and bearish continuation, exposing lower prices before any meaningful recovery attempt. For now, Bitcoin is ranging and waiting for confirmation, not trending.
⚠️ RISK NOTE
Range conditions often produce false signals. Let price confirm acceptance or rejection at key zones, avoid overtrading the middle of the range, and always manage your risk.

Post-Rally Consolidation, Awaiting CatalystHello everyone,
Bitcoin is no longer in an expansion phase of the uptrend, but has shifted into a consolidation phase following the recent rally.
From a structural perspective, the medium-term uptrend remains intact. Bitcoin continues to print higher highs and higher lows, with price holding above both the EMA 34 and EMA 89, while these two moving averages are still sloping upward. The key point here is that sellers have not been able to trigger any meaningful breakdown, especially failing to force a clear close below the EMA 89 — the critical dynamic support of the current trend.
After setting a high around the 94,000 area, BTC pulled back and began moving sideways within a relatively tight range around 91,000–92,000. Many interpret this phase as a sign of weakness, but in my view, this behavior looks more like post-trend accumulation rather than distribution. The trading range is narrowing, volume is gradually declining, and each dip toward the EMA 89 is quickly met with buying interest, indicating that defensive capital is still present. A truly weak market would show a decisive break below the EMA 89, followed by aggressive selling on rebounds — and so far, that scenario has not materialized.

Are tech stocks about to surge? Nasdaq New Highs? The market is very close to making a big move.
We believe the market is still bullish and will likely trend higher.
Today crypto was strong when the market was weak. This could be signaling tech is about to capture some bullish liquidity.
Banks got decimated today, which allows lots of capital to rotate back into tech.
The Nasdaq is lagging and the only indices to not make new all time highs.

Monero Breaks All-Time Highs As Bullish Structure Points HigherMonero (XMRUSD) is now aggressively breaking into new all-time highs, in line with expectations. On the monthly chart, price action continues to suggest significant room for further upside. Monero may be unfolding a five-wave bullish impulse, or alternatively, breaking out from a larger bullish triangle formation. In both scenarios, the technical picture supports much higher levels.
On the weekly timeframe, we are still tracking a projected extended wave (5) of wave 3. Fibonacci cluster targets continue to point toward the 1000 area before a higher-degree wave 4 correction is expected to unfold. At the moment, price appears to be rising within subwave 3 of an ongoing five-wave bullish impulse for wave (5). This suggests that additional gains are likely in the near term.
That said, traders should remain aware of a potential subwave 4 pullback, which would be a normal part of the structure, before a renewed bullish continuation in subwave 5 of wave (5) of 3.

SOL 1D Update: Looking to establish new uptrendSOL update.
SOL is now establishing a new short-term uptrend after spending months inside a descending channel. The key shift is structural: price has broken out of the downtrend and is no longer making lower lows. Instead, it’s holding above former support around the $125 level and building higher lows, which is exactly what you want to see in an early trend transition.
The move higher toward the $140–145 area has been more controlled and constructive than prior bounces. Instead of sharp relief moves that fade immediately, SOL is grinding higher and holding gains, suggesting real demand rather than just short covering.
This strength is also starting to show up across the Solana ecosystem. Several SOL meme coins are attempting to break out of their own basing structures, which typically happens when SOL itself stops trending down and begins to lead. That kind of breadth is important and often precedes stronger continuation if it sustains.
Key levels to watch:
As long as SOL holds above $125, the uptrend structure remains intact.
Acceptance above $145 opens the door for a move toward the $160–180 region, where heavier resistance sits.
A failure back below $125 would invalidate the breakout and shift this back into range behavior.
Overall, SOL’s character has changed from sell-the-rip to buy-the-dip. It’s still early and likely to be choppy, but the market is finally starting to lean in the right direction. If this structure holds, both SOL and its meme ecosystem have room to expand further.

#VET Ready for a Major Bullish Move | Key Levels to Watch Yello, Paradiser! Is #VeChain about to trap all the late bears, or are we about to witness one more brutal shakeout? Let's view the #VETUSDT trading setup:
💎#VET is currently trading around $0.0116 on the 1D timeframe, and just completed a breakout from a textbook Falling Wedge, one of the most reliable bullish reversal patterns when combined with confirmation signals.
💎The breakout has already occurred, and most importantly, it is now retesting the descending resistance to validate this breakout. This is often a critical validation of strength and suggests the move is likely not a fakeout. In addition, we’ve already seen a bullish crossover on the momentum oscillator, which adds further confirmation to this bullish setup.
💎The Strong Demand Zone between $0.0094 and $0.010 is now acting as the base of this bullish structure. Holding above this level is essential. If bulls continue to defend this zone, we anticipate a potential push toward the first major resistance at $0.0138, followed by the strong resistance area between $0.019 and $0.020, where sellers are likely to step in more aggressively.
💎Below the structure, we’ve clearly marked Key Support at $0.0078 for #VETUSD. If price closes below this zone, it would invalidate the bullish scenario and open the door for further downside, potentially into illiquid areas where volatility could spike.
Be patient, wait for structure to confirm, and stick to your plan. That’s what keeps you consistent while others chase.
MyCryptoParadise
iFeel the success🌴

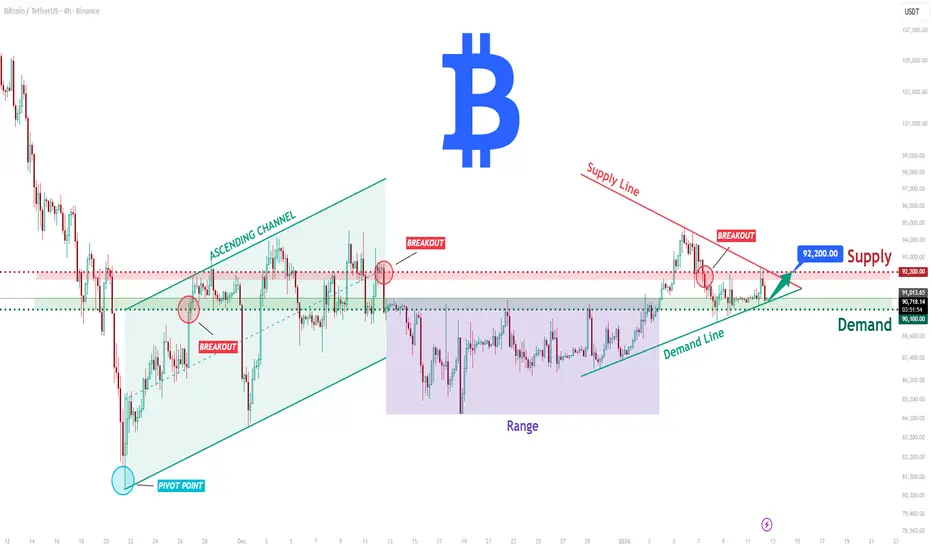
BTCUSDT Long: Demand Holding at 90,100 - Eyes on 92,200 SupplyHello traders! Here’s a clear technical breakdown of BTCUSDT (4H) based on the current chart structure. After a strong bearish move, BTC formed a clear pivot low, from which price transitioned into a bullish recovery phase. From this pivot point, the market developed a well-defined ascending channel, confirming a shift in market structure and increasing buyer control through a sequence of higher highs and higher lows. This channel guided price higher until BTC reached a key Supply Zone around 92,000–92,200, where selling pressure emerged. At this supply area, price experienced a rejection and breakout failure, indicating that sellers are actively defending this level. Following the rejection, BTC briefly broke below short-term structure and moved into a consolidation range, reflecting temporary balance between buyers and sellers. More recently, price has started to recover again, respecting a rising Demand Line, which signals that buyers are still defending the broader bullish structure.
Currently, BTC is trading between a key Demand Zone near 90,100–90,300 and the overhead Supply Zone around 92,200. This area represents a critical decision zone for the market, where the next directional move is likely to be defined.
My scenario: as long as BTCUSDT holds above the Demand Zone and continues to respect the rising demand trend line, the bullish bias remains valid. I expect buyers to attempt another push toward the 92,200 Supply Zone. A clean breakout and acceptance above this level would confirm bullish continuation and open the door for further upside. However, a strong rejection from supply followed by a breakdown below demand would weaken the structure and increase the probability of a deeper corrective move. For now, price remains in a compression phase between demand and supply — patience and proper risk management are key. Manage your risk!
SOLUSDT – Daily Follow-Up UpdatePrice is reacting well after bouncing from daily support.
We’re now pushing into a key resistance zone that previously acted as support.
Bullish scenario:
A clean daily close above resistance + successful flip into support opens the door for a move toward the daily FVG around 170–176.
That level is the main upside target.
Bearish scenario:
Failure to hold this resistance could lead to a rejection and a move back toward daily support / lower FVG.
Bias stays neutral → bullish, but confirmation is required.
No breakout = no trade.
👉 Do you expect SOL to flip this level and continue higher, or will we see another rejection?
MrC
