The one thing that destroys tradersEmotional inflation is a measurable drag on trading performance, particularly in crypto where momentum cycles are short, liquidity is thin, and feedback loops are fast. After a trader strings together strong wins, confidence often expands faster than process. The trader begins to treat recent outcomes as a new baseline for risk. This leads to size increases, earlier entries, or skipping structural confirmation because the mind assumes the market will continue to cooperate. It feels logical in the moment, but it is not rooted in market behavior. The market eventually tests this inflated confidence through liquidity sweeps, compressed volatility, or reclaiming defensive structure. The result is capital giveback, distorted expectations, and emotional volatility that exceeds price volatility.
The cost of emotional inflation is not that it creates bad trades. The cost is that it removes the conditions that made your best trades possible. When confidence accelerates exposure before the market proves continuation through structure and liquidity, you are no longer trading opportunity. You are trading assumption. Crypto punishes assumption faster than most markets because liquidity leaves quickly, bid depth changes abruptly, and breakout traders provide easy fuel for counter moves.
Inflation becomes visible in three repeatable behaviors: increasing size during expansion phases instead of compression phases, entering at the first touch of a level instead of after a structural transition, and treating recent wins as proof of future market cooperation. These behaviors are not personality flaws. They are pattern loops that can be corrected with objective rules and sequencing.
To counter emotional inflation, you need guardrails that do not depend on feelings. The first guardrail is a fixed sizing model tied to volatility conditions, not P&L conditions. Size should increase only when volatility tightens, liquidity aligns cleanly, and structure confirms control. In expansion phases, size must stay anchored to predefined limits because invalidation distance widens when liquidity thins. This keeps risk mathematically stable while confidence psychologically fluctuates.
The second guardrail is daily narrative rebuilding. Bias is constructed from the higher timeframe story, not the previous trade’s outcome. If the weekly and daily structure have not changed, your job is to wait for liquidity incentives and micro-structural permission before expanding exposure. A trader who rebuilds bias every session stays psychologically neutral when the market is structurally neutral.
The third guardrail is retest discipline. A retest is not a candle. It is acceptance. The retest validates participation, reduces invalidation distance, and reveals whether the market internalized the structural break or sweep. Entering before the retest is entering during the liquidity hunt. Entering after the retest is entering after participation is proven. This is where professionals position, not because they are late, but because they are validated. Retests compress emotional cycles because they remove the need to hope a level will hold.
The fourth guardrail is execution quality scoring.
Track trades by sequence: liquidity taken first, structure broken second, displacement confirmed third, retest respected fourth. Grade your execution on fill precision, conditional sizing, and narrative alignment. This shifts confidence from results to behavior, which compounds careers instead of compressing them.
A journal becomes a solution only when it measures variables that lead to intervention, not reflection. Measure session volatility, invalidation distance, average R:R delivered, liquidity incentives present, and whether the entry occurred inside premium or discount relative to equilibrium. This reveals inflation risks before they hit your equity curve.
Emotional inflation loses its power when you treat streaks as feedback, not permission. The best funded crypto traders do not compound because they avoid risk. They compound because they only expand risk when the market contracts volatility, aligns liquidity, and confirms structure. Confidence should drive preparation, not replace it.
Calibration compounds. Inflation decays. Careers are built by traders who stay calibrated longer than they stay confident temporarily.
Crypto

XRP - From Support to Momentum Shift!Let’s break this one down step by step.
On the left chart, (Weekly chart) XRP just rejected a very strong weekly support zone around $1.75 – $1.90. This level has been rejected multiple times in the past, and once again, buyers stepped in!
Now shifting to the right chart , (Daily chart) this is where things get interesting.
After months of downside pressure, momentum officially flipped from bearish to bullish. XRP managed to:
• Break above the falling red channel
• Take out the last major daily high marked in blue
That’s a classic sign of a momentum shift, not just a random bounce.
At the moment, price is correcting, which is healthy after such a move.
As long as this correction remains controlled, my focus is simple:
I’ll be looking for longs, targeting the supply zone marked in green above.
If structure continues to hold, dips are no longer something to fear... they’re something to watch closely.
Is this the start of a larger XRP rotation… or just the first step? 🤔
⚠️ Disclaimer: This is not financial advice. Always do your own research and manage risk properly.
📚 Stick to your trading plan regarding entries, risk, and management.
Good luck! 🍀
All Strategies Are Good; If Managed Properly!
~Richard Nasr

Altcoins Market ETA- So this graphic show only Cryptos and when i speak only Cryptos, it means " No BTC, No ETH, Not Stablecoins ", Only Altcoins !
- This post is not a price prediction, not a FUD, and not a FOMO, it's just my own opinion based on facts.
- Without BTC/ETH and Stables, the crypto market barely reaches $580B MC, a nutshell in the ocean of global finance. Cryptos have already been rejected four times around the $900B MC.
----------------------------------------------------------
- In 2021 we had DeFi.
- In 2022 we had L1/L2 wars.
- In 2023 we had AI.
- In 2024 we had memecoins.
But 2025 has no new narrative.
----------------------------------------------------------
Cycles always go like :
BTC → ETH → Large caps → Mid caps → Micro caps
but this time :
- There's too many new tokens, too many VCs and early insiders droping on retails.
- Altcoins are falling due to a lack of liquidity, no compelling narrative, and absent buyers, while market makers focus on protecting themselves with BTC and stablecoins. ( Dyor on what happened on 10th October 2025 ).
- Right now, most people are holding their breath, waiting for the Fed to launch the next round of QE and another rate cut.
- Money makes Money, the world is working like that.
- My advice for now: be patient. If you already hold crypto and believe in your projects, just HODL. If you’re new to crypto, stay on the sidelines and wait until the market surpasses $1 trillion.
- Comments are welcome but stay sharp and thoughtful.
Be Safe!
Happy Tr4Ding !

BTC - Shakeout Complete… Is the Trap Set???Bitcoin just delivered a classic manipulation move into the higher-timeframe demand zone❗️ The sharp sell-off below structure flushed late longs and triggered stops, only to be quickly reclaimed.
That’s not weakness. That’s intent.
📉📈From a structural perspective , this demand zone has already proven itself before. Price reacted strongly from it in the past, and once again, buyers stepped in aggressively after the sweep. This suggests the downside move was more about liquidity than genuine trend reversal.
⁉️ Now comes the key question.
⚔️As long as BTC holds above this demand and continues to build acceptance, the focus shifts to a recovery move back into the prior structure and supply zone above. That area will be the real test, whether this bounce is just a correction, or the start of a larger continuation.
For now, patience is key. Let price show its hand near demand before committing.
Is this the reset before the next leg higher, or just a temporary relief bounce? 🤔
⚠️ Disclaimer: This is not financial advice. Always do your own research and manage risk properly.
📚 Stick to your trading plan regarding entries, risk, and management.
Good luck! 🍀
All Strategies Are Good; If Managed Properly!
~Richard Nasr

Bitcoin - Compression Before Expansion?⚔️Bitcoin has been absorbing pressure above a rising base , with price holding firmly above the ascending blue trendline. Despite the prior selloff, bears are no longer able to push price lower, signaling structural strength building beneath the surface.
Price is now pressing against a key resistance band. This zone is acting as the final barrier between consolidation and continuation. A clean break and hold above this area would shift control decisively back to the bulls and open the door for a move toward the 100K psychological level and beyond.📈
🏹Until then, the bias remains cautiously bullish , with buyers clearly defending dips and preparing for a potential expansion phase.
Is this the calm before Bitcoin’s next leg higher?🤔
⚠️ Disclaimer: This is not financial advice. Always do your own research and manage risk properly.
📚 Stick to your trading plan regarding entries, risk, and management.
Good luck! 🍀
All Strategies Are Good; If Managed Properly!
~Richard Nasr

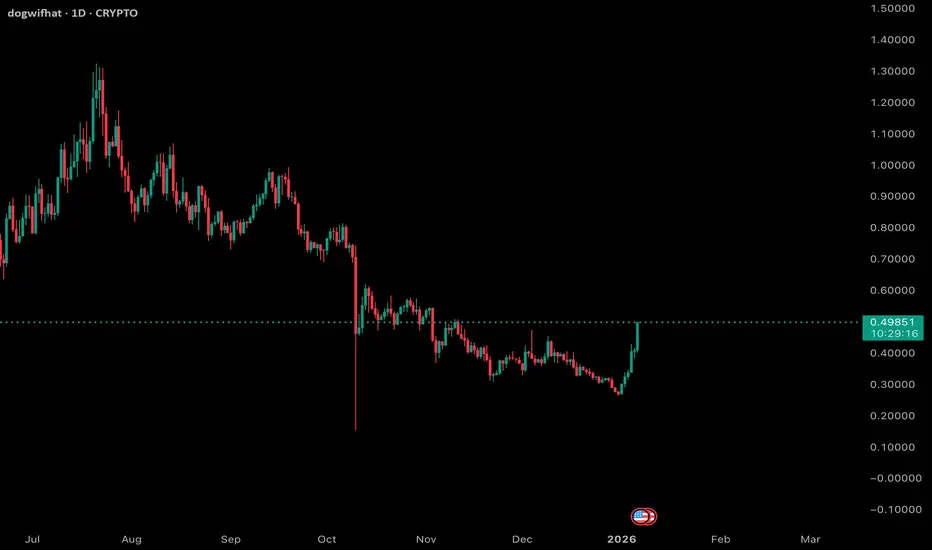
$WIF 1D Update: The pump is starting... SOL memes coming back? WIF is finally starting to show some strength on the daily. After a long period of basing and grinding near the lows, price is now pushing higher with an impulsive move rather than another weak bounce. That’s a meaningful change in character compared to what we’ve seen over the past few months.
This pump is coming after extended compression and seller exhaustion, which is typically where sharper relief moves can originate. The reclaim of the recent range highs suggests buyers are stepping in with more conviction, not just short covering.
That said, this is still early. One green candle doesn’t flip the higher timeframe trend by itself, but it does shift the short-term bias from purely defensive to cautiously constructive. If price can hold above this breakout area and avoid immediately retracing the move, it increases the odds that this is more than just a dead cat bounce.
Overall, WIF is looking better than it has in a while. I’m watching closely to see if this strength can build into follow-through and higher lows rather than fading back into the prior range.
Micro Silver Futures Rally Into Supply With Potential Pullback
This is a 2-hour Micro Silver Futures (COMEX) chart** showing price action from mid-December into early January 2026.
Trend context:
Price previously moved higher within an upward channel, indicating a strong bullish phase. That trend later transitioned into range-bound and corrective price action.
Supply zone (upper red band ~79–80)
The chart highlights a clear **supply/resistance area** where price was previously rejected. Current price is again approaching this zone, suggesting selling pressure may re-emerge.
Support zone / 1st target (~71–72)
A well-defined **support zone is marked below current price. This area acted as a reaction base multiple times and is labeled as the **first downside target** if price pulls back.
Lower support / 2nd target (~64–65)
A broader and deeper **demand/support zone** is identified as a **second downside target**, representing a more significant correction level.
Indicator structure:
The blue stepped lines (likely a volatility or channel-based indicator) show price oscillating between upper and lower boundaries, reinforcing the idea of **mean reversion between supply and support**.
* **Overall bias illustrated:**
The chart visually suggests **upside is limited near supply**, with arrows indicating a **potential downward move** toward the first support zone, and possibly the second if momentum weakens further.
In summary, the chart presents a market **testing resistance after a strong advance**, with clearly mapped **support levels below** that may come into play if a pullback occurs.

BTC/USDT (Bitcoin) long set upBTC Long set up
Entry Price 1: $90,500
Entry Price 2: $88,500
Stop Loss: $87,000
Take Profit 1: $93,500 (Close 25%)
Take Profit 2: $96,000 (Close 50%)
Take Profit 3: $99,500 (Close 75%)
Take Profit 4: $104,500 (Close 100%)
Status: ACTIVE

XRP Short-term analysis | Trading and expectationsCRYPTOCAP:XRP
🎯Price printed a bullish engulfing 3 white knight candle pattern, reclaiming the daily pivot and heading to test the daily 200EMA. Overcoming this will be very bullish. Wave 1 of 3 appears to be underway locally.
📈 Daily RSI has bearish divergence has been negated with yesterdays pump
👉 Analysis is invalidated below the swing low $1.8, keeping the downtrend alive.
Safe trading

SUI Short-term analysis | Trading and expectationsCRYPTOCAP:SUI
🎯Price printed a 3 white knight bullish engulfing pattern, reclaiming the daily pivot. Wave 3 of a new uptrend appears to be underway with a target of the daily 200EMA followed by $3.1
📈 Daily RSI bearish divergence has been negated
👉 Analysis is invalidated below $1.31, keeping the downtrend alive
Safe trading

SOL Short-term analysis | Trading and expectationsCRYPTOCAP:SOL
🎯Price caught a strong bid moving bullishly above the daily pivot but struggling at the High Volume Node resistance. Wave 1 of a new motif wave appears to be underway with an inital target of the daily 200EMA.
📈 Daily RSI has bearish divergence, price must get above $145 to negate this or face further downside.
👉 Analysis is invalidated below wave C, $110
Safe trading

ONDO Short-term analysis | Trading and expectationsLSE:ONDO
🎯Price printed a 3 white knight bullish engulfing pattern, jumping above the daily pivot and the descending resistance trend-line. Price must get above $0.5 to negate the bearish divergence that has emerged. Wave 1 of a new uptrend appears to be underway.
📈 Daily RSI tapped oversold with bullish divergence, where it caught a bid.
👉 Analysis is invalidated below the swing low, $0.35
Safe trading

HBAR Short-term analysis | Trading and expectationsCRYPTOCAP:HBAR
🎯Price caught a strong bid on bullish divergence, flipping the local structure bullish. However, bearish divergence has emerged at High Volume Node resistance. Price is above the daily pivot, which is bullish, but has a long way to go to reach the daily 200EMA.
📈 Price must get above $0.148 to negate the bearish divergence.
👉Analysis is invalidated below the swing low, keeping wave 2 alive.
Safe trading

ETH Short-term analysis | Trading and expectationsCRYPTOCAP:ETH
🎯Wave 1 appears to have completed a leading diagonal. Wave 2 appears complete with the recent higher high. Price was rejected at the daily 200EMA but is attempting to break through again. Overcoming this will be very bullish, especially as we are above the daily pivot.
📈 Daily RSI is printing bearish divergence. A move above wave (1) is essential to negate this, or prices could head to new local lows.
👉 Analysis is invalidated below wave (2)
Safe trading

DOGE Short-term analysis | Trading and expectationsCRYPTOCAP:DOGE
🎯 Price printed a bullish engulfing 3 white knight candle pattern. It is above the daily pivot, showing a bullish trend is emerging, but still below the daily 200EMA. Overcoming this will be very bullish. The Elliot wave count is tricky, so I will await more confirmation.
📈 Daily RSI has printed bullish divergence. The RSI shot up too hard and fast, which often results in a reversal, potentially testing the daily pivot as support.
👉 Analysis is invalidated below the swing low, keeping the downtrend alive
Safe trading

BNB Short-term analysis | Trading and expectationsCRYPTOCAP:BNB
🎯Price has closed above the daily 200EMA and daily pivot, suggesting a new bull trend has taken hold. If this is wave (3), we should expect a strong breakout in the coming days/weeks towards the all-time high. Wave 4 appears complete, with a textbook ABC correction ending at High Volume Node support.
📈 Daily RSI is currently showing bearish divergence across many altcoins, including BNB. A push above wave (1) will negate this divergence.
👉 Analysis is invalidated below wave (2), daily pivot and 200EMA.
Safe trading

AAVE Short-term analysis | Trading and expectationsCRYPTOCAP:AAVE
🎯 Price printed a bullish engulfing candle from daily RSI bullish divergence and High Volume Node support. It is currently testing the pivot. Overcoming this will add confidence to the bullish move, with a first target of the daily 200EMA and High Volume Node resistance at $220. Overcoming the daily 200EMA will add confluence to a major bottom being in.
📈 Wave (C) of triangle wave (D) appears to be underway. Daily RSI sits at the channel EQ and is crossed bullishly.
👉 Analysis is invalidated if we drop below $148, keeping wave (B) alive.
Safe trading

BTCUSDT Long: Uptrend Continues Toward 94,500 ResistanceHello traders! Here’s a clear technical breakdown of BTCUSDT (4H) based on the current chart structure. BTCUSDT initially traded within a well-defined descending channel, reflecting sustained bearish pressure during that phase. This move ended with a clear pivot point, followed by a strong breakout from the descending channel, signaling a shift in market control from sellers to buyers. After this breakout, price transitioned into a broad range, where BTC consolidated for an extended period, showing balance between supply and demand with multiple internal reactions.
Currently, BTC is approaching a key Supply Zone around the 94,500 level, where previous selling pressure is expected to re-emerge. This area aligns with the upper boundary of the ascending channel, increasing the likelihood of a reaction. Below current price, the Demand Zone near 86,800 remains a critical support level, marking the prior breakout area and the base of the bullish structure.
My scenario: as long as BTCUSDT holds above the Demand Zone and stays within the ascending channel, the bullish bias remains intact. I expect price to test the 94,500 Supply Zone, where a reaction or short-term pullback may occur. A clean breakout and acceptance above supply would signal further upside continuation. However, a strong rejection from supply followed by a breakdown below channel support would suggest a deeper corrective move. For now, structure favors buyers while price remains within the ascending channel. Manage your risk!

BTCUSDT: Sellers Defend 91,800 as Bullish Momentum WeakensHello everyone, here is my breakdown of the current BTCUSDT setup.
Market Analysis
BTCUSDT spent a significant period trading inside a well-defined range, where price oscillated between clear support and resistance levels, showing indecision and balanced participation from both buyers and sellers. Multiple breakout attempts from this range failed, confirming the strength of the boundaries and the lack of sustained momentum during that phase. Eventually, price broke out of the range to the upside and transitioned into a clean ascending channel, signaling a short-term bullish shift. This move was supported by higher highs and higher lows, reflecting increasing buyer control. However, as price approached the major Resistance Zone around 91,800, bullish momentum started to fade. The market printed reactions and hesitation near this resistance, indicating strong selling interest at higher levels.
Currently, the upper boundary of the ascending channel is being tested, and price is currently struggling to hold above the 90,000 Support Zone, which previously acted as a key breakout and demand area. The recent price action suggests that the upside move is losing strength and may be corrective rather than impulsive.
My Scenario & Strategy
My primary scenario: as long as BTCUSDT remains below the 91,800 Resistance Zone and fails to reclaim the upper part of the ascending channel, the bias favors a short-term bearish correction. A rejection from resistance increases the probability of a pullback toward the 90,000 Support Zone, which is the first key downside target. If this support fails to hold, further downside continuation toward lower range levels becomes possible.
However, a strong bullish breakout and acceptance above 91,800 would invalidate the short bias and open the door for renewed upside continuation within or above the channel. For now, price is at a critical decision area, with sellers defending resistance and buyers attempting to hold structure. Caution and proper risk management are essential in this zone.
That's the setup I'm tracking. Thank you for your attention, and always manage your risk.

Chainlink (LINK) Price Eyes a Push Toward the Top of Its Channel* The Chainlink price is trading inside a tight channel, with momentum slowly starting to pick up.
* On-chain data indicates steady, real network usage rather than short-term speculation.
* LINK is approaching the top of its channel, a level that could shape the next move.
If you step back and look at what Chainlink has been doing lately, one thing stands out right away: nothing feels rushed. There’s no panic, no aggressive selling, and no breakout mania either. LINK is just moving sideways inside a tight range, and that kind of price action tends to make people tune out because it feels boring.
For a while now, the LINK price has been slowly compressing inside its channel. Every bounce runs into resistance, and every dip finds buyers waiting. It’s the kind of market that feels awkward to trade because nothing follows through. Momentum traders lose interest, and the broader narrative around LINK goes quiet.
That’s exactly why this phase is important. LINK isn’t falling apart. Buyers are clearly defending the $12–$13 area, and sellers haven’t managed to push the price meaningfully lower. At the same time, buyers aren’t quite strong enough yet to break through the top of the channel. The market is paused, not weak.
This setup is nothing new for Chainlink. In past cycles, similar low-volatility stretches showed up near the end of long consolidation periods. Volume dried up, momentum flattened, and the price went nowhere long enough for most people to stop watching. When that happened, LINK often moved once expectations were low and positioning had thinned out.
On-chain data backs this up. Market cap has been creeping higher, active addresses are still rising, and transfer activity looks steady. That points to ongoing network use and gradual positioning, not speculation or large-scale selling.
So what comes next for LINK?
At this point, structure matters more than hype. As long as the LINK price holds its support zone and continues tightening beneath resistance, the setup stays intact. A move toward $14.63 with stronger volume would start putting real pressure on sellers.
Right now, LINK isn’t grabbing headlines. Price is grinding, volatility is low, and excitement is missing. But those quiet phases are often when things start to shift, especially for an asset that tends to move once the market stops paying attention.

Can #SNX Recover From Here or Will it Continue to Fall?Yello, Paradiser! Are you prepared for the moment when #SNXUSDT finally decides whether it will punish late bears or wipe out impatient longs? Let's look at the #Synthetix trade setup:
💎#SNX is currently trading around $0.418 on the 4H timeframe and remains stuck inside a clearly defined descending channel, respecting both the descending resistance and descending support with high precision. This type of structure tells us one thing very clearly: the market is compressing, and a decisive move is getting closer.
💎Price is now sitting just above a key demand zone around $0.38–$0.39, where buyers have already shown interest multiple times. This zone is crucial. As long as #SNXUSD holds above it, bulls still have a chance to regain control. The chart also highlights that a clean breakout above the descending resistance, combined with a reclaim of the 50 EMA as support, would significantly increase the probability of a bullish continuation.
💎If that bullish scenario plays out, the first upside target sits at the moderate resistance near $0.51, followed by a much more important strong resistance around $0.60–$0.61. A move toward those levels would likely happen fast, as many traders are currently positioned defensively and would be forced to react to a breakout.
💎However, this setup comes with a very clear invalidation. If price loses the $0.38 support zone decisively, the bullish idea is off the table. A breakdown below this level would confirm weakness and open the door for a deeper move toward the $0.33 support zone, where the next significant liquidity sits. That scenario would likely come with increased volatility and emotional selling from inexperienced traders.
Trade smart, Paradisers. This setup will reward only the disciplined.
MyCryptoParadise
iFeel the success🌴

TOTAL3/BTCTOTAL3/BTC is holding very good and continue to breaks the resistance very likely in the coming weeks. All-season may be so close

BTC/USDT | Going higher? (READ THE CAPTION)In the 4H chart of BTCUSDT we can see that it finally broke through the bearish OB and going into the FVG zone, reaching 94,789, and it swept the liquidity pool above the 94,700 level, but it dropped in price afterwards and is now being traded at around 93,300. I expect BTC to retest the FVG again.
Current targets for now: 94,100, 94,800, 95,500 and 96,200.
