BTC/USDT | More Bullish Move Ahead ? Let's See!By analyzing the CRYPTOCAP:BTC chart on the Daily timeframe, we can now confirm a powerful breakout above previous resistance. Bitcoin surged to $94,800 and is currently trading around $92,500.
If price manages to sustain above the key $90,000 level, the bullish scenario strengthens, and we may see an extension toward higher targets. The next key resistance zones to watch are $97,000, $99,000, $101,400, and $104,000.
The bias has shifted from bearish to bullish, but only if $90K holds as new support. Momentum remains in buyers’ hands as long as structure and volume confirm this shift.
Please support me with your likes and comments to motivate me to share more analysis with you and share your opinion about the possible trend of this chart with me !
Best Regards , Arman Shaban
Crypto

#BTCUSDT #12h (Bitget) Descending trendline breakout [LONG]Bitcoin looks ready for short-term recovery after regaining 100EMA support and pulling back to it.
⚡️⚡️ #BTC/USDT ⚡️⚡️
Exchanges: Bitget Futures
Signal Type: Regular (Long)
Leverage: Isolated (8.0X)
Amount: 4.7%
Current Price:
92299.9
Entry Zone:
92024.8 - 90186.8
Take-Profit Targets:
1) 96927.7
2) 101312.3
3) 105696.9
Stop Targets:
1) 86234.0
Published By: @Zblaba
CRYPTOCAP:BTC BITGET:BTCUSDT.P #12h #Bitcoin #PoW bitcoin.org
Risk/Reward= 1:1.2 | 1:2.1 | 1:3.0
Expected Profit= +51.1% | +89.6% | +128.1%
Possible Loss= -42.8%
Estimated Duration= 3-4 weeks

BTC is on Weekly trendline Area : New ALL Time High ?BTC is on Weekly trendline Area : New ALL Time High ?
I am seeing BTC cross above 150k

ORDI – Daily Zoomed-In UpdatePrice is still trading below a key reclaimed level that previously acted as strong support.
This level is now acting as resistance and needs to be reclaimed for bullish continuation.
Recent price action shows a potential deviation below support, followed by acceptance back into the range.
If this deviation holds, it can act as a spring for a larger move.
Key idea:
No FOMO here.
Bullish continuation only makes sense after a clean reclaim and hold above resistance.
Key levels to watch:
Support: range lows / deviation area
Resistance: prior support level that must be reclaimed
Acceptance above resistance opens the path toward higher range targets.
Failure to reclaim keeps ORDI range-bound and vulnerable to another sweep lower.
Not financial advice. Always manage risk.
👍 Like if you’re still tracking ORDI
💬 Do you expect a clean reclaim or another deviation first?
MrC

Chainlink (LINK) – Spot Long Setup DevelopingWe're watching LINK closely as it approaches a key support zone that could act as a springboard for a reversal on the higher time frames. A pullback into this area may offer a high-risk/reward long entry, especially if bullish structure begins to form again.
🔹 Entry Zone: $12.50 – $13.50
🔹 Take Profit 1: $15.50 – $16.50
🔹 Take Profit 2: $19.00 – $21.00
🔹 Stop Loss: Weekly close below $12.00
This setup relies on price respecting the major support level. If we see a weekly candle close below $12, that would invalidate the idea and call for reassessment. Until then, it's a technical setup worth tracking for patient spot traders.

BTC $94.5K Fatigue: Decoding the $92.3K Line in the SandBitcoin (BTC/USD) Technical Breakdown
Bitcoin recently completed a steep impulsive move, encountering significant selling pressure at the Resistance Zone ($94,400 – $94,600). The appearance of long upper wicks (rejection candles) at this level confirms that profit-taking is underway, pushing price back to test internal liquidity.
The pair is currently trading near the blue EMA, which serves as immediate dynamic support. However, the short-term bias remains tilted toward a deeper "healthy pullback" to re-accumulate buy orders. The Support Zone around $92,300 is the critical "pivot area" where institutional demand is expected to resurface.
Key technical scenarios:
- Base-case scenario: Following the projected path on the chart, BTC is likely to continue its retracement toward the $92,300 support. A bullish reversal signature (such as a pin bar or engulfing pattern) at this level would confirm a Higher Low (HL) and set the stage for a recovery test of $93,300 and beyond.
- Bullish continuation: Should the bulls defend the $92,900 level and decisively reclaim $93,500, the correction may end prematurely, opening the door for an immediate retest of the $94,500 supply zone.
- Bearish risk: A decisive close below the $92,000 psychological level would invalidate the immediate bullish structure. This would expose BTC to a deeper correction toward $91,000 or the $90,000 liquidity pool.
Macro Drivers Impacting Bitcoin
As of January 2026, Bitcoin's price action is heavily influenced by institutional flows and global macro shifts:
- ETF Inflows & Institutional Floor: The maturity of Spot ETFs has created a persistent "floor" for price. Current volatility is likely driven by early-year portfolio rebalancing by major asset managers.
- Monetary Policy & Fed Outlook: Market participants are closely monitoring Fed signals. Expectations of quantitative easing or rate pauses in Q2 2026 continue to support the long-term "debasement trade" narrative, favoring BTC.
- Geopolitical Risk Premium: Ongoing tensions in key global regions (Middle East/Eastern Europe) reinforce Bitcoin’s status as "Digital Gold." Safe-haven flows tend to limit the downside during macro uncertainty.
- Risk-On vs. Risk-Off Sentiment: The Fear & Greed Index remains in "Greed" territory. While the trend is bullish, this high sentiment often precedes "liquidity sweeps" where over-leveraged long positions are flushed out at key support levels.
Summary
Technically, Bitcoin is undergoing a textbook correction after hitting a major resistance ceiling. This phase is essential for market health, allowing for the rotation of capital and the removal of weak-handed leverage.
The $92,300 support is the line in the sand. As long as price holds above this zone, the broader bullish trend remains intact. Traders should remain disciplined, waiting for confirmed price rejection at support rather than chasing the move mid-range.

ETH/USDT | Testing the FVG! (READ THE CAPTION)By analysing the 2h chart of ETHUSDT we can see that after struggling with the high of the FVG for a while, it finally managed to break free and go up to 3265, $8 lower than the low of the FVG. I'd like to see ETHUSDT test the FVG and then make a decision on which way to go.
For the time being, the bullish targets are: 3223, 3265 and 3297.
Bearish Targets: 3200, 3170, 3140.

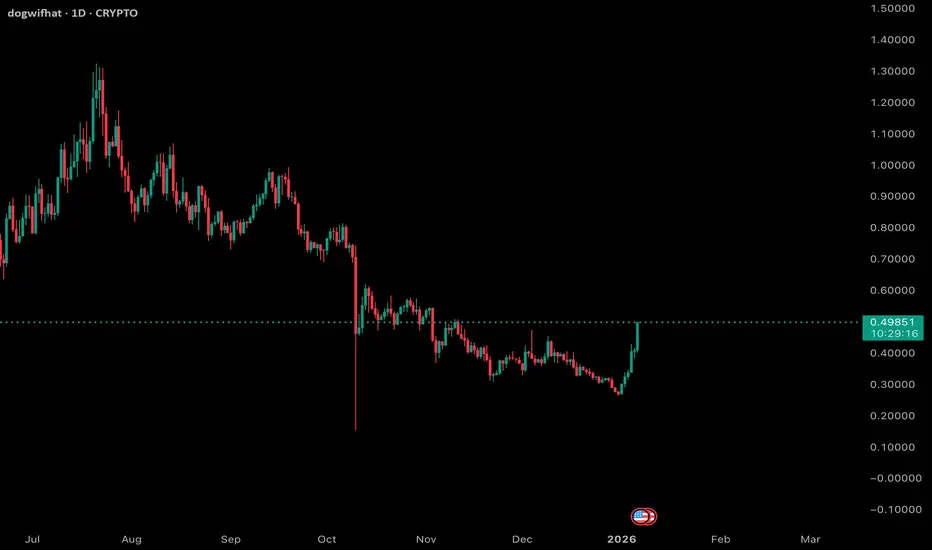
$WIF 1D Update: The pump is starting... SOL memes coming back? WIF is finally starting to show some strength on the daily. After a long period of basing and grinding near the lows, price is now pushing higher with an impulsive move rather than another weak bounce. That’s a meaningful change in character compared to what we’ve seen over the past few months.
This pump is coming after extended compression and seller exhaustion, which is typically where sharper relief moves can originate. The reclaim of the recent range highs suggests buyers are stepping in with more conviction, not just short covering.
That said, this is still early. One green candle doesn’t flip the higher timeframe trend by itself, but it does shift the short-term bias from purely defensive to cautiously constructive. If price can hold above this breakout area and avoid immediately retracing the move, it increases the odds that this is more than just a dead cat bounce.
Overall, WIF is looking better than it has in a while. I’m watching closely to see if this strength can build into follow-through and higher lows rather than fading back into the prior range.
BTC/USDT (Bitcoin) long set upBTC Long set up
Entry Price 1: $90,500
Entry Price 2: $88,500
Stop Loss: $87,000
Take Profit 1: $93,500 (Close 25%)
Take Profit 2: $96,000 (Close 50%)
Take Profit 3: $99,500 (Close 75%)
Take Profit 4: $104,500 (Close 100%)
Status: ACTIVE

ONDO Short-term analysis | Trading and expectationsLSE:ONDO
🎯Price printed a 3 white knight bullish engulfing pattern, jumping above the daily pivot and the descending resistance trend-line. Price must get above $0.5 to negate the bearish divergence that has emerged. Wave 1 of a new uptrend appears to be underway.
📈 Daily RSI tapped oversold with bullish divergence, where it caught a bid.
👉 Analysis is invalidated below the swing low, $0.35
Safe trading

BNB Short-term analysis | Trading and expectationsCRYPTOCAP:BNB
🎯Price has closed above the daily 200EMA and daily pivot, suggesting a new bull trend has taken hold. If this is wave (3), we should expect a strong breakout in the coming days/weeks towards the all-time high. Wave 4 appears complete, with a textbook ABC correction ending at High Volume Node support.
📈 Daily RSI is currently showing bearish divergence across many altcoins, including BNB. A push above wave (1) will negate this divergence.
👉 Analysis is invalidated below wave (2), daily pivot and 200EMA.
Safe trading

AAVE Short-term analysis | Trading and expectationsCRYPTOCAP:AAVE
🎯 Price printed a bullish engulfing candle from daily RSI bullish divergence and High Volume Node support. It is currently testing the pivot. Overcoming this will add confidence to the bullish move, with a first target of the daily 200EMA and High Volume Node resistance at $220. Overcoming the daily 200EMA will add confluence to a major bottom being in.
📈 Wave (C) of triangle wave (D) appears to be underway. Daily RSI sits at the channel EQ and is crossed bullishly.
👉 Analysis is invalidated if we drop below $148, keeping wave (B) alive.
Safe trading

TOTAL3/BTCTOTAL3/BTC is holding very good and continue to breaks the resistance very likely in the coming weeks. All-season may be so close

BNB Macro analysis | The bigger picture | Long-term holdersCRYPTOCAP:BNB
🎯 Price completed a macro wave 3 with bearish divergence on the RSI. Wave 4 is expected to end at the 0.382 Fibonacci $640, and can not extend below the 0.5 Fib, $506. Crypto assets can overextend in wave 5, which I believe we will see in 2026, with a terminal target of the R5 weekly pivot target, $2000, a psychological milestone where heaving selling may begin.
📈 Wave 4 is still underway, testing the previous all-time High Volume Node, 0.236 Fibonacci retracement, $760. Weekly RSI is at the EQ, where a bottom was found the previous two times and the price returned to an all-time high.
👉 Analysis is only invalidated if price falls below the 0.5 Fib, $506.
Safe trading

Ethereum Is Pressing the Ceiling — Breakout or Final Rejection Hello everyone,
On the H1 timeframe, the key focus right now is not chasing upside, but evaluating how Ethereum is behaving at a critical resistance cluster after a well-structured recovery. Price has already done the hard work on the downside; the market is now at a decision point.
After the sharp sell-off into the 2,900–2,920 support zone, ETH formed a clean base and transitioned into a step-by-step recovery, printing higher lows and reclaiming multiple intraday levels. The advance has been orderly and controlled, not impulsive — a sign that buyers are rebuilding positions rather than FOMO buying.
Structurally, price has now pushed into the 3,020–3,035 resistance zone, which has historically capped upside. The current candles are reacting directly at this level, confirming it as active supply, not a level the market can ignore. This is exactly where we expect hesitation, consolidation, or a rejection attempt.
From a price action perspective, two valid scenarios are visible directly on the chart:
- Primary scenario: a shallow pullback toward the 3,000–3,010 area to retest demand, followed by another push higher. Acceptance above 3,035–3,050 would confirm a breakout and open the door toward 3,070–3,100.
- Alternative scenario: failure to hold above reclaimed levels, leading to a deeper pullback toward 2,970–2,990, where buyers would need to step in again to keep the bullish structure intact.
Importantly, there is no distribution pattern yet. Pullbacks remain corrective, candles overlap constructively, and price continues to hold above prior breakout levels. That keeps the bias constructive, but not confirmed.
In short, Ethereum is not late, and it is not guaranteed. It is compressing at resistance, and the next few H1 closes will determine whether this move resolves into acceptance and expansion, or a final rejection and reset.
Wishing you all effective and disciplined trading.

LTC/USDT | Will it continue to go higher? (READ THE CAPTION)As you can see in the 2H chart of LTCUSDT, it got in the FVG zone, but failed to stay there and it is now below the low of the FVG, being traded at 82.10.
I don't expect it to go lower, rather want it to go and retest the FVG zone and maybe even breaking through it.
Should it fail to go higher and drops further, I would want a reaction to the Bullish Breaker.
Targets for Litecoin: 82.80, 83.40, 84 and 84.60.

BTC CME Futures (Weekly) – Pullback Into Structural SupportWe have now closed our short position.
BTC has completed a corrective leg from the recent highs and is now reacting off major weekly trend support.
Key observations:
• Price has pulled back into the ascending weekly trendline that has held since the cycle low
• This zone also aligns with prior range value + horizontal support (~85k–90k)
• Momentum shows correction, not distribution – structure remains intact
Bias:
• As long as BTC holds above the weekly trendline, this looks like a high-timeframe higher-low rather than a trend change
• A sustained hold here opens the door for a continuation leg back toward 110k+, then ATH expansion
Invalidation:
• Weekly close decisively below trend support would shift bias to a deeper retracement toward the low-80s
Plan:
• Patience at HTF support
• Let price confirm before sizing aggressively
Trend intact until proven otherwise.

VTHO Falling Wedge Breakout | Retest Phase Before ContinuationVTHO has been trading inside a well-defined falling wedge structure for an extended period, marked by lower highs and lower lows with contracting price action. This structure reflects weakening selling pressure rather than strong bearish continuation.
Price has now broken out above the falling wedge resistance, confirming a bullish structural shift. After the breakout, the market pulled back and is currently retesting the broken wedge trendline as support, which is a healthy and common post-breakout behavior.
As long as price holds above the reclaimed wedge support, the structure favors continuation toward higher resistance zones. A clean hold here strengthens the probability of a move toward the next supply levels, while a failure to hold may lead to a deeper pullback into prior demand.

[XAUUSD] Bearish Bias · Techincals → ICT ConceptsFundamental Point of View:
Yesterday a new news came out of about US and Venezuela escalation.
We can look a All rime High Break soon with the current esclation.
Technical Point of view
We have a strong Resistance of 4400 If it stays strong we can see a little bearish pressure of 100 points.
Better sells are after break and retest of sell side liquidity till the 4H POI.
setup fails if we break resistance and break a new higher high in a small Time Frame like 1H or 15m.
**Key notes to keep in mind:**
1. Gold might just go straight bullilsh with the weekend blast in Venezuela.
2. It can only be bearish as the country cant defend and USA might just take over.
3. There are the greedy market makers sitting to buy more gold with small reasons of war
**Current Market Overview:**Technically we have a sell side liquidity to take out and retest the **4H POI**. we also have a strong resistance at 4400 which if is broken we will stop looking for buys. we also have trapped early buyers with SL under Sell side liquidity.'
Fundamentally we are bearish with on going interest rates and unemployment rates but with the recent news of Venezuela changes the temporary interest.
lets take a look at different Time frames
**1H TF:**
! (pub-af2db00230534f4fbfd125b3270d1627.r2.dev)
we have a Buyers trapped at ATH then now at the Resistance. we can have a breaish break downside ti
ll 4H POI within This week.
**15M TF:**
! (pub-af2db00230534f4fbfd125b3270d1627.r2.dev)
we have a small order block zone where if we a see a rejection and a lower low break we should place sell with sl in last candle high
**5M TF:**
! (pub-af2db00230534f4fbfd125b3270d1627.r2.dev)
well we have a 5% chance on this to work as we are going to see a high volatilty on market open days arent like old anymore.
**Overall Scenario:**
we are looking for sells only if we are respecting the 4H resistance at 4400 and breaking any Lower Low is another opportunity to trades.
**How will setup fail?**
simple if 4400 level is broken and a new higher high is created on the lower time frame the setup gets invalid

BTC 1W Update: Looking good here, but don't lose the bigger picBitcoin is clearly pumping on the weekly, and that’s constructive to see after the recent pullback. Momentum has picked up, and the bounce off the lows shows that buyers are still very much present in this market.
That said, it’s important not to get distracted by the green candles alone. Price is currently sitting near the middle of the larger higher-timeframe range, around the dotted line area. This is not a breakout zone, it’s the heart of the range where chop and back-and-forth price action are most common.
Structurally, Bitcoin is still consolidating between major resistance near the 108k area and major support down around 73k. Until price can decisively reclaim the upper range and build acceptance above it, this remains a choppy environment rather than a clean trend.
This is exactly why buying dips has worked well, while chasing strength in the middle of the range tends to be lower quality. Pumps inside ranges feel exciting, but they often fade back into value just as quickly.
So while the current move higher is a positive sign, the broader context hasn’t changed yet. We’re still in chop land, and patience plus disciplined dip buying continues to be the higher probability approach until the range resolves.

XAUUSD Short: Rejection from Supply – 4,340 Demand as TargetHello traders! Here’s a clear technical breakdown of XAUUSD (1H) based on the current chart structure. After an extended bullish phase, Gold was trading inside a well-defined ascending channel, confirming strong buyer control and a sequence of higher highs and higher lows. During this phase, price respected the channel structure multiple times, using the lower boundary as dynamic support. Before the impulsive move higher, XAUUSD also formed two visible consolidation ranges, indicating accumulation prior to expansion. A clean breakout from the upper range triggered strong upside momentum and accelerated price toward the upper channel boundary.
Currently, XAUUSD is trading near the Demand Zone around 4,340, which aligns with a rising trend line and a previous reaction area. A recent dip below this level resulted in a fake breakout, followed by a quick recovery back above demand, suggesting buyers are still active in this zone. Price is now reacting upward from demand, but remains capped below the 4,400 supply area, keeping the structure corrective rather than fully bullish.
My scenario: as long as XAUUSD remains below the 4,400 Supply Zone, the bias favors sellers. I expect price to show rejection signals in this area—such as long upper wicks, bearish engulfing candles, or failed breakouts—followed by renewed downside pressure. The first downside target is a move back toward the 4,340 Demand Zone. A clean breakdown and acceptance below this level would confirm bearish continuation and open the door for a deeper move toward lower support levels. Manage your risk!

“BITCOIN AT DECISION ZONE – SMART MONEY READY TO STRIKE”Bitcoin is currently trading at a major resistance zone, where smart money activity is clearly visible. The market has already delivered a clear Break of Structure (BOS), confirming bullish strength, but price is now entering an area where liquidity manipulation and sharp reactions are highly probable.
A rejection from this zone could trigger a move toward the previous low, sweeping liquidity before a potential reversal from the strong support zone. On the other hand, a clean breakout and hold above resistance would signal continuation and fresh bullish expansion.
This is a high-stakes area where retail traders get trapped and professionals wait for confirmation.
Patience, structure, and confirmation define the power trade.

EURUSD Holding Buyer Zone - Rebound Toward 1.1780 in FocusHello traders! Here’s my technical outlook on EURUSD (2H) based on the current chart structure. EURUSD is trading within a broader bullish structure after a strong upside move from the lower levels. Earlier, price advanced inside an ascending channel, confirming sustained buyer control and a sequence of higher highs and higher lows. Following this impulsive rally, EURUSD broke above a key structure level and transitioned into a consolidation phase near the highs. Currently, price is reacting around the Buyer Zone near 1.1740, which aligns with a key Support Level and a previous breakout area. This zone has already shown multiple reactions, indicating active demand. Above, the market remains capped by a descending Resistance Line and the Seller Zone around 1.1780, where selling pressure previously caused a rejection. The recent move into support appears corrective rather than impulsive, suggesting a pause within the broader bullish trend. My scenario: as long as EURUSD holds above the 1.1740 Buyer Zone, the bullish structure remains intact. A strong reaction from this area could lead to another push toward the 1.1780 Resistance Level (TP1). A confirmed breakout and acceptance above resistance would open the door for further upside continuation. However, a decisive breakdown below the buyer zone would weaken the bullish setup and signal a deeper corrective move toward lower support levels. For now, price remains at a key decision area, with buyers defending structure while consolidation continues. Please share this idea with your friends and click Boost 🚀
