Will #XRP Finally Recover or Is This Just Another Trap? Yello Paradisers! Are you keeping your eyes on #XRP? While most traders are zoning out, the next move might catch the crowd sleeping. Let's view #Ripple trading setup:
💎Over the past few weeks, #XRPUSDT has been trading inside a textbook falling wedge pattern on the 4H chart. Just recently, we saw a liquidity sweep below the descending support trendline, an early signal that smart money could be accumulating before a breakout move.
💎The price is currently hovering just above a strong demand zone around $1.73, with a clear descending resistance capping price action. A clean breakout above that resistance, especially if followed by a successful retest and the 50EMA flipping into support, would significantly boost the probability of a bullish move.
💎If this scenario plays out, the first minor resistance for #XRPUSD stands near $1.95, which could act as an initial profit-taking zone. Beyond that, momentum could accelerate toward $2.1951, marked as moderate resistance. But the ultimate upside target is at $2.4175, a strong resistance level with a high volume node, where aggressive sellers are likely to show up.
💎However, caution is key here. If #XRP fails to hold above the current support zone and closes below $1.7366, the bullish setup would be invalidated. That would likely trigger more downside toward $1.70 and possibly lower, especially as weak hands start exiting the market.
Trade smart, Paradisers. This setup will reward only the disciplined.
MyCryptoParadise
iFeel the success🌴
Cryptoanalysis

Solana's Price Action reflects some Short-Term AmbiguityPrice now appears to be operating within the b-wave portion of the corrective pattern. While I acknowledge we could see marginally lower prices from here, my base case remains that price recovers and continues to subdivide as depicted in my chart in the black pathway. What remains less clear is whether we are still subdividing to new local lows under the purple alternate, or if the retracement instead continues in a more standard fashion into my target box.
The uncertainty stems from the fact that SOL’s price never decisively traded above the $147–$148 region we have been monitoring for some time. That failure keeps the purple count viable.
However, what lends slightly more confidence to my black primary count over the purple alternate, specifically with respect to Solana, is Bitcoin. BTC has managed to trade above a level that can reasonably be interpreted as the wave iv of a lesser degree. If that interpretation proves correct, it becomes increasingly difficult to envision Bitcoin continuing its corrective advance without exerting upward influence on Solana as well.
As always, time and structure will resolve this short-term ambiguity.

Bitcoin’s Structure Is Speaking — Are You Listening?Hello Traders,
If you zoom out and look at Bitcoin calmly, one thing becomes very clear, price is not breaking down, it is building structure. The current movement may look slow on the surface, but underneath, the market is still behaving in a controlled and bullish manner.
Big Picture:– Structure Matters More Than Noise
Bitcoin is currently trading inside a Rising Structure / Bullish Range.
This structure is defined by higher lows and a gradually rising price channel, which tells us that buyers are still in control despite short-term pullbacks.
The upper trendline is acting as dynamic resistance, where temporary profit booking appears.
The lower trendline continues to act as strong support, showing consistent demand on dips.
As long as this structure remains intact, the broader bias stays bullish.
High-Probability Accumulation Zone
This 90.2k – 89.5k zone marked on the chart is not random.
This area was previous resistance , which has now flipped into support.
Price is consolidating above this zone , not breaking below it, a strong sign of acceptance.
Sellers are failing to push price lower , indicating absorption of supply.
This is why this region qualifies as a high-probability accumulation zone, not a chasing zone.
Upside Targets – If Structure Holds
If Bitcoin continues to respect the demand zone and the rising structure, these levels come into play naturally:
Target 1 → 91,825
Target 2 → 93,790
Target 3 → 96,027
These are not predictions :— they are logical reaction levels based on structure and range expansion.
Risk Side:– Structure Invalidation
Every bullish structure has a clear line in the sand.
A clean breakdown below 87,600 would invalidate the current bullish structure.
If that happens, the market would need time to rebuild acceptance before any sustainable upside continuation.
Strong trends don’t start from excitement :—they usually start from patience.
Conclusion :- At the moment, Bitcoin is:
Holding above key demand
Respecting its rising structure
Consolidating instead of breaking down
The next major move will depend not on speed, but on how price reacts around this zone.
If this analysis helped you see the chart more clearly, share your view in the comments,
I’m always open to discussing structure with serious traders.
Analysis By @TraderRahulPal | More analysis & educational content on my profile.

Is #ETC About to Collapse or Explode? One Side Will Get Wrecked Yello Paradisers! Are you watching #ETC closely enough? While the crowd has been ignoring it due to the boring chop, a textbook falling wedge just completed, and the market might be about to catch them completely off guard.
💎For several weeks, #ETCUSDT has been trading within a clear falling wedge pattern. The price has now reached a critical point, hovering just above a strong demand zone between $12.00 and $12.50, where previous accumulation took place.
💎At the same time, MACD is flashing a strong bullish divergence, while price action continued making lower lows, momentum has been climbing quietly behind the scenes. Just recently, we saw a bullish crossover on MACD, reinforcing that momentum is shifting. This is exactly the type of setup we love: structure + demand + momentum convergence.
💎If this wedge breaks to the upside with conviction, we’ll be targeting $14.00 as minor resistance for #EthereumClassic. It will be followed by a potential move toward the $16.06 zone, which marks moderate resistance. Should the bulls sustain pressure above that, the next big magnet will be the strong resistance at $21.56, where sellers are likely to show up in force.
💎However, if #ETCUSD breaks below the support zone at $12.00, and especially if it closes under $9.17, the bullish thesis will be invalidated. That would open the door for a deeper move, as demand dries up and panic sellers take control.
Trade smart, Paradisers. This setup will reward only the disciplined.
MyCryptoParadise
iFeel the success🌴

#VET Ready for a Major Bullish Move | Key Levels to Watch Yello, Paradiser! Is #VeChain about to trap all the late bears, or are we about to witness one more brutal shakeout? Let's view the #VETUSDT trading setup:
💎#VET is currently trading around $0.0116 on the 1D timeframe, and just completed a breakout from a textbook Falling Wedge, one of the most reliable bullish reversal patterns when combined with confirmation signals.
💎The breakout has already occurred, and most importantly, it is now retesting the descending resistance to validate this breakout. This is often a critical validation of strength and suggests the move is likely not a fakeout. In addition, we’ve already seen a bullish crossover on the momentum oscillator, which adds further confirmation to this bullish setup.
💎The Strong Demand Zone between $0.0094 and $0.010 is now acting as the base of this bullish structure. Holding above this level is essential. If bulls continue to defend this zone, we anticipate a potential push toward the first major resistance at $0.0138, followed by the strong resistance area between $0.019 and $0.020, where sellers are likely to step in more aggressively.
💎Below the structure, we’ve clearly marked Key Support at $0.0078 for #VETUSD. If price closes below this zone, it would invalidate the bullish scenario and open the door for further downside, potentially into illiquid areas where volatility could spike.
Be patient, wait for structure to confirm, and stick to your plan. That’s what keeps you consistent while others chase.
MyCryptoParadise
iFeel the success🌴

ZKP/USDT – This Accumulation Could Be the Next Big BouncePrice has been bleeding inside a clear downtrend, but the momentum is now slowing down. We are seeing strong accumulation at the base, right after price tapped the demand zone and reacted sharply.
The descending trendline is being pressured, and any sustained hold above this area increases the probability of a trend reversal rally. This is the type of zone where smart money typically builds positions before expansion.
If price continues to respect the accumulation base, the path toward higher liquidity becomes very clear.
Entry Zone: Current price area
Stop Loss: 0.1272
Target 1: 0.15427
Target 2: 0.17220
As long as the base holds, the bullish scenario remains valid.
Failure to hold the base invalidates the setup.

Is #IOTA Ready For a Major Bullish Wave or Will it Fall Further?Yello, Paradiser! Are you ready for what could be a brutal shakeout for bears or a golden entry for bulls on #IOTAUSDT? This falling wedge might not stay quiet for long. Let’s break down the #IOTA Setup:
💎#IOTAUSD is currently trading around $0.084 on the 4H timeframe and has just broken out of a textbook falling wedge pattern. This pattern typically signals a bullish reversal, but only when confirmed by proper retest and strength.
💎We’ve already seen a breakout followed by a retest of the descending resistance, which is a key early sign that momentum might be shifting. Adding to that, the 50 EMA is now attempting to turn into support, and if it holds, it significantly increases the probability of a strong bullish follow-through.
💎The demand zone between $0.080 and $0.084 is now acting as the make-or-break level for bulls. Holding above this zone keeps the bullish setup alive. If price continues to build structure above this area, we could see acceleration toward the first major resistance at $0.100, followed by a strong resistance near $0.120, where we expect sellers to become more aggressive.
💎However, as always, risk management comes first. The bullish thesis is invalidated if price breaks below the key support at $0.0717, where the structure would be compromised, and a bearish continuation toward lower liquidity zones could begin.
Trade smart, Paradisers. This setup will reward only the disciplined.
MyCryptoParadise
iFeel the success🌴

ETHUSD Poised for Upside After Support HoldETHUSD is respecting a key support zone after a healthy pullback from recent highs. Price remains above the golden zone, suggesting bullish structure is still intact. A bounce from current levels could open the path toward the first target near prior highs, with buy-side liquidity resting above and a potential continuation toward the second target. Overall, the chart highlights a clean structure with clear support, targets, and momentum alignment.

MYX Analysis (1D)From the point where we placed the red arrow on the chart, the MYX correction has begun.
The corrective phase is either an ABC pattern or a more complex structure. We are currently in Wave B of this phase. Wave B itself is an ABC, where Wave B of B formed a triangle that has now completed, and the price is currently in Wave C of B.
If the price reaches the red zone, we will look for sell/short positions.
The targets are marked on the chart.
A daily candle closing above the invalidation level will invalidate this analysis.
For risk management, please don't forget stop loss and capital management
When we reach the first target, save some profit and then change the stop to entry
Comment if you have any questions
Thank You

FHE/USDT ABOUT TO EXPLODE? This Setup Looks TOO CLEAN!After a long downtrend, FHE finally shows a strong reaction from a key support zone — and this is where things get interesting 👀
Smart money doesn’t buy highs… they position where risk is tight and structure starts to shift.
Price is now holding above support with a clear impulsive move, signaling potential trend reversal or continuation play 📈
As long as this base holds, upside expansion remains very attractive with a clean invalidation below.
This is the type of setup traders wait days — sometimes weeks — to catch.
Low risk, high reward, and very clear levels on the chart 🎯
I’ve mapped everything directly on the chart.
Now the only question is… will price respect the level or trap late sellers? 🤔
Not financial advice. Always manage your risk.
Drop your bias below — bullish or fake move?
If you like clean, no-nonsense price action & smart money setups, don’t forget to BOOST 🚀, LIKE 👍, and FOLLOW for more high-probability crypto ideas.
Let’s hunt the next big move together 💰🔥
#FHE #FHEUSDT #Perpetual #CryptoTrading #Altcoins #PriceAction

Can #SNX Recover From Here or Will it Continue to Fall?Yello, Paradiser! Are you prepared for the moment when #SNXUSDT finally decides whether it will punish late bears or wipe out impatient longs? Let's look at the #Synthetix trade setup:
💎#SNX is currently trading around $0.418 on the 4H timeframe and remains stuck inside a clearly defined descending channel, respecting both the descending resistance and descending support with high precision. This type of structure tells us one thing very clearly: the market is compressing, and a decisive move is getting closer.
💎Price is now sitting just above a key demand zone around $0.38–$0.39, where buyers have already shown interest multiple times. This zone is crucial. As long as #SNXUSD holds above it, bulls still have a chance to regain control. The chart also highlights that a clean breakout above the descending resistance, combined with a reclaim of the 50 EMA as support, would significantly increase the probability of a bullish continuation.
💎If that bullish scenario plays out, the first upside target sits at the moderate resistance near $0.51, followed by a much more important strong resistance around $0.60–$0.61. A move toward those levels would likely happen fast, as many traders are currently positioned defensively and would be forced to react to a breakout.
💎However, this setup comes with a very clear invalidation. If price loses the $0.38 support zone decisively, the bullish idea is off the table. A breakdown below this level would confirm weakness and open the door for a deeper move toward the $0.33 support zone, where the next significant liquidity sits. That scenario would likely come with increased volatility and emotional selling from inexperienced traders.
Trade smart, Paradisers. This setup will reward only the disciplined.
MyCryptoParadise
iFeel the success🌴

PUMP/USDT: Memecoin at Critical Resistance – Doji Pattern Signal🚀 PUMP-USDT is back in the spotlight — and it’s hitting something big:
✅ 5-MONTH RESISTANCE (since Sept 2025)
✅ DOJI Pattern forming at key resistance level — a true battleground of sentiment
✅ The overall trend is falling since beginning
📊 What’s a DOJI?
A Doji is that neutral, indecisive moment on the chart where bulls and bears are locked in a stalemate.
- No clear momentum.
- Sentiment is split — bullish hopes vs bearish caution.
- The market is “thinking”… waiting for a trigger.
💥 This is EXACTLY what we see now:
A Memecoin with wild energy
Trapped at its strongest resistance since launch
And now, a Doji / Spinning Top forming right at the top
⚠️ That’s not a signal to go long. That’s a warning sign.
When a memecoin hits multi-month resistance and forms a DOJI?
→ Bull retracement is exhausted.
→ Bear pressure is building.
🎯 Our call: SHORT PUMP-USDT
Wait for confirmation — a rejection candle or volume spike down — then enter.
This isn’t FOMO. It’s smart timing.
💬 What’s your take?
Are you riding the wave… or preparing for the drop?
👇 Drop your view below — let’s see who’s thinking ahead!

ATOM / USDT – Weekly OutlookATOM is still trading in a long-term downtrend, but price is currently resting on a major historical support zone.
Market Structure
Clear sequence of lower highs, confirming bearish structure
Strong support zone that has been defended multiple times in the past
No confirmed trend shift yet
Key Zones
Support: current range where price is consolidating
Resistance: previous support that must be reclaimed and held
Above resistance, upside momentum can accelerate
Scenario
As long as support holds, a relief bounce is possible
Rejection at resistance would confirm trend continuation
Only a clean reclaim and hold above resistance would signal trend reversal
Do you expect ATOM to bounce from support or continue lower?
MrC

BCH/USDT – Higher Timeframe Long ContinuationPrice has reclaimed a key HTF level and is holding above the previous resistance, now acting as support. Structure remains bullish, with price positioned for continuation toward higher liquidity levels.
Entry: 638.2
Stop Loss: 571.9
TP1: 705.9
Final TP: 802.2
Bias remains bullish as long as price holds above the support zone.
#BCH #BCHUSDT

RENDER / USDT – Trade ideaPrice is still trading inside a range after a strong sell-off.
Market shows indecision, but structure is holding for now.
This trade is already active, based on confluence with the Total Market Cap analysis.
Market conditions align with a potential relief move, as long as structure holds.
Technical View
* Price is reacting around a key support zone
* Multiple rejections from range lows
* Break above range highs could confirm continuation
* Loss of support would invalidate the setup
Do you expect continuation from this range or a breakdown first?
MrC

SOLUSDT 4hr – Trade idea Price is currently trading inside a range after a strong impulsive move down.
We are seeing multiple fair value gaps below and above, indicating unfinished business on both sides.
Context
Overall structure remains bearish
Price is consolidating near local support
Liquidity has been swept to the downside
Bullish idea
If price holds this support and reclaims the local fair value gap, a move towards the higher timeframe imbalance becomes likely.
Bearish idea
Failure to hold this area could lead to a continuation into the lower fair value gap, completing the downside move.
Are you expecting a range expansion up or further downside first?
MrC

RIVERUSDT – Potential Short Reversal SetupRIVER experienced a strong impulsive move followed by a pullback into a key reaction zone. Price is currently stabilizing after the retracement, opening the possibility for a short-term recovery if buyers can hold this area.
RIVER/USDT (SHORT)
Leverage: CROSS 15x
Limit Entry: 15.08
Target: 13.9 - 12
Stop: 16.225
If price can maintain acceptance above the current level, a short-term bounce toward the upper zone remains valid. Failure to hold the level would invalidate the setup.

BTC: The 15-Year Prophecy (Hosoda Time & The Diagonal)There is a ghost in the machine.
For the last few months, amidst the noise of breakouts and new highs, a specific signal has been flashing a warning that defies the rules of a standard Bull Market. It is a "glitch" in the data—a silence where there should be noise.
Most are ignoring it. Some are confused by it. Today, we are going to try solving it.
Below is the full evolution of the Bitcoin setup, from the Daily traps to the Macro truth, revealing why the "Silence" is actually the loudest signal we have ever seen.
Part 1: The Micro Trap (1D Chart)
Zooming into the daily timeframe, the structure of the decline is textbook. We are currently navigating Wave (4), but the context provided by the previous move is critical.
The "Extended" Wave 3: The drop we just witnessed wasn't a standard correction; it was an impulsive sell-off where Wave 3 was extended. when the third wave extends, it confirming strong momentum in the direction of the trend. The bears are in control.
Current Status (Wave 4): We seem to be in the middle of a Wave (4) relief rally, potentially unfolding as an ABC correction.
Sub-waves 'a' and 'b' appear complete, with 'b' potentially establishing a local higher low.
What's Next: We are likely waiting for Wave 'c' to expand upwards to potentially complete the structure.
The Potential Resistance ($99k): If this structure holds, Wave 'c' might push towards the resistance confluence around $99,323. This area could serve as a ceiling for this corrective phase.
The Downside Risk ($79k): Traders should remain cautious. If Wave (4) finds resistance near $99k, the Elliott Wave guidelines suggest a Wave (5) decline could follow. If that scenario plays out, the market might target the major support zone near $79,000.
Part 2: The Time Anomaly (1W Chart)
While the daily chart showed us the immediate price action, the Weekly chart reveals the true scale of the move. As discussed in previous updates, we are navigating a large-scale Irregular Flat Correction, and we are currently at the tail end of Wave (1) of the 5-wave impulse that makes up the larger C-Wave.
So, the entire impulsive structure we just analyzed on the Daily chart? That was just the first leg of this Weekly move.
☁️ The Ichimoku Signal: Testing "Senkou Span B" Price action has now entered the Ichimoku Cloud (Kumo), a critical zone of turbulence.
The Level: you can see candles trading inside the cloud. We have already tested the bottom support, specifically the Leading Span B (Senkou Span B).
The Forecast: Hitting this level signals that Wave (1) is either ending or has already ended. However, the market rarely makes it easy. I am expecting a potential "False Breakout" below the Cloud to trigger panic, followed by a sharp reclamation. That fake-out would likely mark the bottom of Wave (1) and start of Wave (2).
⏳ The Time Anomaly: Why so fast? There is a strange disconnect in the "Time" dimension of this cycle compared to history (see picture).
2021 Cycle: In the previous bull run, the correction for Wave 1 typically took 70 days to cool the RSI down to 37.
Current Cycle: We have smashed down to an RSI of 35.8 in just 42 days.
The Question: Why is the market correcting nearly twice as fast as before? This "Time Compression" indicates the cycle is moving faster and more violently than we are used to.
The "BBWP Mystery" Finally, look at the BBWP (Volatility) in the below picture. This presents a genuine anomaly. Throughout this cycle, we have seen contractions many times, yet the spectrum never reached the extreme 90% expansion levels. Now, at the very end of the cycle, we are seeing another massive BBWP Contractions.
Why is this happening? Is it just noise, or is this contraction actually telling us the truth?
Part 4: The Truth (6-Month Macro Chart)
Why is the market moving so fast? And what is the "BBWP Signal" we mentioned Before? Look at the 6-Month Logarithmic Chart below.
The Big Picture: Elliott Wave Supercycle on 6M Log Scale
On the logarithmic chart, Bitcoin appears to be wrapping up a massive impulse wave that started from its early days:
Wave (I): Peaked around 2013 (~$1,200 high).
Wave (II): Bottomed in 2015 (~$200 low).
Wave (III): Explosive rally to the 2021 all-time high (~$69,000).
Wave (IV): The 2022 bear market low (~$15,500).
Wave (V): Ongoing since late 2022, but here's the twist—it's unfolding as an ending diagonal (wedge pattern with overlapping subwaves: 1-2-3-4-5).
2.Applying Hosoda Time Theory (Ichimoku Time Theory indicate potential future market turning point).
The vertical lines in the chart are not Fibonacci; they are Hosoda Numbers (9, 13, 17, 21...),
9: Marked the 2023 Bull Run start.
13: Exactly Marked the Jan 2025 Top as end of wave 3, which matches the irregular flat analysis on Weekly chart which states that Cycle top was on Jan 2025.
17 (±1): Matches our projection for the next major pivot—the end of wave IV and the start of the final Wave V run on Jul-2026 or Jan-2027.
The "Mystery": The BBWP Anomaly
BBWP is contracting sharply now on weekly chart—at what feels like the end of the cycle, not the start. This flips the script on historical behavior. Why? I tie it back to the higher-degree Elliott count: The ending diagonal's converging nature naturally squeezes volatility, compressing Bollinger Bands as momentum fades. Instead of signaling a fresh bull, this late-cycle contraction could be foreshadowing a reversal—think trend exhaustion rather than accumulation.
A Possible Explanation: If the macro structure is indeed an Ending Diagonal, then this volatility crunch (BBWP contractions) and the market correcting nearly twice as fast as before makes perfect sense. We would be squeezing into the apex of a 15-year wedge. The market might be running out of "oxygen".
The Verdict: With the 6-Month structure potentially squeezing into a corrective Wave IV, the weight of evidence suggests that the path of least resistance is down. Until the market touches the lower boundary of this diagonal (or invalidates the structure), the only logical macro view is bearish.

WOO Buy/Long Setups (4H)The order blocks at the top of the chart have been consumed, and most sellers have lost a large portion of their orders.
Price has completed a strong CH and is currently trading around a key level. There is also a liquidity pool visible above the chart near the Swing High (SW H).
All of these signs indicate that if a pullback occurs, price could move back toward higher levels.
The targets are marked on the chart, but the main target is the red supply zone.
For risk control, a pullback is needed to enter at a more favorable price, since the invalidation level must be placed properly to avoid losses if price drops.
If a pullback occurs, we will enter a buy/long position.
For risk management, please don't forget stop loss and capital management
When we reach the first target, save some profit and then change the stop to entry
Comment if you have any questions
Thank You

JTO Buy/Long Signal (4H)JTO is currently at key levels and we have a bullish CH on the chart. Above the current price the CP move appears as a spike which indicates there is no significant resistance.
On pullbacks to the support zones we can look for buy or long positions.
The targets are marked on the chart. Take partial profit at the first target and move the stop loss to breakeven.
Do not enter the position without capital management and stop setting
Comment if you have any questions
thank you

LINKUSDT – Weekly TimeframePrice is currently reacting at a major support zone that has been respected multiple times in the past.
This area previously acted as both support and resistance, making it a key decision point for the market.
Market structure
Higher timeframe structure is still correcting
Price is testing a previous support area
Momentum has slowed down, showing hesitation
Scenario 1 – Support holds (bullish):
If buyers step in and this support holds, we could see a relief move towards the next resistance zone, where price was previously rejected.
Scenario 2 – Support fails (bearish):
If this support breaks with a strong close, price may continue towards the lower support zone, which acted as a base earlier in the structure.
Conclusion:
Price is at a make-or-break area. Waiting for confirmation is safer than anticipating the move.
Do you expect a bounce from support or a breakdown continuation?
MrC

4 X Crypto TOTAL charts showing direction of positive investmentThese charts use the " RK's 10 ∴ MA Types Ribbons (Fibonacci, Guppy and others) " indicator in TradingView.
It is simply SUPERB and is unparalleled.
So, to business. These are all WEEKLYc harts from early 2021 to current date
Top Left TOTAL chart - Top Right TOTAL2 (Excluding Bitcoin)
Bottom Left TOTAL3 ( Excluding BTC & Eth ) - Bottom right OTHERS ( Top 125 coins minus top 10 by Market Cap )
We also see the Bollenger Bands in these Charts, the orange line being the BASIS line of that indicator, an average of movement.
You will notice the vertical dashed line on the ATH from 2021, there as an anchor to work from...a Data point.
First thing to notice, NO ALT SEASON after that date. Investment reduced Drastically.
And we can see as we move to the right of these charts No ALT Season after each "Peaks" in this cycle.
Infact, if we look at these 3 Peaks this cycle, there is a Notable difference between the TOTAL chart and the OTHERS chart.
It is only in the TOTAL and TOTAL 2 charts ( Top line ) that we see the 3rd peak being higher than the previous peaks. A Close call on the TOTAL 2
From the TOTAL 3 and OTHERS charts, we see that 3rd peak lower than the 2nd.
To remind, TOTAL 3 is all crypto MINUS BTC and ETH -> OR, to put it another way, ALL ALTS
The OTHERS are the Mid to Low Cap ALTS>.....
Both of these Groups of Crypto have seen REDUCED investment than previously..
The TOTAL chart has the greatest level of stability, with shallower Dips between the Peaks than the TOTAL2 etc
To remind, TOTAL 2 is all Crypto minus Bitcoin.
So we can understand that BITCOIN is what brought that stability to the Market.
This can all be seen Faily quickly by looking at the BASIS line of the Bollinger Bands.
The Sad thing is, there are still people waiting for ALT Season.....
As with the DOT COM Bubble, we had the Rush of ALTS previously and now, The Crypto market is shedding so many CRAP coins.......
It is simply how things work, EVERY TIME
Trade Safe and Happy Holidays to you all

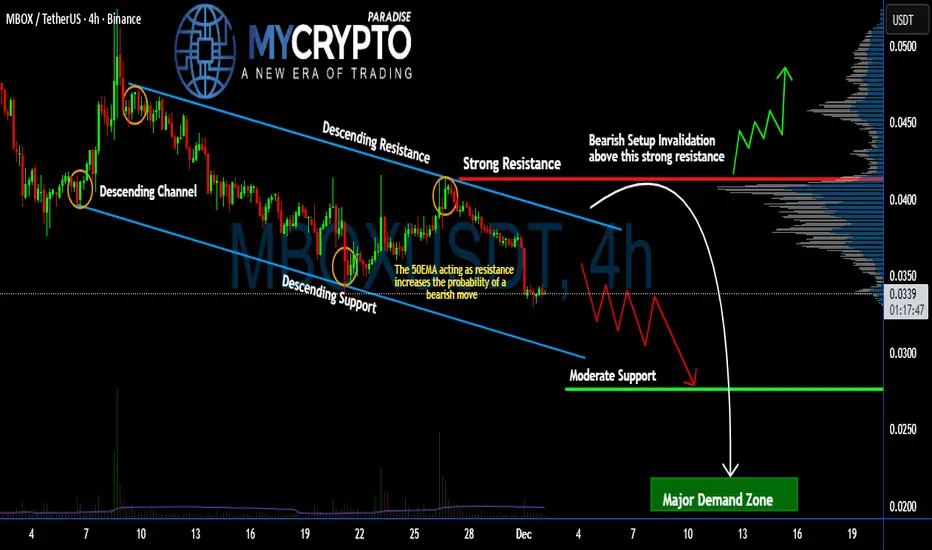
Is #MBOX Ready For Another Leg Down or Not? Bears in ControlYello Paradisers! Is #MBOXUSDT going for another wave of bearish moves, or will it recover from here? Let's break down the #Mobox setup:
💎#MBOX is currently trading within a clean descending channel, showing repeated rejections from the upper resistance line. This bearish structure has held strong, and with the 50 EMA now acting as dynamic resistance, the odds are tilting further in favor of downside continuation.
💎The current price of #MBOXUSD is $0.033, sitting right below both the descending resistance and strong horizontal resistance. As long as price remains under the $0.041 invalidation zone, the bearish setup remains active. A breakdown from here opens the door toward lower support levels.
💎First area to watch is the moderate support zone at $0.027, but the real liquidity and potential buyer interest lie much lower in the major demand zone, just above $0.020. A clean move into this area would likely trap late shorts and offer a powerful reversal opportunity, but only once the selling pressure exhausts.
💎To flip the bias bullish, price must break and hold above $0.041. This level has acted as a clear resistance, and reclaiming it would invalidate the current bearish structure, opening up a strong rally opportunity toward higher value zones.
Trade smart, Paradisers. This setup will reward only the disciplined.
MyCryptoParadise
iFeel the success🌴