LYN Looks Bearish (1H)Please note that this token has been listed recently and is highly volatile, so manage your position size and risk carefully.
It seems that a pattern with at least five waves is forming, with wave D currently coming to an end.
Once the price stabilizes below the red line, it may start moving toward the targets.
The targets are marked on the chart.
For risk management, please don't forget stop loss and capital management
When we reach the first target, save some profit and then change the stop to entry
Comment if you have any questions
Thank You
Cryptoanalysis

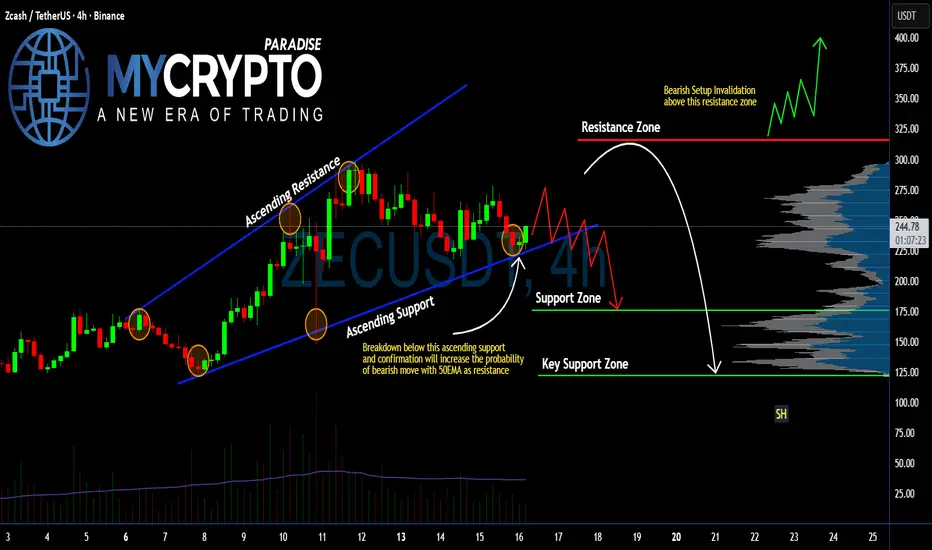
#ZEC Ready to Collapse? Breakdown Here Could Trigger Panic Sell Yello Paradisers! Are you really paying attention to what’s brewing on #ZECUSDT? Because if not, you might be blindsided by what could be a brutal move down. Let's get into the #ZEC setup:
💎#Zcash has been trading inside an Ascending channel, but the momentum is clearly fading. The last bounce off the ascending support was weak, and now we are testing that same ascending support again, but this time, with growing selling pressure.
💎Current price of #ZEC is around $242, and the situation is getting critical. A confirmed breakdown below this ascending support will flip the structure bearish and open up a clean setup toward significantly lower levels. The 50 EMA, which is now acting as dynamic support, will act as resistance. It will only accelerate the downside if this breaks.
💎If this breakdown plays out and is followed by a failed retest of the broken trendline, we could easily see price dump into the Support Zone around $175, and possibly even fall into the Key Support Zone near $121, where stronger buyers may finally step in.
💎On the flip side, the bearish setup is invalidated only if #ZECUSD breaks back above the Resistance Zone at $316. That would shift momentum in favor of the bulls and could spark a sharp rally.
Trade smart, Paradisers. This setup will reward only the disciplined.
MyCryptoParadise
iFeel the success🌴
ETH/USDT – Ethereum’s Downtrend May ContinueAlthough Ethereum saw a slight recovery on October 14th, it remains under significant pressure from US-China trade tensions, negatively impacting the financial markets and Ethereum’s value. The US imposing 100% tariffs on Chinese goods, along with retaliatory measures from China, has raised concerns about global economic stability. These factors have pushed ETH/USDT down to a low of $3,893.
The chart shows that Ethereum is trading within a clear downtrend channel, with $4,130 acting as a strong resistance level. After hitting this resistance, Ethereum may continue to decline towards $3,530 in the coming days if there is no positive shift in the fundamental factors.
With the market still uncertain and US-China trade tensions unresolved, Ethereum is likely to remain under downward pressure in the short term.

Is #HBAR About to Break Down Hard? Don’t Get Trapped by BearsYello Paradisers! Are you prepared for what might be the next major shakeout on #HBARUSDT? Let’s break down the current setup of #Hedera:
💎#HBAR has been moving within a descending channel since mid-July, consistently being rejected by the descending resistance trendline. Each bounce has been weaker than the last, and we're now approaching the lower edge of this structure with selling pressure intensifying.
💎As of now, HBAR is trading around $0.224, and the next few daily candles will be critical. If you're not managing your risk carefully here, the upcoming volatility could eat your capital alive. The 50 EMA is currently acting as a dynamic resistance, pushing the #HBARUSD lower each time it attempts a bounce. As long as the price remains below this level, the bearish pressure will likely continue.
💎A clean breakdown below the descending support of this channel would be a high-probability bearish confirmation. If we get a breakdown + retest rejection, #HBAR could accelerate toward the Moderate Support zone at $0.166. Then eventually, reach the Strong Demand Zone near $0.127, where we expect more serious buy interest to step in.
💎The bearish setup is invalidated on a confirmed breakout above the resistance zone at $0.255–$0.278. Only if price reclaims and holds above this range will we consider shifting back to a bullish bias. Until then, every bounce is likely to be sold into.
Trade smart, Paradisers. This setup will reward only the disciplined.
MyCryptoParadise
iFeel the success🌴

ETH Looks Bearish (12H)It seems that Ethereum has completed a large bearish triangle, with the first move already played out.
A pullback to the supply zone | marked in red | has now occurred.
The price is expected to eventually reach the green zone, accompanied by some fluctuations along the way.
The main target is the green zone.
A daily candle closing above the invalidation level will invalidate this analysis.
For risk management, please don't forget stop loss and capital management
When we reach the first target, save some profit and then change the stop to entry
Comment if you have any questions
Thank You

BTCUSDT – ABC Correction Hey traders 👋
Bitcoin might be setting up for a strong move downwards after completing what appears to be a 5-wave impulse structure on the higher timeframe.
There’s also a clear RSI bearish divergence, suggesting that bullish momentum is fading and a correction could be near.
I’m currently expecting a medium-term ABC corrective phase, though it’s still uncertain whether it will develop as a classic zig-zag or a flat/flag-type correction.
🎯 Trade Plan (Short Setup)
- Entry Zone: 112,000 – 118,000 USDT
- Stop Loss: above 125,000 USDT
- Take Profit 1: 75,000 USDT
- Take Profit 2: 52,000 USDT
- Final Target (Wave C): around 43,000 USDT
⚡ Notes:
If BTC breaks below the previous wave 4 area with strong momentum, that would add more confirmation to the corrective scenario. However, if the market maintains higher lows, we could still see an extended B-wave or even a continuation of the uptrend.
📘 Reminder:
This is not financial advice — always DYOR and manage your risk properly.

PARTI Looks Bearish (12H)It seems that a large-degree contracting bearish triangle has been completed. If we want to consolidate this pattern, we should consider it as wave Ameaning that we expect a **wave B** to form either in terms of time, size, or potentially even larger than wave A.
Any pullback toward the two red lines is an opportunity to open a sell/short position
A weekly candle closing above the invalidation level will invalidate this view.
For risk management, please don't forget stop loss and capital management
When we reach the first target, save some profit and then change the stop to entry
Comment if you have any questions
Thank You

1INCH Analysis (12H)From the point marked START on the chart, a corrective phase seems to have formed on the 1INCH pair.
This phase appears to be a diametric, and we are currently in wave F of this diametric.
Within the red zone, wave F could terminate, after which wave G is expected to begin. Wave G is a bearish wave.
Targets are shown on the chart.
A daily candle close above the invalidation level will negate this analysis.
For risk management, please don't forget stop loss and capital management
When we reach the first target, save some profit and then change the stop to entry
Comment if you have any questions
Thank You

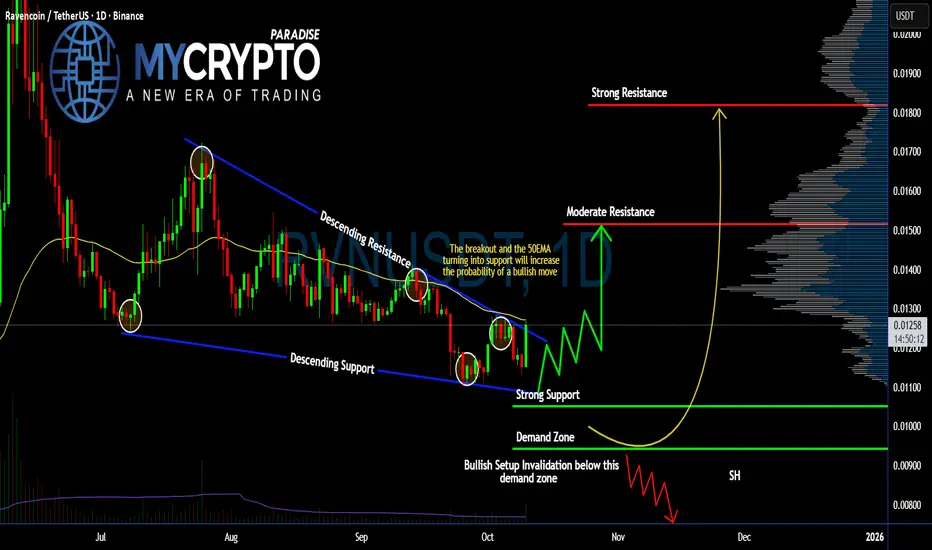
#RVN Ready for an Explosive Bullish Move | Must Watch For BullsYello Paradisers! #RVN just broke out of the descending channel exactly as we expected... but will it hold this time, or is this another fakeout? Let’s break down this #Ravencoin setup:
💎#RVNUSDT has been trading inside a well-respected falling wedge since July. After multiple rejections from the descending resistance, the price is about to break out and close above the structure. This move will also reclaim the 50EMA, which will act as support. If this EMA continues to hold, it will increase the probability of continuation to the upside.
💎The key bullish confirmation here is not just the breakout, but the structure of support forming right above the previously broken resistance line. This creates a possible bullish flip, turning old resistance into new support — one of the cleanest continuation patterns we look for.
💎If the current breakout holds, the next target for #RVNUSD to watch is at 0.015. A clean daily close and hold above that level would open the door for a stronger move toward 0.018, which is the next major resistance zone based on the volume profile.
💎Price is now holding above the strong support at 0.01052, and as long as we remain above the demand zone between 0.01052 and 0.00943, the bullish setup is valid. This area is now our invalidation level. A break below this zone would invalidate the structure and open up further downside.
Strive for consistency, wait for clear confirmations, and remember that discipline always beats chasing quick profits.
MyCryptoParadise
iFeel the success🌴
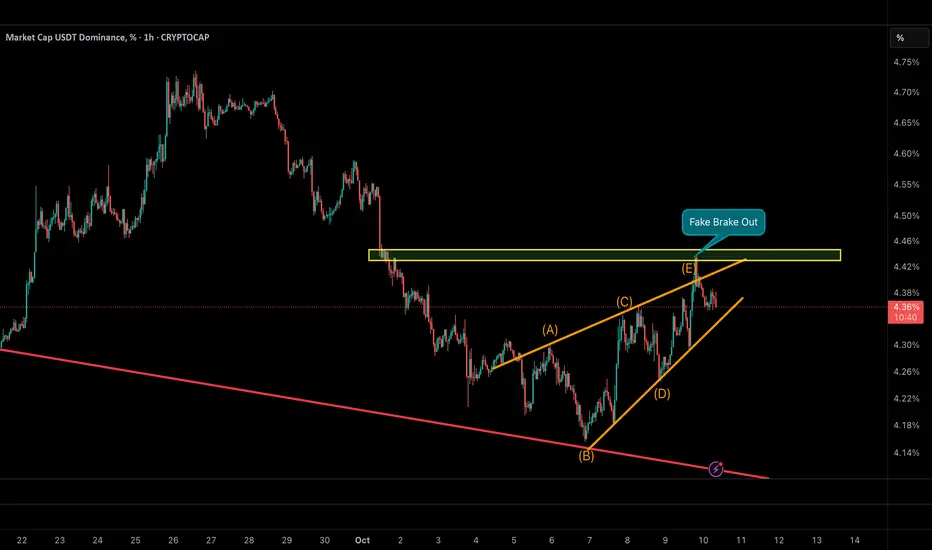
USDT Dominance – Fake Breakout Signals a Potential Altcoin ShiftUSDT Dominance has completed a contracting wedge pattern (A–B–C–D–E), followed by a fake breakout above the key resistance zone near 4.45%.
This move likely trapped late buyers of USDT at liquidity highs.
As long as dominance remains below 4.35%, the probability of a deeper decline toward 4.15–4.20% increases —
which could mark the beginning of capital rotation into altcoins.
In contrast, a confirmed breakout above 4.46% would invalidate this setup and suggest a new sideways phase.
📉 Base Scenario: Continuation of decline toward 4.15–4.20%
🚀 Implication: Growing probability of an upcoming Altseason
Is Altseason About to Begin?The market structure suggests we’re currently in wave C of the second corrective wave (2) — and it looks close to completion.
A potential ending diagonal and bullish divergence on momentum indicators signal exhaustion among sellers.
At the same time, Bitcoin dominance is testing a key resistance zone — a level where liquidity often starts rotating into altcoins.
📈 If the current low holds, we could be witnessing the early stages of wave 3 — the impulsive phase where altcoins usually outperform Bitcoin.
🟢 Base scenario: Correction ending → beginning of a new bullish phase
🔴 Alternative scenario: Breakdown of the current low → completion of a W–X–Y structure

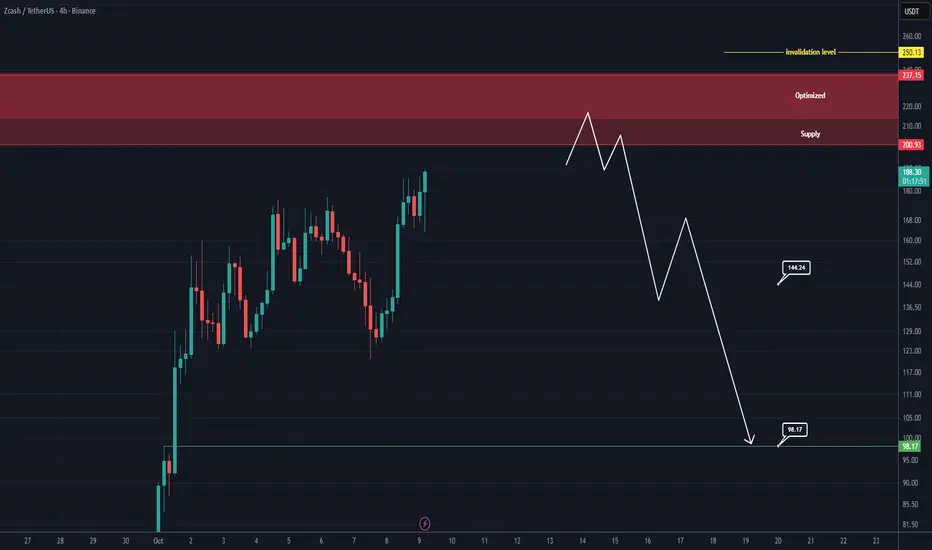
ZEC Analysis (4H)This coin has grown significantly and is now approaching a very strong resistance zone.
The supply zone contains an optimized sub-zone that we’ve labeled as optimized. The closer the candles are to this area, the safer it is to take a sell/short position without a trigger However, if you are risk-averse, wait for the candles to touch this zone, observe the price reaction, and only enter the position after receiving proper confirmation and a trigger signal.
The main targets are marked on the chart.
A daily candle close above the invalidation level will invalidate this analysis.
For risk management, please don't forget stop loss and capital management
When we reach the first target, save some profit and then change the stop to entry
Comment if you have any questions
Thank You
Bera Analysis (12H)From the point where we placed the green arrow on the chart, it seems that a corrective bullish phase has started, which appears to be either a diametric or symmetrical pattern.
Note that we are not looking for a buy/long position on this asset; we will only enter a sell/short position if the price enters our red zone.
In the red zone, it seems that wave F will complete.
The closing of a daily candle above the invalidation level will invalidate this analysis.
For risk management, please don't forget stop loss and capital management
When we reach the first target, save some profit and then change the stop to entry
Comment if you have any questions
Thank You

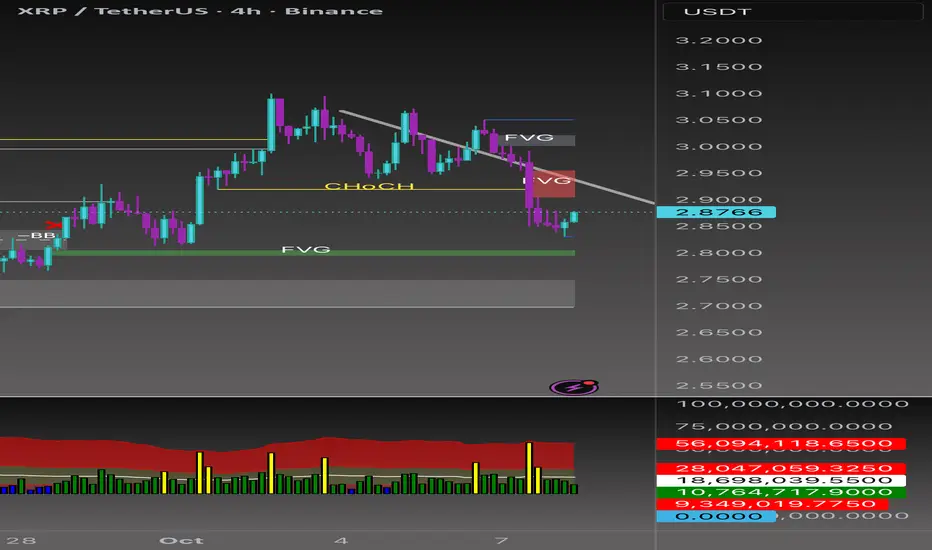
Beyond the Chart - XRP AltCoin Market Analysis 🚀 BINANCE:XRPUSDT XRP/USD AltCoin Market 🚀
XRP stuck between ⚙️ Accumulation ($2.80–$2.85) and 💰 Distribution ($3.00–$3.10) zones.
Descending triangle 🔻 hinting possible breakdown if $2.80 fails — eyes on $2.65 next.
But a clean breakout + hold above $3.05 could flip bias bullish → $3.20–$3.40 🟢
🌐 Macro View:
ETF delays 🏦 + U.S. shutdown ⚠️ keep pressure on alts.
Still, crypto inflows 💸 remain strong — extreme negativity could fuel a contrarian bounce.
🎯 Setups
📈 Long: Breakout + retest above $3.05 → 🎯 $3.20 / $3.40
📉 Short: Breakdown below $2.80 or rejection from $3.05 → 🎯 $2.70 / $2.55
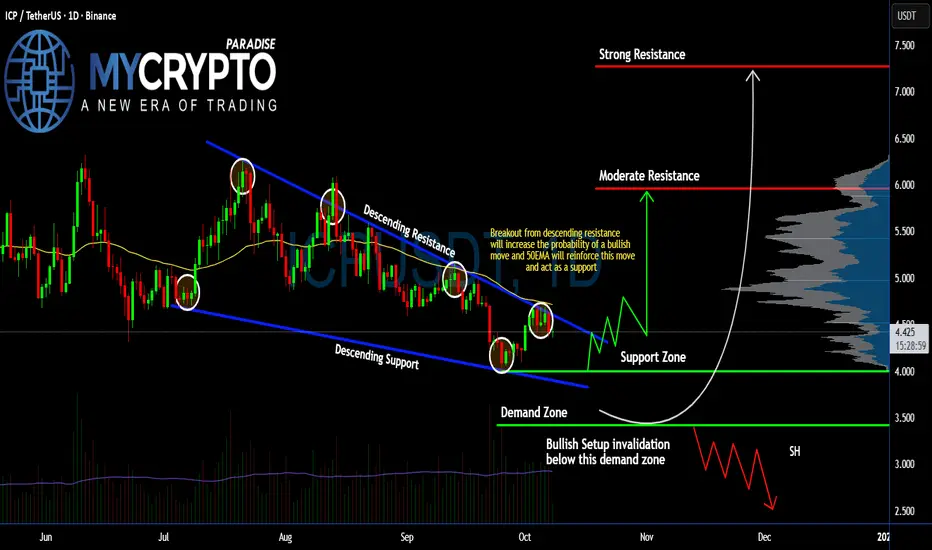
Is #ICP Ready to Make a Bullish Move? Watch it Closely Bulls Yello Paradisers! Will #ICP finally break out of this long-standing downtrend, or is a brutal shakeout brewing just below the surface? Let’s dive deep into #InternetComputer setup:
💎#ICPUSDT has been stuck inside a falling wedge since mid-July, bouncing precisely between descending resistance and support. Currently, the price is coiling right beneath that descending resistance line, and the squeeze is getting tighter. A breakout from this zone would significantly increase the probability of a bullish reversal, especially with the 50EMA right above acting as dynamic resistance-turned-support if the breakout is confirmed.
💎The support zone around $4.0 has already triggered multiple bounces in recent sessions, showing strong buyer interest. If bulls can hold this level and push through the channel resistance, the first key upside target is the moderate resistance at $5.96.
💎A successful break above $5.96 would open the door to the strong resistance at $7.27, where we expect significant selling pressure. For the #ICPUSD, volume confirmation on the breakout will be crucial, and without it, any move may turn into a bull trap.
💎On the flip side, if #ICP fails to hold the $4.00 support and breaks below the demand zone at $3.42, the bullish scenario will be invalidated. That would likely lead to a continuation of the downtrend with a sharp leg lower, potentially printing new short-term lows. This is the final line of defense — if lost, we expect stop-hunts and heavy liquidations to follow.
Strive for consistency, wait for clear confirmations, and remember that discipline always beats chasing quick profits.
MyCryptoParadise
iFeel the success🌴
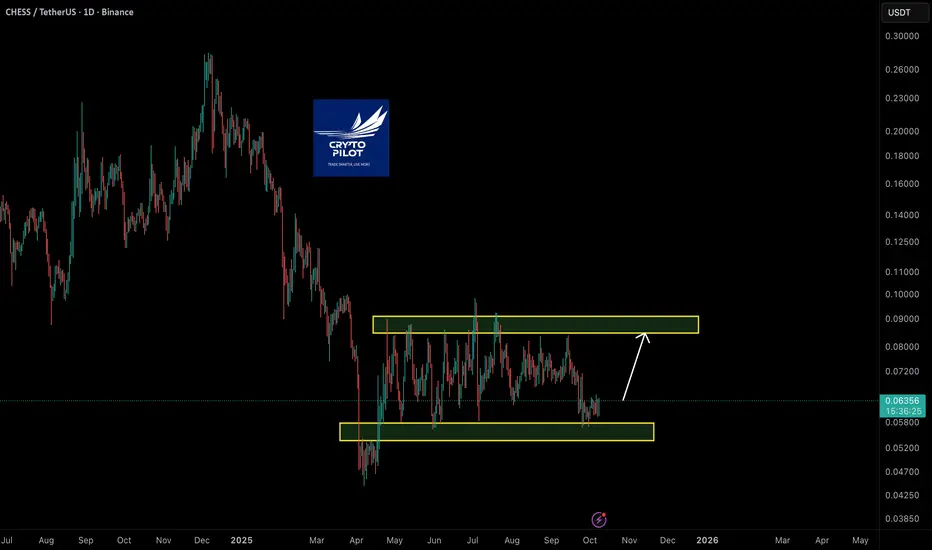
CHESS — Accumulation Range Before a Potential ReversalAfter months of sideways consolidation, CHESS continues to move within a well-defined accumulation range between $0.055 – $0.095.
Price recently tested the lower boundary and has shown a bullish reaction, suggesting that buyers are once again defending this key demand zone.
Key Levels:
• 🟢 Support: $0.055 – $0.060 (accumulation area)
• 🔶 Resistance: $0.085 – $0.095 (range top / potential breakout zone)
If the current bounce holds, CHESS may target the upper boundary of the range — and a confirmed breakout above $0.095 could open the path toward $0.12 and higher.
This structure still favors range trading until a clear breakout occurs, but the risk/reward from the lower zone remains attractive.
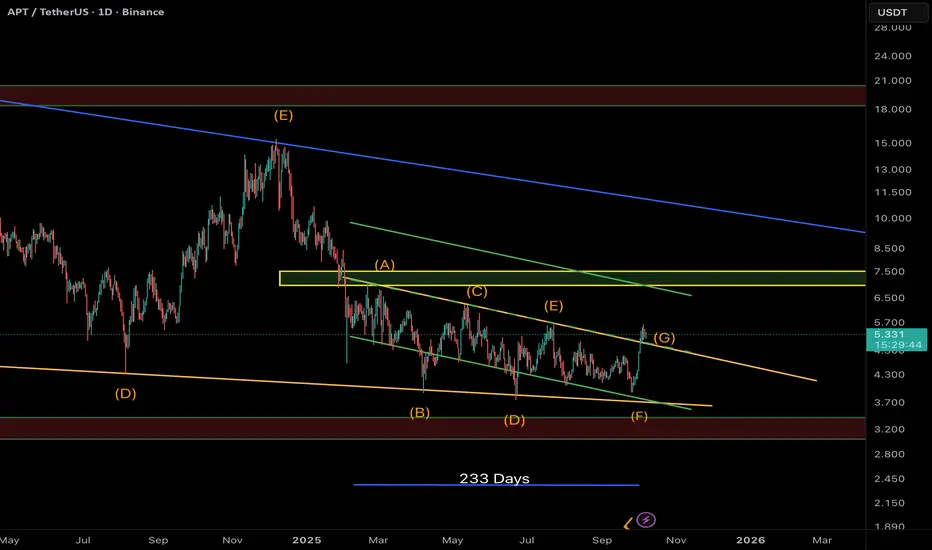
APT — Diametric Pattern Completed? Wave G in Play!APT appears to have completed a 7-leg Diametric correction (A–G) — a rare and complex Elliott structure often seen before major trend reversals.
Currently, price has broken out of the descending channel, confirming the start of Wave G, which could extend toward the $7.0 zone — aligning with the previous Wave A resistance.
Key Points:
• 🌀 Completed Diametric structure (A–G) over ~233 days
• 🟢 Breakout from the descending wedge
• 🎯 Potential target: $6.8 – $7.2
• ⚠️ Support to watch: $4.8 – $5.0 (retest area)
If momentum holds, this move could mark the first bullish leg of a larger reversal phase.
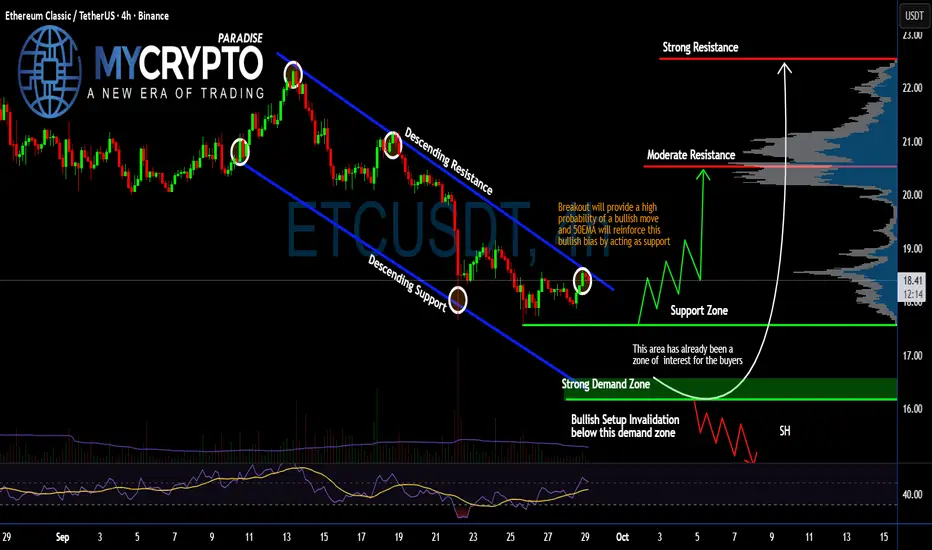
#ETC Bulls Ready For a Pullback or Not? Watch Closely for Trap Yello Paradisers! Are we about to witness #EthereumClassic finally escape this downtrend channel, or another trap lies ahead? Let's break down the #ETC setup before the trap springs:
💎#ETCUSDT has been grinding inside a clear descending channel in the 4-hour timeframe and bouncing consistently between its descending resistance and support. Price is now pushing right against the top of this channel, and this pressure is building. Any clean breakout from here will be a strong bullish signal, especially with the 50EMA lining up perfectly to act as dynamic support if the move confirms.
💎The current support zone around $17.58 has already shown buyer interest recently. A bounce from here and a breakout above the descending resistance would trigger upside momentum, with the first key test being the moderate resistance at $20.54.
💎Once #ETCUSD breaks that, we’re eyeing the final strong resistance around $22.54 — a level where smart money is likely preparing to take profits. You need to watch the volume to confirm the breakout and retest constantly.
💎However, a failure to break out, or worse, a breakdown below the strong demand zone at $16.17, would completely invalidate the bullish scenario. This area is the last line of defense. If it collapses, the next leg down could accelerate fast, triggering a deeper correction and taking out over-leveraged long positions in the process.
Strive for consistency, wait for clear confirmations, and remember that discipline always beats chasing quick profits.
MyCryptoParadise
iFeel the success🌴
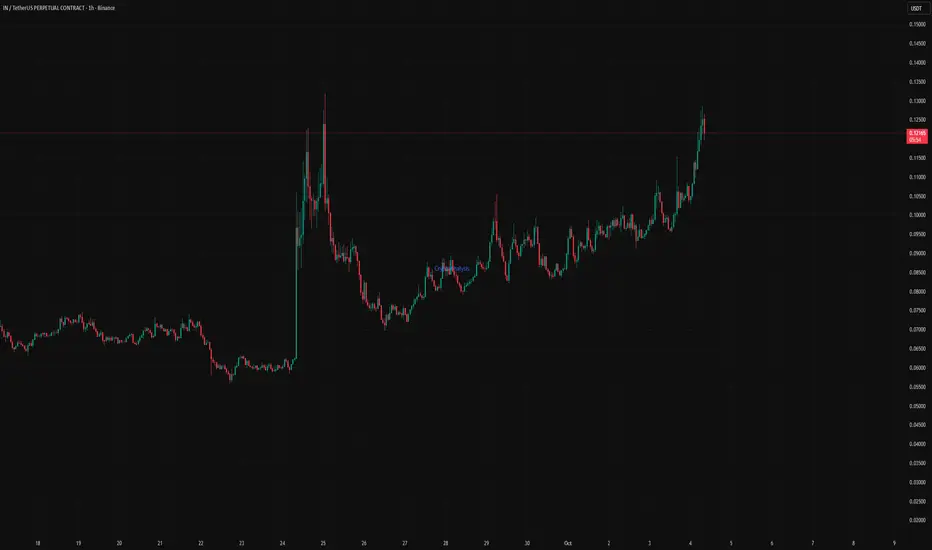
$IN — Agentic DeFi Awakening | Momentum Building for $1
Infinit Labs is gaining strong traction across both technicals and fundamentals — fueled by the rise of Agentic DeFi and upcoming reward distributions.
Key Points:
24H Pump: +75% gain, reaching new all-time highs at $0.1256.
Volume Surge: IN volume up significantly, signaling renewed retail and institutional attention.
Strong Narrative: Backed by Electric Capital, Mirana, and Hashed — Infinit is pioneering AI-powered DeFi Intelligence where agents execute on-chain strategies autonomously.
Catalysts Ahead: Season 2 rewards distribution and a “big announcement” expected within 48h could drive continued upside.
Technical Breakdown
Trend: Bullish continuation confirmed after a breakout from consolidation near $0.09.
EMAs: Price trading well above EMA20 and EMA50 — short-term momentum remains intact.
Volume Profile: Increasing buy-side pressure on dips; consistent higher lows forming.
Targets:
Short-term: $0.18 – $0.22 (Fib extension zone)
Mid-term: $0.35 – $0.50 if momentum and liquidity sustain
Long-term: $1 psychological target, aligning with growing adoption and token utility
Support Levels:
$0.10 (retest zone / former resistance)
$0.085 (EMA50 confluence)
$0.065 (bullish invalidation zone)
Fundamental Context
Utility: Staking IN earns protocol fees, unlocks premium AI-agent features, and grants governance rights.
Ecosystem Growth: “Attention-based tokenomics” will reward users and creators based on real DeFi agent usage — aligning token value with utility and engagement.
Tokenomics: 1B max supply, 49.5% reserved for community and ecosystem incentives over 4 years — fostering long-term sustainability.
Conclusion
IN is transitioning from a stealth narrative to a mainstream Agentic DeFi play. With strong technical momentum, on-chain utility, and a rapidly growing community, the setup remains favorable for continuation toward $0.2+ in the short term and potentially $1 in the coming months if catalysts deliver.
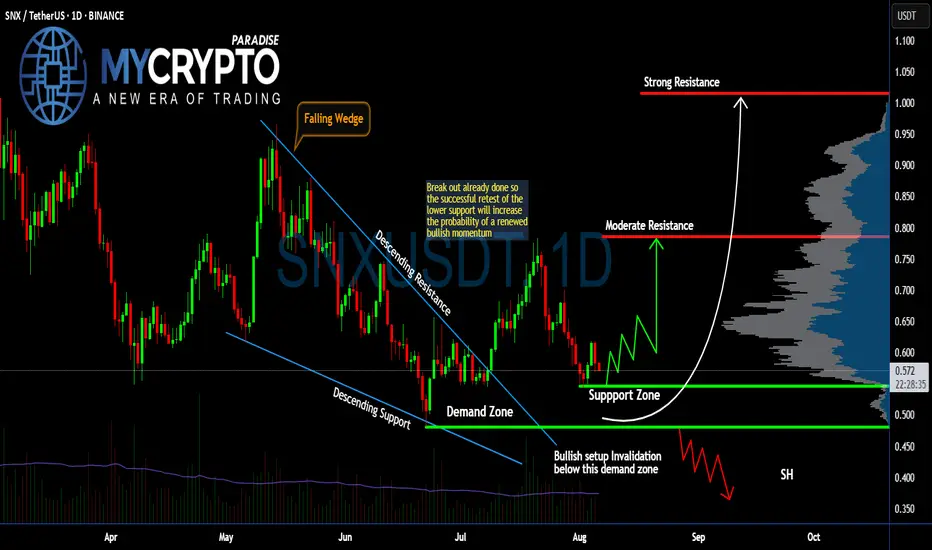
Can #SNX Bulls Sustain the Current Momentum? Watch it CloselyYello, Paradisers! Is this #SNX setup just another fakeout in disguise, or is the market quietly setting up for a major bullish momentum shift? Let’s dissect what’s really happening on #SNXUSDT:
💎After moving through a falling wedge pattern for months, #Synthetix has already broken out above the descending resistance, signaling an early shift in trend. However, the real move hasn’t yet begun—a proper retest of the support zone between $0.50–$0.54 is what we’re watching for now.
💎This support zone aligns with the prior wedge breakout and also overlaps with a visible demand area, making it a key region where buyers could step in again. If bulls defend this area successfully, we expect a renewed rally toward the moderate resistance level at $0.78.
💎From there, the next upside target lies at the strong resistance around $1.01—a level with heavy volume profile resistance and previous seller activity. But that level will only come into play if the bulls reclaim momentum with conviction.
💎On the flip side, if #SNXUSD breaks below $0.48, which is our bullish invalidation level, the setup collapses and opens the door for a deeper drop toward the $0.40–$0.35 zone, where short-sellers are likely to pile in.
Stay patient, Paradisers. Let the breakout confirm, and only then do we strike with conviction.
MyCryptoParadise
iFeel the success🌴
U.S. Government shuts down; Crypto rallies on uncertaintyU.S. Government shuts down; Crypto rallies on uncertainty
The U.S. government officially shut down on October 1, 2025, after Congress failed to agree on a budget. Disputes over spending and healthcare left agencies including the Fed, SEC, and CFTC paralyzed, delaying jobs and inflation data as well as ETF approvals for Solana and XRP.
Bitcoin, Ethereum, and other cryptocurrencies gained on Wednesday, with ETH up 4.2% to $4,330. Analysts said digital assets may be benefiting from pressure on the U.S. dollar, often seen as a trigger for crypto inflows.
Still, a prolonged shutdown could stall Fed rate-cut hopes by blocking key data releases. With borrowing costs already high, cryptos could face headwinds if the impasse drags on.

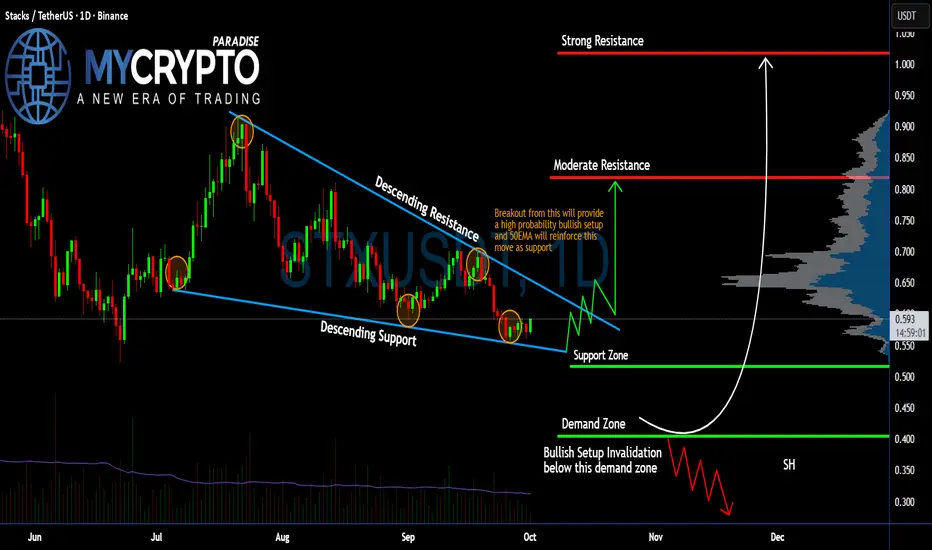
Is #STX Ready to Make an Explosive Bullish Move? Must Watch Yello Paradisers! Are we about to witness a powerful breakout of #STX, or is a trap lurking right under our feet? Let's decode this #STXUSDT setup before it’s too late:
💎#Stacks has been stuck in a clear falling wedge on the daily timeframe by consistently respecting both the descending resistance and descending support lines since late July. Price action is now compressing near the lower end of this structure, showing signs of potential accumulation.
💎Right now, #STXUSD is trading around $0.59, sitting just above the support zone at $0.51, and not far above the final demand zone at $0.40. This area is crucial. As long as bulls defend this zone, the structure remains intact and the bullish scenario is valid.
💎A confirmed breakout above the descending resistance, ideally with a retest of that line alongside support from the 50EMA, would flip this into a high-probability bullish setup. If that happens, we’ll first be targeting the moderate resistance at $0.818. A sustained move above $0.818 opens the door toward the strong resistance at $1.018. That’s your upside target, but only if we break the descending channel cleanly.
💎However, a break below $0.40 would invalidate this entire bullish structure. If this demand zone fails, the setup is broken, and the market could go on to sweep the lower liquidity zones, likely toward $0.30 and below. That’s where over-leveraged bulls will get wiped out.
Strive for consistency, wait for clear confirmations, and remember that discipline always beats chasing quick profits.
MyCryptoParadise
iFeel the success🌴
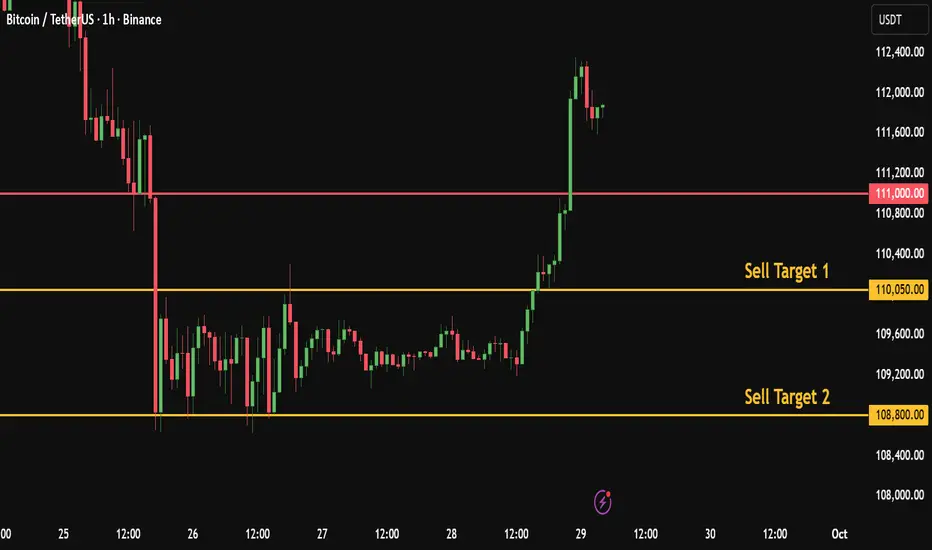
Daily Bitcoin Signal: Watching the 111K Breakout, target 108KBitcoin Daily Numeric Analysis
Based on my numeric analysis, Bitcoin is showing potential weakness near key support.
My Personal Short Setup
If price breaks and closes a 1H candle below 111K, I will enter a short trade.
🎯 Target 1: 110,050
🎯 Target 2: 108,800
❌ Stop-loss: 112,700
👍 Don’t forget to boost this trading idea if you found it helpful,
and follow me for more daily crypto insights and trade setups.
Please note:
This is not financial advice – I’m only sharing my personal trades.
Always do your own research before taking action.
Best of luck 🌹